

Abstract
Signaling mediated by the mechanistic target of rapamycin (mTOR) is believed to play a critical and positive role in adipogenesis, based on pharmacological evidence and genetic manipulation of mTOR regulators and targets. However, there is no direct genetic evidence for an autonomous role of mTOR itself in preadipocyte differentiation. To seek such evidence, we employed a conditional knockdown approach to deplete mTOR in preadipocytes. Surprisingly, while knockdown of S6K1, a target of mTOR, impairs 3T3-L1 preadipocyte differentiation, reduction of mTOR levels leads to increased differentiation. This enhanced adipogenesis requires the remaining mTOR activity, as mTOR inhibitors abolish differentiation in the mTOR knockdown cells. We also found that mTOR knockdown elevates the levels of CCAAT/enhancer-binding protein α (C/EBPα) and peroxisome proliferator-activated receptor γ (PPARγ). Furthermore, partial reduction of mTOR levels alleviates inhibition of Akt by mTORC1 via IRS1, while at the same time maintaining its positive input through mTORC1 into the adipogenic program. The greater sensitivity of the IRS1-Akt pathway to mTOR levels provides a mechanism that explains the net outcome of enhanced adipogenesis through PPARγ upon mTOR knockdown. Our observations reveal an unexpected role of mTOR in suppressing adipogenesis and suggest that mTOR governs the homeostasis of the adipogenic process by modulating multiple signaling pathways.
Keywords: mechanistic target of rapamycin complex 1, peroxisome proliferator-activated receptor γ, CCAAT/enhancer-binding protein α, adipocytes
The adipose tissue is central to lipid metabolism, insulin actions, and energy homeostasis. Adipogenesis is regulated by a gene expression program under the control of a network of transcription factors, including the CCAAT/enhancer-binding proteins C/EBPβ, C/EBPδ, C/EBPα and peroxisome proliferator-activated receptor γ (PPARγ) (1–3). Extracellular signals induce the expression of C/EBPβ and C/EBPδ in preadipocytes, which in turn activates the expression of PPARγ and C/EBPα. Subsequently, PPARγ and C/EBPα form a positive feedback loop to enhance and maintain their expression, resulting in activation of adipogenic genes required for adipocyte formation, function, and maintenance of the terminally differentiated state (1–3). A multitude of signals and pathways impinge on the PPARγ-C/EBPα module to regulate adipogenic differentiation, among which Akt, a major effector of the insulin/IRS/PI3K pathway, activates this module via several mechanisms (4).
The mechanistic target of rapamycin (mTOR), a protein kinase conserved from yeast to mammals, is an essential regulator of a wide range of cellular and developmental processes, from cell growth, to cell proliferation, to cell survival, to various types of cellular differentiation and embryogenesis (5–7). mTOR governs cellular functions and cell fates by assembling distinct signaling complexes and pathways that integrate signals from nutrient availability, cellular energy levels, and growth factors. There are two biochemically and functionally distinct mTOR complexes, mTORC1 and mTORC2, which mediate rapamycin-sensitive and rapamycin-insensitive signaling of mTOR, respectively (7, 8), although extensive crosstalk exists between the two complexes (9). The best-characterized substrates of mTORC1 are two regulators of translation initiation: ribosomal S6 kinase 1 (S6K1), a positive regulator, and eukaryotic initiation factor 4E binding protein (4E-BP), a negative regulator, both critically involved in mTOR regulation of cell growth and proliferation (6, 10).
The involvement of mTOR signaling in adipogenesis and lipid metabolism has been well recognized in recent years (11). In particular, a positive role of mTOR in adipogenesis has long been implicated by rapamycin inhibition of preadipocyte differentiation (12–14). Previously we demonstrated in 3T3-L1 cells that rapamycin-sensitive mTOR signaling controls preadipocyte differentiation by regulating PPARγ activity in response to amino acid sufficiency (15). It has also been reported that constitutive activation of mTORC1 via deletion of Tuberous sclerosis 2 (Tsc2) in MEF cells leads to enhanced adipogenic differentiation (16). Genetic studies in mice have revealed the involvement of S6K1 and 4E-BP in lipid metabolism and adipogenesis. Systemic deletion of S6k1 in mice is reported to protect the animals against aging- and diet-induced obesity, owing to enhanced β oxidation (17). Furthermore, S6K1 is necessary for the lineage commitment to early adipocyte progenitors in mice (18). On the other hand, the combined systemic disruption of 4ebp1 and 4ebp2 in mice increases the animal's sensitivity to diet-induced obesity, due to increased adipogenesis, reduced lipolysis, and enhanced fatty acid reesterification in the adipose tissue (19). While these studies provide genetic evidence indicating a positive role for mTORC1 signaling in adipogenesis, they may be confounded by systemic effects of the gene deletions, as mTORC1 is known to also function in the central nervous system to regulate energy balance (20–22). The adipose-specific knockout of raptor, resulting in reduced fat accumulation in mice (23), confirms an autonomous, and indispensable, function of mTORC1 in adipogenesis.
In seeking direct genetic evidence for an autonomous role of mTOR in preadipocyte differentiation, we employed a conditional knockdown system to deplete mTOR. Unexpectedly, our study uncovered a function of mTOR in the negative regulation of adipogenesis. While an mTOR-S6K1 pathway is required for preadipocyte differentiation by regulating PPARγ activity as we previously reported (15), mTOR also keeps the extent of adipogenic differentiation in check by suppressing the expression of PPARγ, most likely through mTORC1 inhibition of IRS1 and Akt activation.
MATERIALS AND METHODS
Antibodies and other reagents
All primary antibodies were from Cell Signaling Technology (MA), except anti-tubulin antibody (Abcam) and anti-C/EBPβ antibody (Santa Cruz Biotechnology). All secondary antibodies were from Jackson ImmunoResearch Laboratories, Inc. Collagenase D was from Roche. Adenoviruses expressing Cre or luciferase were obtained from the Gene Transfer Vector Core at the University of Iowa. All cell culture media and reagents were from Invitrogen. Akti (Akt inhibitor VIII, isozyme-Selective, Akti-1/2) was from Calbiochem. Torin1 was a generous gift from Dr. David Sabatini (HHMI, MIT). All other reagents were from Sigma-Aldrich.
Cell culture
The 3T3-L1 preadipocytes were maintained at 37°C in 5% CO2 in DME containing 4.5 g/l glucose and 10% fetal bovine serum (referred to as M-1). For differentiation, the cells were grown to confluence in M-1 and maintained in M-1 for 2 more days before switching to M-2 medium (M-1 plus 1.5 μg/ml insulin, 0.5 mM IBMX, and 1.0 μM dexamethasone). After 48 h, the medium was replaced by M-3 (M-1 plus 1.5 μg/ml insulin), and differentiation was allowed to proceed in M-3 for 6–8 days.
Lentivirus-delivered Cre/Lox-mediated shRNA expression
The pSico lentiviral vector was a generous gift from Drs. T. Jacks (MIT) and A. Ventura (Sloan Kettering Cancer Center) (24). Using the PSICOLIGOMAKER program developed by the Jacks laboratory, the following target sequences for shRNAs were identified and cloned into pSico via HpaI and XhoI sites: mTOR-shRNA1, 5′-GGAGTCTACTCGCTTCT AT; mTOR-shRNA2, 5′-GCATCATTCACCCAATAGT; S6K1-shRNA1, 5′-GGAGTTTGGG AGCATTAAT; S6K1-shRNA2, 5′-GGAAGATATTTGCCATGAA. Lentiviruses were packaged in 293T cells as previously described (25). The 3T3-L1 preadipocytes were infected with the shRNA-carrying lentiviruses, and GFP-positive cells were enriched by cell sorting and then cultured for differentiation. At the time of switching from M-1 to M-2 medium, the cells were infected by adenoviruses expressing Cre or luciferase at MOI of 50.
Oil Red O staining and lipid content assay
Oil Red O staining to examine lipid contents was performed as reported (26) with minor modifications. Briefly, 3T3-L1 adipocytes were washed with PBS, fixed in 10% formalin for 2 h, and stained with 0.2% (w/v) Oil Red O solution in 60% (v/v) isopropanol for 10–60 min. Cells were then rinsed with water and air-dried at room temperature. The stained cells were examined under a microscope (DMI 4000B; Leica) with a 10× dry objective (Fluotar, numerical aperture 0.4; Leica), and the bright-field images were captured at 24 bits at room temperature using a camera (RETIGA EXi; Q-Imaging) equipped with Q-Capture Pro51 software (Q-Imaging). The images were then processed in Photoshop CS5 (Adobe), where brightness and contrast were adjusted. To determine lipid contents, isopropanol (0.5 ml per well of 24-well plate) was added to the stained cells to extract the dye, and the solution was transferred to a 96-well plate and measured by a spectrophotometer at 492 nm.
Western blotting
Cultured cells were lysed in MIPT buffer (20 mM Tris-HCl at pH7.5, 0.1 mM Na3VO4, 25 mM NaF, 25 mM glycerophosphate, 2 mM EGTA, 1 mM dithiothreitol, 0.5 mM phenylmethylsulfonyl fluoride, 0.3% Triton X-100). The lysates were mixed at 1:1 with Laemmli sample buffer and boiled before resolving on SDS-PAGE and transferring onto polyvinylidene fluoride membrane (Millipore). Primary antibody incubations followed manufacturers’ recommendations. Detection of horseradish peroxidase-conjugated secondary antibodies was performed with Western Lightning™ Chemiluminescence Reagent Plus (PerkinElmer), and images were developed on X-ray films.
Quantitative RT-PCR
Total RNA was isolated from differentiating 3T3-L1 cells using Trizol (Invitrogen). cDNA was synthesized from 1 μg RNA using qScript cDNA synthesis kit (Quanta Biosciences), followed by quantitative PCR with StepOne Plus (Applied Biosystems). The 36B4 gene was used as a reference to obtain relative fold change for target samples using the comparative CT method. Prevalidated mouse LPL, FAS, and PPARγ primers were purchased from Qiagen (QuantiTect Primer Assays).
Statistical analysis
All data are presented as mean ± SD. Whenever necessary, statistical significance of the data comparison was analyzed by performing one-sample t-test.
RESULTS
S6K1 is required for 3T3-L1 preadipocyte differentiation
Systemic deletion of S6K1 in mice protects the animals against obesity (17, 18). To examine whether S6K1 might be directly involved in adipogenic differentiation in a cell-autonomous manner, we aimed to knock down S6K1 in the mouse 3T3-L1 preadipocytes. Because S6K1 is important for cell growth and proliferation and because 3T3-L1 differentiation requires cell proliferation both before induction of differentiation and at the clonal expansion stage, specific assessment of the role of S6K1 in differentiation would require knockdown of the gene in confluent and cell-cycle-arrested cells. Thus, we utilized a Cre/lox-controlled shRNA expression system (pSico) (24), in which a desired shRNA can only be expressed when a cDNA insertion separating the U6 promoter and the shRNA-encoding sequence is eliminated by Cre-dependent recombination (Fig. 1A). The pSico vector carrying a specific shRNA was first stably introduced into 3T3-L1 preadipocytes via lentivirus infection. At the time of differentiation induction, the cells were infected with an adenovirus expressing Cre recombinase. An adenovirus expressing luciferase was used as the control for all comparisons, eliminating any potential complication of viral effects. Effective S6K1 knockdown was observed 3 days later (data not shown) and sustained for at least 6 days thereafter (Fig. 1B), which was accompanied by a decrease in the expression level of the adipocyte-specific fatty acid binding protein aP2, a terminal differentiation marker. As shown by Oil Red O staining (Fig. 1C), fat accumulation was drastically suppressed in S6K1 knockdown cells. Two independent shRNAs targeting S6K1 yielded similar outcomes, validating the specificity of knockdown. These results are consistent with an important cell-autonomous function for S6K1 in adipogenesis.
Fig. 1.

S6K1 is required for 3T3-L1 preadipocyte differentiation. (A) Diagrammatic depiction of Cre-induced activation of shRNA expression utilizing the pSico lentiviral vector. (B) 3T3-L1 preadipocytes were infected with two independent pSico-S6K1-shRNA lentiviruses (shS6K1-1 and shS6K1-2). GFP-positive cells were collected by cell-sorting and then infected with adenovirus expressing Cre or luciferase (Luc), at the time of initiating differentiation. After 6 days of differentiation, the cells were lysed and subjected to Western analyses. (C) Cells as described in (B) were fixed and stained with Oil Red O. Scale bar: 50 µm. (D) 3T3-L1 cells were induced to differentiate for 8 days, with the S6K1 inhibitor PF4708671 (30 µM) added 2 days before differentiation (Day −2) or on Day 0, 2, or 4 of differentiation. Data shown are representative of 3–4 independent experiments.
To further determine at which stage S6K1 is necessary for adipogenic differentiation, we examined the effect of an S6K1-specific inhibitor, PF-4708671 (27), which was added to the differentiation medium at the clonal expansion stage (2 days before switching to differentiation medium), or 0, 2, or 4 days of differentiation. The effectiveness of S6K1 inhibition was confirmed by the nearly complete loss of phosphorylation of S6, whereas as expected, phosphorylation of S6K1 (by mTOR) was unaffected (Fig. 1D). Interestingly, this S6K1 inhibitor suppressed the expression of aP2 to a similar extent under all conditions after 8 days of differentiation, even when the inhibitor treatment started on Day 4 of differentiation (Fig. 1D). This observation not only confirms the S6K1 knockdown phenotype but also suggests that S6K1 may play a role in sustaining differentiation.
Partial depletion of mTOR enhances 3T3-L1 preadipocyte differentiation
Rapamycin potently inhibits 3T3-L1 differentiation when added after the clonal expansion phase (12, 14, 15), suggesting that mTOR plays a key role in a later stage of adipogenic differentiation. To seek genetic evidence for this specific mTOR function separately from the expected role of mTOR in cell proliferation and clonal expansion, we used the same knockdown approach as described above for S6K1. Two independent lox-flanked shRNA sequences targeting mTOR were introduced into 3T3-L1 cells via pSico-based lentiviral infection, and the knockdown was activated by adenovirus-delivered Cre expression at the time of differentiation induction. Unexpectedly, mTOR knockdown enhanced, rather than reduced, lipid droplet formation in these cells, as shown by Oil Red O staining and its quantification, and this was observed with both shRNAs (Fig. 2A, B). Furthermore, the knockdown of mTOR was accompanied by a reduction of phosphorylation on T389 of S6K1 and S65 of 4E-BP1 (both mTOR sites) and by a clear increase of the adipogenic marker aP2 expression (Fig. 2C). These observations suggest that, contrary to the widely accepted notion, mTOR may have a negative role in regulating adipogenesis.
Fig. 2.

Partial depletion of mTOR enhances 3T3-L1 preadipocyte differentiation. 3T3-L1 preadipocytes were infected with two independent pSico-mTOR-shRNA lentiviruses (shmTOR-1 and shmTOR-2). GFP-positive cells were collected by cell-sorting and then infected with adenovirus expressing Cre or luciferase (Luc), at the time of initiating differentiation. After 6 days of differentiation, the cells were either (A) fixed and stained with Oil Red O (scale bar: 50 µm) and (B) quantified for lipid contents or (C) lysed and subjected to Western analyses. Representative results of three independent experiments are shown in (A) and (C), and the average results are shown in (B) with error bars representing standard deviation. One-sample t-tests were performed. *P < 0.05.
Importantly, adipogenic differentiation in mTOR knockdown cells, as indicated by the lipid content (Fig. 3A) and aP2 expression (Fig. 3B), was abolished by rapamycin as well as by Torin1, a specific inhibitor of mTOR kinase (28). This suggests that differentiation in the cells with reduced mTOR expression was not through any mTOR-independent compensatory pathway and that the residual mTORC1 activity in the knockdown cells was required for differentiation. Of note, phosphorylation of S6K1 remained at a substantial level in mTOR knockdown cells, and it was abolished by Torin1 or rapamycin treatment (Fig. 3B), which is consistent with S6K1 being essential for adipogenic differentiation. Taken together, our results imply a dual function for mTOR in adipogenesis: mTOR may suppress the extent of differentiation and at the same time play an indispensable role in supporting differentiation.
Fig. 3.
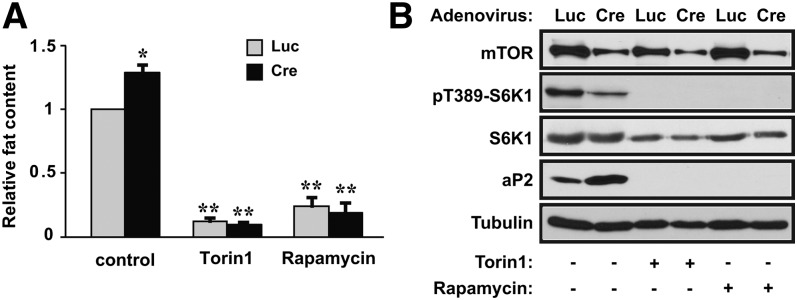
Inhibitors of mTOR abolish adipogenic differentiation in mTOR knockdown cells. 3T3-L1 preadipocytes were infected with pSico-mTOR-shRNA lentivirus (shmTOR-1). At the time of initiating differentiation, the cells were infected with adenovirus expressing Cre or luciferase (Luc), and then Torin1 (200 nM) or rapamycin (200 nM) was added to the media. After 8 days of differentiation, the cells were either (A) stained with Oil Red O and quantified for lipid contents or (B) subjected to Western analysis. Representative results of three independent experiments are shown in (B) and the average results are shown in (A) with error bars representing standard deviation. One-sample t-tests were performed. *P < 0.05, **P < 0.01.
mTOR depletion upregulates PPARγ and the adipogenic transcriptional program
We examined the expression of adipogenic genes in 3T3-L1 adipocytes and found that mTOR knockdown resulted in significantly elevated levels of C/EBPα and PPARγ (Fig. 4A), both key transcription factors controlling the adipogenic gene expression program. The expression of C/EBPβ, an upstream regulator of C/EBPα and PPARγ, remained unchanged (Fig. 4A). Furthermore, the mRNA expression levels of PPARγ and the lipogenic genes lipoprotein lipase (LPL) and fatty acid synthase (FAS) were also significantly increased in mTOR knockdown cells (Fig. 4B). These results are consistent with an upregulated adipogenic gene expression program and indicate a negative role of mTOR in modulating this program.
Fig. 4.

mTOR depletion increases PPARγ and C/EBPα levels and adipogenic gene expression. (A) 3T3-L1 preadipocytes were infected with pSico-mTOR-shRNA lentiviruses (shmTOR-1 and shmTOR-2), followed by infection with adenovirus expressing Cre or luciferase (Luc) at the time of initiating differentiation. After 6 days of differentiation, cells were lysed and analyzed by Western blotting. (B) Cells treated as in (A) were subjected to RNA isolation and quantitative RT-PCR. The average results of three independent experiments are shown with error bars representing standard deviation. One-sample t-test was performed to compare Cre virus-infected to Luc virus-infected cells for each gene. *P < 0.05. (C) Cells were infected with shS6K1 viruses and then treated as in (A), followed by Western analysis of cell lysates.
On the other hand, S6K1 knockdown dampened C/EBPα and PPARγ expression (Fig. 4C). Previously we reported that rapamycin impairs adipogenic differentiation of 3T3-L1 cells by inhibiting PPARγ transcriptional activity and, subsequently, PPARγ and C/EBPα expression (15). The knockdown of S6K1 mirrored the effect of rapamycin, suggesting that S6K1 may mediate mTOR function in the positive regulation of PPARγ and adipogenesis. Hence, mTOR most likely plays two opposing roles in modulating adipogenic differentiation through PPARγ.
mTOR depletion enhances adipogenesis through upregulation of Akt, a regulator of PPARγ
In searching for a mechanism underlying this suppressive function of mTOR, we considered the feedback inhibition of PI3K/Akt signaling by mTORC1, which had been well established in various biological contexts, such as insulin actions (29). mTORC1, either directly or through S6K1, can phosphorylate IRS1 on serine residues, resulting in IRS1 degradation and/or impairment of IRS1 signaling to PI3K/Akt. Because Akt is a major upstream regulator of PPARγ in adipogenesis (4), we asked whether the IRS1/Akt pathway may be a mediator of the negative function of mTOR. As shown in Fig. 5A, phosphorylation of Akt at both Thr308 and Ser473 was clearly increased upon mTOR knockdown. Concomitantly, IRS1 phosphorylation on Ser636/639, a reported mTORC1 site (17, 30), was almost abolished. Another potential mediator of the feedback inhibition of PI3K/Akt signaling by mTORC1 is Grb10, an adaptor protein that is phosphorylated and stabilized by mTORC1 (31, 32). However, neither phosphorylation of Grb10 nor its levels changed upon partial depletion of mTOR in 3T3-L1 cells (Fig. 5A). Therefore, while IRS1 may play a role, it is unlikely that Grb10 is involved in the negative regulation of adipogenic differentiation by mTOR.
Fig. 5.

mTOR depletion enhances adipogenic differentiation through inhibition of IRS1 phosphorylation and activation of Akt. (A) 3T3-L1 preadipocytes were infected with shmTOR-1 virus, followed by infection with adenovirus expressing Cre or luciferase (Luc) at the time of initiating differentiation. After 6 days of differentiation, cells were lysed and analyzed by Western blotting. (B and C) Cells were treated as in (A), and Akti (4 µM) was added to the media at the initiation of differentiation. At the end of differentiation, the cells were either (B) lysed for Western analysis or (C) stained with Oil Red O and quantified for lipid contents. Representative results of three independent experiments are shown in (A) and (B) and the average results are shown in (C) with error bars representing standard deviation. One-sample t-tests were performed. *P < 0.05, **P < 0.01.
To ascertain whether Akt mediates the effect of mTOR knockdown on adipogenesis, we treated 3T3-L1 cells with an inhibitor of Akt1 and Akt2 (Akti). As shown in Fig. 5B, Akti completely eliminated the expression of PPARγ and aP2 in mTOR knockdown cells as well as in the control cells, which was corroborated by a drastic decrease of lipid contents (Fig. 5C). The effectiveness of the inhibitor was confirmed by its suppression of Akt phosphorylation (Fig. 5B) as previously reported (33). Taken together, these results suggest that mTORC1 dampens adipogenic differentiation by suppressing Akt activation via IRS1.
DISCUSSION
Among its myriad of cellular and developmental functions, mTOR has emerged as a key regulator of lipid metabolism and adipogenesis in recent years. The adipogenic function of mTORC1 in vivo is evidenced by the reduced and increased adiposity in S6k1−/− (17, 18) and 4ebp1/2−/− mice (19), respectively, and by the lean phenotype of adipose-specific raptor knockout mice (23). A positive regulatory role of mTOR in adipogenesis has also been established in preadipocyte differentiation in vitro through the effects of rapamycin and manipulation of the mTORC1 upstream regulator TSC2 (12–16). There has been no direct genetic evidence for the role of mTOR itself in adipogenesis either in vitro or in vivo. Our current study was designed to seek genetic validation of the importance of mTOR in adipogenic differentiation and, surprisingly, led to the discovery of an inhibitory function of mTOR.
Revelation of the unexpected negative regulation of adipogenesis by mTOR owes to the partial, instead of complete, depletion of mTOR by RNAi-mediated knockdown, which apparently removes the negative regulation while preserving the positive regulation by mTOR. mTORC1 most likely exerts its negative function by serine phosphorylation of IRS1, which leads to IRS1 inhibition and subsequent suppression of Akt activation. This inhibitory pathway has been previously established for insulin/IGF signaling in the regulation of glucose metabolism and cell growth (7, 29). Note that mTOR, in the form of mTORC2, is responsible for Ser473 phosphorylation and activation of Akt in a wide range of cell/tissue types, including adipocytes and adipose tissues (34–37). Hence, mTOR has at least three inputs that ultimately impinge on the adipogenic gene expression program (Fig. 6A): i) mTORC1 regulation of PPARγ activity through S6K1; ii) mTORC1 inhibition of Akt through IRS1 phosphorylation; and iii) mTORC2 activation of Akt. While many pathways have been proposed to mediate Akt regulation of PPARγ (4), the mechanism by which mTORC1 regulates PPARγ is not yet clear. Nevertheless, mTORC1 and Akt most likely act in parallel, and both pathways are indispensable for PPARγ activation. Both rapamycin and the S6K1 inhibitor PF4708671 effectively block adipogenic differentiation, even when added to cells that are well into the differentiation program (15) (Fig. 1D), which is consistent with PPARγ playing a central role in not only initiating the adipogenic program but also maintaining the terminally differentiated state (3).
Fig. 6.

mTOR controls homeostasis of adipogenesis - a model. (A) We propose that two pathways, mTORC1-S6K1 and PI3K-Akt, act in parallel to positively control adipogenic gene expression and differentiation. The two pathways are not redundant; rather, each is required. In addition, mTORC1 suppresses IRS1 and subsequently Akt, whereas mTORC2 contributes to Akt activation. The physiological levels of these players and signals maintain the homeostatic state of adipogenesis. (B) Upon rapamycin treatment or S6K1 depletion, the mTORC1-S6K1 pathway is inhibited, and adipogenesis is blocked. (C) When mTOR is partially depleted by knockdown, the levels of both mTORC1 and mTORC2 are still sufficient to signal to S6K1 and Akt, respectively. However, reduction of mTORC1 alleviates the inhibition of IRS1, leading to hyperactivation of Akt and enhanced adipogenic differentiation. Gray color denotes reduction of protein level or signaling strength.
We propose that, through the aforementioned pathways, mTOR maintains the homeostatic state of adipogenesis (Fig. 6A). Upon rapamycin inhibition of mTORC1 or depletion of S6K1, the essential input from mTORC1 to PPARγ is abrogated, resulting in inhibition of adipogenesis despite hyperactivation of Akt (Fig. 6B). However, when the protein level of mTOR is partially reduced (as in our knockdown experiments), the three effectors are differentially affected; the remaining mTOR allows sufficient levels of mTORC1 for S6K1 and PPARγ activation, as well as mTORC2 for Akt phosphorylation, but the inhibition of IRS1 is markedly alleviated due to reduced mTORC1 activity, leading to hyperactivation of Akt and a net increase of adipogenesis (Fig. 6C). The differential responses of mTORC1 and mTORC2 to depletion of mTOR are consistent with those observed by Lamming et al. in mouse liver, where reduction of mTOR protein levels by heterozygous deletion of the mtor gene led to decreased mTORC1 activity without affecting mTORC2 signaling (38). This is also conceptually reminiscent of the reported observations that reducing p85α expression levels by 50% enhances PI3K signaling and insulin sensitivity (39), whereas ablation of p85α expression impairs PI3K functions (40, 41). In that case, presumably an intermediate level of p85α results in optimal stoichiometry of the p85-p110-IRS complex and thus maximal PI3K signaling.
Laplante et al. recently reported that overexpression of the mTOR inhibitor DEPTOR promotes adipogenesis in vivo (42), which corroborates our main conclusion in this study. Overexpression of DEPTOR is found to suppress Ser636/639 phosphorylation of IRS1 and enhance Akt phosphorylation in adipocytes (42). DEPTOR is capable of inhibiting both mTORC1 and mTORC2 kinase activity (43); hence, the differential effects of DEPTOR overexpression on mTORC1 inhibition of Akt and mTORC2 activation of Akt mirror those of mTOR depletion. It has also been reported that increased dietary leucine intake counters the effects of high-fat diet on increased adiposity in mice without affecting food intake (44), which is consistent with a negative role of mTORC1 in adipogenesis, as leucine is known to activate mTORC1 (45–47).
In conclusion, our findings underline a homeostatic role of mTOR in adipogenesis. The level of mTOR protein and/or activity influences the balance between adipogenesis-promoting and adipogenesis-suppressing functions and determines the net outcome of fat formation. These new molecular insights may contribute to the development of therapeutic strategies against obesity and related diseases.
Acknowledgments
The authors thank Ms. Ike Joewono for technical assistance.
Footnotes
Abbreviations:
- 4E-BP
- eukaryotic initiation factor 4E binding protein
- C/EBP
- CCAAT/enhancer-binding protein
- mTOR
- mechanistic target of rapamycin
- PPARγ
- peroxisome proliferator-activated receptor γ S6K1, ribosomal S6 kinase 1
This work was supported by the National Institutes of Health Grants AR-048914 and GM-089771 (to J.C.).
REFERENCES
- 1.Darlington G. J., Ross S. E., MacDougald O. A. 1998. The role of C/EBP genes in adipocyte differentiation. J. Biol. Chem. 273: 30057–30060 [DOI] [PubMed] [Google Scholar]
- 2.Morrison R. F., Farmer S. R. 2000. Hormonal signaling and transcriptional control of adipocyte differentiation. J. Nutr. 130: 3116S–3121S [DOI] [PubMed] [Google Scholar]
- 3.Rosen E. D., Walkey C. J., Puigserver P., Spiegelman B. M. 2000. Transcriptional regulation of adipogenesis. Genes Dev. 14: 1293–1307 [PubMed] [Google Scholar]
- 4.Rosen E. D., MacDougald O. A. 2006. Adipocyte differentiation from the inside out. Nat. Rev. Mol. Cell Biol. 7: 885–896 [DOI] [PubMed] [Google Scholar]
- 5.Erbay E., Kim J. E., Chen J. 2005. Amino acid-sensing mTOR signaling. In Nutrient and Cell Signaling. J. Zempleni and K. Dakshinamurti, editors. CRC Press. 353–380. [Google Scholar]
- 6.Fingar D. C., Blenis J. 2004. Target of rapamycin (TOR): an integrator of nutrient and growth factor signals and coordinator of cell growth and cell cycle progression. Oncogene. 23: 3151–3171 [DOI] [PubMed] [Google Scholar]
- 7.Sarbassov D. D., Ali S. M., Sabatini D. M. 2005. Growing roles for the mTOR pathway. Curr. Opin. Cell Biol. 17: 596–603 [DOI] [PubMed] [Google Scholar]
- 8.Wullschleger S., Loewith R., Hall M. N. 2006. TOR signaling in growth and metabolism. Cell. 124: 471–484 [DOI] [PubMed] [Google Scholar]
- 9.Foster K. G., Fingar D. C. 2010. Mammalian target of rapamycin (mTOR): conducting the cellular signaling symphony. J. Biol. Chem. 285: 14071–14077. [DOI] [PMC free article] [PubMed] [Google Scholar]
- 10.Ma X. M., Blenis J. 2009. Molecular mechanisms of mTOR-mediated translational control. Nat. Rev. Mol. Cell Biol. 10: 307–318 [DOI] [PubMed] [Google Scholar]
- 11.Laplante M., Sabatini D. M. 2009. An emerging role of mTOR in lipid biosynthesis. Curr. Biol. 19: R1046–R1052 [DOI] [PMC free article] [PubMed] [Google Scholar]
- 12.Yeh W. C., Bierer B. E., McKnight S. L. 1995. Rapamycin inhibits clonal expansion and adipogenic differentiation of 3T3–L1 cells. Proc. Natl. Acad. Sci. USA. 92: 11086–11090 [DOI] [PMC free article] [PubMed] [Google Scholar]
- 13.Bell A., Grunder L., Sorisky A. 2000. Rapamycin inhibits human adipocyte differentiation in primary culture. Obes. Res. 8: 249–254 [DOI] [PubMed] [Google Scholar]
- 14.Gagnon A., Lau S., Sorisky A. 2001. Rapamycin-sensitive phase of 3T3–L1 preadipocyte differentiation after clonal expansion. J. Cell. Physiol. 189: 14–22 [DOI] [PubMed] [Google Scholar]
- 15.Kim J. E., Chen J. 2004. Regulation of peroxisome proliferator-activated receptor-gamma activity by mammalian target of rapamycin and amino acids in adipogenesis. Diabetes. 53: 2748–2756 [DOI] [PubMed] [Google Scholar]
- 16.Zhang H. H., Huang J., Düvel K., Boback B., Wu S., Squillace R. M., Wu C-L., Manning B. D. 2009. Insulin stimulates adipogenesis through the Akt-TSC2-mTORC1 pathway. PLoS ONE. 4: e6189. [DOI] [PMC free article] [PubMed] [Google Scholar]
- 17.Um S. H., Frigerio F., Watanabe M., Picard F., Joaquin M., Sticker M., Fumagalli S., Allegrini P. R., Kozma S. C., Auwerx J., et al. 2004. Absence of S6K1 protects against age- and diet-induced obesity while enhancing insulin sensitivity. Nature. 431: 200–205 [DOI] [PubMed] [Google Scholar]
- 18.Carnevalli L. S., Masuda K., Frigerio F., Le Bacquer O., Um S. H., Gandin V., Topisirovic I., Sonenberg N., Thomas G., Kozma S. C. 2010. S6K1 plays a critical role in early adipocyte differentiation. Dev. Cell. 18: 763–774 [DOI] [PMC free article] [PubMed] [Google Scholar]
- 19.Le Bacquer O., Petroulakis E., Paglialunga S., Poulin F., Richard D., Cianflone K., Sonenberg N. 2007. Elevated sensitivity to diet-induced obesity and insulin resistance in mice lacking 4E-BP1 and 4E-BP2. J. Clin. Invest. 117: 387–396 [DOI] [PMC free article] [PubMed] [Google Scholar]
- 20.Cota D., Proulx K., Smith K. A., Kozma S. C., Thomas G., Woods S. C., Seeley R. J. 2006. Hypothalamic mTOR signaling regulates food intake. Science. 312: 927–930 [DOI] [PubMed] [Google Scholar]
- 21.Mori H., Inoki K., Munzberg H., Opland D., Faouzi M., Villanueva E. C., Ikenoue T., Kwiatkowski D., MacDougald O. A., Myers M. G., Jr, et al. 2009. Critical role for hypothalamic mTOR activity in energy balance. Cell Metab. 9: 362–374 [DOI] [PMC free article] [PubMed] [Google Scholar]
- 22.Yang S. B., Tien A. C., Boddupalli G., Xu A. W., Jan Y. N., Jan L. Y. 2012. Rapamycin ameliorates age-dependent obesity associated with increased mTOR signaling in hypothalamic POMC neurons. Neuron. 75: 425–436 [DOI] [PMC free article] [PubMed] [Google Scholar]
- 23.Polak P., Cybulski N., Feige J. N., Auwerx J., Ruegg M. A., Hall M. N. 2008. Adipose-specific knockout of raptor results in lean mice with enhanced mitochondrial respiration. Cell Metab. 8: 399–410 [DOI] [PubMed] [Google Scholar]
- 24.Ventura A., Meissner A., Dillon C. P., McManus M., Sharp P. A., Van Parijs L., Jaenisch R., Jacks T. 2004. Cre-lox-regulated conditional RNA interference from transgenes. Proc. Natl. Acad. Sci. U S A 101: 10380–10385. [DOI] [PMC free article] [PubMed] [Google Scholar]
- 25.Kim J. H., Kim J. E., Liu H. Y., Cao W., Chen J. 2008. Regulation of interleukin-6-induced hepatic insulin resistance by mammalian target of rapamycin through the STAT3-SOCS3 pathway. J. Biol. Chem. 283: 708–715 [DOI] [PubMed] [Google Scholar]
- 26.Ramirez-Zacarias J. L., Castro-Munozledo F., Kuri-Harcuch W. 1992. Quantitation of adipose conversion and triglycerides by staining intracytoplasmic lipids with Oil red O. Histochemistry. 97: 493–497 [DOI] [PubMed] [Google Scholar]
- 27.Pearce L. R., Alton G. R., Richter D. T., Kath J. C., Lingardo L., Chapman J., Hwang C., Alessi D. R. 2010. Characterization of PF-4708671, a novel and highly specific inhibitor of p70 ribosomal S6 kinase (S6K1). Biochem. J. 431: 245–255. [DOI] [PubMed] [Google Scholar]
- 28.Liu Q., Chang J. W., Wang J., Kang S. A., Thoreen C. C., Markhard A., Hur W., Zhang J., Sim T., Sabatini D. M., et al. 2010. Discovery of 1-(4-(4-propionylpiperazin-1-yl)-3-(trifluoromethyl)phenyl)-9-(quinolin-3-yl)benzo[h][1,6]naphthyridin-2(1H)-one as a highly potent, selective mammalian target of rapamycin (mTOR) inhibitor for the treatment of cancer. J. Med. Chem. 53: 7146–7155 [DOI] [PMC free article] [PubMed] [Google Scholar]
- 29.Um S. H., D'Alessio D., Thomas G. 2006. Nutrient overload, insulin resistance, and ribosomal protein S6 kinase 1, S6K1. Cell Metab. 3: 393–402 [DOI] [PubMed] [Google Scholar]
- 30.Tzatsos A., Kandror K. V. 2006. Nutrients suppress phosphatidylinositol 3-kinase/Akt signaling via raptor-dependent mTOR-mediated insulin receptor substrate 1 phosphorylation. Mol. Cell. Biol. 26: 63–76 [DOI] [PMC free article] [PubMed] [Google Scholar]
- 31.Hsu P. P., Kang S. A., Rameseder J., Zhang Y., Ottina K. A., Lim D., Peterson T. R., Choi Y., Gray N. S., Yaffe M. B., et al. 2011. The mTOR-regulated phosphoproteome reveals a mechanism of mTORC1-mediated inhibition of growth factor signaling. Science. 332: 1317–1322 [DOI] [PMC free article] [PubMed] [Google Scholar]
- 32.Yu Y., Yoon S-O., Poulogiannis G., Yang Q., Ma X. M., Villen J., Kubica N., Hoffman G. R., Cantley L. C., Gygi S. P., et al. 2011. Phosphoproteomic analysis identifies Grb10 as an mTORC1 substrate that negatively regulates insulin signaling. Science. 332: 1322–1326 [DOI] [PMC free article] [PubMed] [Google Scholar]
- 33.Barnett S. F., Defeo-Jones D., Fu S., Hancock P. J., Haskell K. M., Jones R. E., Kahana J. A., Kral A. M., Leander K., Lee L. L., et al. 2005. Identification and characterization of pleckstrin-homology-domain-dependent and isoenzyme-specific Akt inhibitors. Biochem. J. 385: 399–408 [DOI] [PMC free article] [PubMed] [Google Scholar]
- 34.Hresko R. C., Mueckler M. 2005. mTOR.RICTOR is the Ser473 kinase for Akt/protein kinase B in 3T3-L1 adipocytes. J. Biol. Chem 280: 40406–40416. [DOI] [PubMed] [Google Scholar]
- 35.Kumar A., Lawrence J. C., Jr, Jung D. Y., Ko H. J., Keller S. R., Kim J. K., Magnuson M. A., Harris T. E. 2010. Fat cell-specific ablation of rictor in mice impairs insulin-regulated fat cell and whole-body glucose and lipid metabolism. Diabetes 59: 1397–1406. [DOI] [PMC free article] [PubMed] [Google Scholar]
- 36.Cybulski N., Polak P., Auwerx J., Ruegg M. A., Hall M. N. 2009. mTOR complex 2 in adipose tissue negatively controls whole-body growth. Proc. Natl. Acad. Sci. U S A 106: 9902–9907. [DOI] [PMC free article] [PubMed] [Google Scholar]
- 37.Sarbassov D. D., Guertin D. A., Ali S. M., Sabatini D. M. 2005. Phosphorylation and regulation of Akt/PKB by the rictor-mTOR complex. Science. 307: 1098–1101 [DOI] [PubMed] [Google Scholar]
- 38.Lamming D. W., Ye L., Katajisto P., Goncalves M. D., Saitoh M., Stevens D. M., Davis J. G., Salmon A. B., Richardson A., Ahima R. S., et al. 2012. Rapamycin-induced insulin resistance is mediated by mTORC2 loss and uncoupled from longevity. Science. 335: 1638–1643 [DOI] [PMC free article] [PubMed] [Google Scholar]
- 39.Mauvais-Jarvis F., Ueki K., Fruman D. A., Hirshman M. F., Sakamoto K., Goodyear L. J., Iannacone M., Accili D., Cantley L. C., Kahn C. R. 2002. Reduced expression of the murine p85alpha subunit of phosphoinositide 3-kinase improves insulin signaling and ameliorates diabetes. J. Clin. Invest. 109: 141–149 [DOI] [PMC free article] [PubMed] [Google Scholar]
- 40.Fruman D. A., Snapper S. B., Yballe C. M., Davidson L., Yu J. Y., Alt F. W., Cantley L. C. 1999. Impaired B cell development and proliferation in absence of phosphoinositide 3-kinase p85alpha. Science. 283: 393–397 [DOI] [PubMed] [Google Scholar]
- 41.Fruman D. A., Mauvais-Jarvis F., Pollard D. A., Yballe C. M., Brazil D., Bronson R. T., Kahn C. R., Cantley L. C. 2000. Hypoglycaemia, liver necrosis and perinatal death in mice lacking all isoforms of phosphoinositide 3-kinase p85 alpha. Nat. Genet. 26: 379–382 [DOI] [PubMed] [Google Scholar]
- 42.Laplante M., Horvat S., Festuccia W. T., Birsoy K., Prevorsek Z., Efeyan A., Sabatini D. M. 2012. DEPTOR cell-autonomously promotes adipogenesis, and its expression is associated with obesity. Cell Metab. 16: 202–212 [DOI] [PMC free article] [PubMed] [Google Scholar]
- 43.Peterson T. R., Laplante M., Thoreen C. C., Sancak Y., Kang S. A., Kuehl W. M., Gray N. S., Sabatini D. M. 2009. DEPTOR is an mTOR inhibitor frequently overexpressed in multiple myeloma cells and required for their survival. Cell. 137: 873–886 [DOI] [PMC free article] [PubMed] [Google Scholar]
- 44.Zhang Y., Guo K., LeBlanc R. E., Loh D., Schwartz G. J., Yu Y. H. 2007. Increasing dietary leucine intake reduces diet-induced obesity and improves glucose and cholesterol metabolism in mice via multimechanisms. Diabetes. 56: 1647–1654 [DOI] [PubMed] [Google Scholar]
- 45.Fox H. L., Pham P. T., Kimball S. R., Jefferson L. S., Lynch C. J. 1998. Amino acid effects on translational repressor 4E–BP1 are mediated primarily by L-leucine in isolated adipocytes. Am. J. Physiol. 275: C1232–C1238 [DOI] [PubMed] [Google Scholar]
- 46.Patti M. E., Brambilla E., Luzi L., Landaker E. J., Kahn C. R. 1998. Bidirectional modulation of insulin action by amino acids. J. Clin. Invest. 101: 1519–1529 [DOI] [PMC free article] [PubMed] [Google Scholar]
- 47.Xu G., Kwon G., Marshall C. A., Lin T. A., Lawrence J. C., Jr, McDaniel M. L. 1998. Branched-chain amino acids are essential in the regulation of PHAS-I and p70 S6 kinase by pancreatic beta-cells. A possible role in protein translation and mitogenic signaling. J. Biol. Chem. 273: 28178–28184 [DOI] [PubMed] [Google Scholar]