

Abstract
Purpose
Regulatory T cells play a major role in tumor escape from immunosurveillance. T regulatory cells type 1 (Tr1), a subset of regulatory T cells present in the tumor and peripheral circulation of patients with head and neck squamous cell carcinoma (HNSCC), mediate immune suppression and might contribute to tumor progression.
Experimental Design
CD4+CD25− T cells were isolated from peripheral blood mononuclear cells (PBMC) or tumor-infiltrating lymphocytes (TIL) of 26 HNSCC patients and 10 normal controls. The Tr1 cell phenotype was determined before and after culture in the presence of interleukin (IL)-2, IL-10, and IL-15, each at 10 to 20 IU/mL. Suppression was measured in carboxyfluorescein diacetate succinimidyl ester – based proliferation assays with or without neutralizing anti-IL-10 or anti – transforming growth factor-β1 (TGF-β1) monoclonal antibodies in Transwell systems. ELISA was used to define the Tr1 cytokine profile.
Results
Tr1 cells originate from CD4+CD25− precursors present in TIL and PBMC of HNSCC patients. Cytokine-driven ex vivo expansion of Tr1 precursors yielded CD4+CD25−Foxp3lowCD132+IL-10+TGF-β1 + populations that mediated higher suppression than Tr1 cells of normal controls (P < 0.0001). Tr1 cells suppressed proliferation of autologous responders via IL-10 and TGF-β1 secretion. Expression of these cytokines was higher in TIL-derived than PBMC-derived Tr1 cells (P < 0.0001). The Tr1 cell frequency and suppressor function were significantly higher in patients presenting with advanced than early disease stages and in patients “cured” by oncologic therapies than in those with active disease.
Conclusions
In HNSCC, Tr1 cell generation is promoted at the tumor site. Tr1 cells use TGF-β and IL-10 to mediate suppression. They expand during disease progression and also following cancer therapy in patients with no evident disease.
Malignancies of the head and neck represent a group of diseases with a considerable socioeconomic and clinical impact (1). Among them, head and neck squamous cell carcinoma (HNSCC) account for ~40,000 new cases per year in the United States and 500,000 cases worldwide (2). Whereas early detection and treatment have improved in the last decades, 5-year survival remains below 50% primarily because of local recurrences or second primary tumors (3). Most HNSCC patients have immune defects, which might be responsible, at least in part, for tumor progression or the development of new primaries despite oncologic therapy. HNSCC have evolved a variety of strategies to evade immune detection and elimination as reviewed recently (4, 5). A mechanism of immune suppression that has recently been emphasized, largely because it appears to influence disease outcome, involves regulatory T cells (Treg).
Treg are a subset of CD4+ T lymphocytes capable of discriminating self-antigens from non-self-antigens and, in healthy individuals, responsible for maintaining tolerance by suppressing expansion of effector cells directed against self. In cancer-bearing hosts, most Treg are induced and expanded in response to tumor antigens that, with the exception of mutated epitopes, are aberrantly expressed self-antigens (6). Tolerance to tumor antigens is likely mediated through the same mechanisms that induce T-cell tolerance to normal self-antigens to avoid autoimmunity (7). Since the identification of suppressor cells over 35 years ago (8), at least four groups of putative Treg have been recognized in humans, including naturally occurring thymus-derived CD4+CD25high Treg cells (nTreg; ref. 9), antigen-induced and interleukin (IL)-10-dependent T regulatory cells type 1 (Tr1) cells (10), IL-4-dependent Th3 cells (11), and adaptively induced antigen-specific CD4+ Treg cells (12). Neither the precise relationship between these Treg subsets nor their origin or expansion in cancer is well understood. Tr1 cell precursors are naive CD4+CD25− T cells, which on encountering antigens presented by immature dendritic cells are induced to differentiate and expand in the microenvironment enriched in inhibitory cytokines, notably IL-10 (13). Although Tr1 cells are induced through IL-10-dependent mechanisms, their unique feature is secretion of immune-inhibitory cytokines, IL-10 and TGF-β, which mediate suppression by a contact-independent mechanism. First described in allergy (14) and autoimmune disorders (10), Tr1 cells are also thought to mediate suppression of antitumor immune responses in human cancer.
Accumulation of different Treg types at tumor sites and increased proportions of Treg in the peripheral circulation of cancer patients have been reported (15–20). We have recently described an increased frequency of CD4+CD25high nTreg in peripheral blood mononuclear cells (PBMC) and tumor-infiltrating lymphocytes (TIL) of HNSCC patients and the potential of these nTreg to facilitate tumor escape (18, 21–23). We have also shown that tumor-derived prostaglandin E2 controls the induction and expansion of Tr1 cells, which are responsible for suppression of antitumor immune responses (24). A recent study from Zhou and Levitsky reports that the concomitant presence of nTreg and Tr1 cells contributes to tumor-specific tolerance in mice (25). In aggregate, these results suggest that tumor antigens and cytokines in the tumor microenvironment play a key role in recruiting and expanding different types of Treg, which down-regulate anti-tumor immune responses and tip the balance of immune homeostasis toward tolerance.
In this report, we show that, in HNSCC patients, CD4+CD25− T cells present in the peripheral circulation and in the tumor “contain” precursors of Tr1 cells. Under favorable conditions, these precursors develop into functional Tr1 cells with a phenotype distinct from that of nTreg and capability to suppress proliferation of autologous activated T cells. The mechanisms used by Tr1 cells to mediate suppression are explored relative to their expansion in advanced disease.
Materials and Methods
Patients and blood samples
Twenty-six patients with diagnosis of HNSCC were included in this exploratory study. Tumor tissues were obtained from 10 patients with oral cavity tumors who underwent surgery for treatment of primary disease between September 2000 and March 2001. Samples of cryopreserved TIL were selected for this study if the number of available banked TIL exceeded 30 × 106 to allow for the isolation of CD4+CD25− T cells. PBMC were “randomly” obtained from 16 other patients with HNSCC as well as 10 age-matched healthy volunteers. All patients donating PBMC were seen at the Outpatient Otolaryngology Clinic at the University of Pittsburgh Medical Center between January 2006 and March 2007. Among them, 8 patients had active disease and 8 showed no evidence of disease at the time of phlebotomy; 11 patients were diagnosed with stage I/II disease and 5 with stage III/IV disease. All 16 patients who donated PBMC (11 with oral cavity tumors and 6 with larynx carcinoma) had undergone surgical resection of their tumors with a curative intent. The radiotherapy or radiochemotherapy, given to 7 patients, was terminated from 3 to 7 weeks before the time of phlebotomy obtained for this study. All subjects signed an informed consent approved by the Institutional Review Board of the University of Pittsburgh.
Isolation of TILs
TIL were isolated at the University of Pittsburgh Cancer Institute Tissue Procurement Facility according to a standard operating procedure as described previously (26). Briefly, after removal of fat, blood, or necrotic areas, primary solid human tumor tissue were washed in RPMI 1640, cut into 1 mm3 pieces in a Petri dish covered with RPMI 1640, washed, and, on transfer to flasks, dissociated using 0.05% (type IV) collagenase and 0.02% (type I) DNase (Sigma) in RPMI 1640 supplemented with 5% (v/v) FCS and antibiotics (Life Technologies/Invitrogen). Tissues were dissociated for up to 4 h using a magnetic stirrer at 37°C. The digest was then passed through 90 and 50 μm nylon mesh to remove clumps, and the filtrate was washed two to three times in medium followed by centrifugation at 350 × g for 10 min. To separate tumor cells from lymphocytes, the cell suspension was layered onto a discontinuous gradient of 75% over 100% Ficoll-Hypaque (GE Healthcare Bio-Sciences) in medium and centrifuged for 800 × g for 20 min at room temperature. Lymphocytes were collected from the interphase between 75% and 100% Ficoll-Hypaque and washed twice before cryopreservation.
Collection and processing of PBMC
Peripheral venous blood (20–30 mL) was drawn into heparinized tubes. The samples were hand-carried to the laboratory and immediately centrifuged on Ficoll-Hypaque gradients. PBMC were recovered, washed in AIM-V medium (Invitrogen), counted in the presence of a trypan blue dye to evaluate viability, and either immediately used for experiments or cryopreserved using a rate-control process (Cryo-Med). Cell vials were stored in liquid N2 vapors at −80°C.
Tr1 cell expansion from CD4+CD25− T cells
PBMC obtained from patients or normal controls and TIL were single-cell sorted for separation of CD4+CD25− T cells using a MoFlo high-speed cell sorter (Dako). CD4+CD25− T cells (106 per well) separated from PBMC of normal controls were cocultured in the IVA culture system described previously by us (27). Briefly, these cells (106 per well) were coincubated with irradiated HNSCC tumor cells (PCI-13, 105 cells) in the presence of autologous immature dendritic cells (105 per well) and cytokines IL-2 (10 IU/mL), IL-10 (20 IU/mL), and IL-15 (20 IU/mL) in AIM-V medium in duplicate wells of 24-well plates for 10 days. Cytokines, all purchased from Peprotech, were added to these cultures on days 0, 3 and 6. On day 9, culture medium was replaced by fresh medium containing anti-CD3 antibody (1 μg/mL; American Type Culture Collection). On day 10, lymphocytes and culture medium were harvested for assays.
Multicolor flow cytometry
Freshly isolated or cultured lymphocytes were phenotyped as described previously (27). Briefly, cell surface molecules were detected using anti-CD3-ECD, anti-CD4-PC5, anti-CD25-FITC, anti-CD25-PE, anti-CD122-FITC, anti-CD132-PE, and anti-CD46-FITC antibodies purchased from Beckman Coulter, except for anti-CD46 antibody (clone E4.3), which was purchased from BD PharMingen. Isotype controls, IgG1, IgG2a, and IgG2b, were included in all experiments. For intracytoplasmic staining, cells were saponized, washed in saponin-containing buffer, and stained with the following antibodies: anti-CD132-PE (Beckman Coulter), anti-IL-10-PE or its isotype control PE rat IgG2a,κ (BD PharMingen), anti-FoxP3-FITC and anti-IL-4-FITC (eBioscience), and anti-TGF-β1-FITC (clone TB21; Anti-genix America). Appropriate isotype controls were used in all experiments. Multicolor flow cytometry was done using a FACScan flow cytometer (Beckman Coulter) equipped with Expo32 software (Beck-man Coulter). The acquisition and analysis gates were restricted to the lymphocyte gate as determined by their characteristic forward and side scatter properties. Routinely, 105 cells were acquired for analysis. Further, analysis gates were restricted to the CD3+CD4+ T-cell subset. The flow data were analyzed using Coulter EXPO 32vl.2 analysis software.
Suppression assays
Responder CD4+CD25− T cells were autologous to Treg (suppressor cells). Responder cells were stained with 1.5 μmol/L carboxyfluorescein diacetate succinimidyl ester (CFSE; Molecular Probes/Invitrogen), stimulated with plate-bound anti-CD3 monoclonal antibody (mAb; 1 μg/mL) and soluble anti-CD28 mAb (1 μg/mL), and cocultured with suppressor cells in a complete AIM-V medium containing IL-2 (150 IU/mL) in 96-well plates (5 × 10⁵ per well). Suppressor cells were freshly isolated CD4+CD25−(Tr1 precursors) or cultured Tr1 cells, which were added to responder cells at various suppressor cell/responder cell ratios (1:1, 1:5, 1:10, and 1:20). Cocultures were incubated at 37°C in an atmosphere of 5% CO2 in air for 5 days. Pre-titred neutralizing mAb to IL-10 and/or TGF-β1 (R&D) or isotype control IgG were added to some cocultures at the final concentrations of 2 or 20 ng/mL, respectively. In additional CFSE assays, responder cells were plated at 106 per well in wells of 24-well plates (Corning), coated with anti-CD3 mAb (1 μg/mL), and equipped with 6.5 mm Transwell inserts (pore size, 0.4 μm). Suppressor and responder cells were placed in the Transwell insert plates at 1:1 ratio. After cell harvest, suppression of proliferation of CFSE-labeled responder cells was analyzed. Data obtained by flow cytometry were analyzed using ModFit LT for Win32 software provided by Verity Software House.
Cytokine production assay
For the last 24, 48, and 72 h of culture, supernatants were replaced by fresh complete medium containing anti-CD3 mAb (1 μg/mL) but no exogenous cytokines. Supernatants were collected and stored frozen until ELISA (R&D) was done to determine levels of IL-4, IL-10, IL-12, IL-27, and IFN-γ. Levels of TGF-β1 in acidified supernatants were also measured by ELISA (R&D). The assay was done according to manufacturers’ instructions.
Controls used for cytokine production by normal control cells included immature dendritic cells coincubated in the presence of irradiated HNSCC cells (PCI-13 and PCI-30) in parallel cultures to those containing Tr1 cells, immature dendritic cells, and irradiated tumor cells.
Immunofluorescence of tumor tissues
Tissue samples were embedded in OCT, and 5 μm frozen sections were cut in a cryostat, dried, fixed for 10 min in cold acetone and ethanol (1:1), and again dried in air. The following monoclonal anti-human antibodies were used for staining: CD4/FITC (diluted 1:100 in PBS), mouse CD25/PE (1:50), rat CD132/PE (1:50; BD PharMingen), and rat Foxp3 (1:100; eBioscience). In addition, polyclonal rabbit anti-human IL-10 antibody (1:50), rabbit anti-human CD46 antibody (1:100), and polyclonal goat anti-human TGF-β1 antibody (1:50; all from Santa Cruz Biotechnology) were used. As secondary antibodies for IL-10, TGF-β1, and Foxp3 detection, Cy5-labeled donkey anti-rabbit, anti-goat, and anti-rat (all from Jackson ImmunoResearch) antibodies were used at 1:500 dilution. To eliminate nonspecific binding of secondary antibodies, tissue sections were initially incubated with 10% normal donkey serum for 1 h. Sections were incubated with antibodies for 1 h at room temperature in a moist chamber. Next, slides were washed in PBS and then incubated with the secondary antibodies under the same conditions and in the dark. Primary antibodies were omitted in all negative controls. Sections were incubated in a medium with 4′,6-diamidino-2-phenylindole (Vector Laboratories) to trace cell nuclei. Slides were evaluated in the Olympus Provis (Olympus) fluorescence microscope under ×400 magnification. For digital image analysis, the software Adobe Photoshop 6.0 version was used.
Statistical analysis
Data were summarized by descriptive statistics (mean and SD for continuous variables; frequency and percentage for categorical variables). Kruskal-Wallis tests were used to compare percentages of positive cells and mean fluorescence intensity (MFI) values across groups (PBMC versus TIL versus normal controls) and disease status (active disease versus no evidence of disease; ref. 28). Wilcoxon rank-sum test was used to compare percentages of positive cells and MFI values across disease stages (IUCC 1/2 versus IUCC 3/4). The percentages of positive cells and MFI were either log or square-root transformed to satisfy the normality assumption. Three-way ANOVA was used to evaluate the effect of group (PBMC versus TIL) on percent positive cells or MFI values after adjusting for the effect of disease status and disease stage.
Results
Characteristics of Tr1 precursor populations in TIL or PBMC
Lymphocyte populations freshly obtained from PBMC or the tumor in HNSCC patients and from PBMC of normal controls were first evaluated by flow cytometry, gating on CD3+CD4+ cells. Up to 87% of CD3+CD4+ cells isolated from TIL were CD25− (only 13 ± 3% were CD25+), and those isolated from PBMC were nearly all CD25−. The CD4+ T-cell fractions isolated from TIL showed a phenotypic profile that was distinct from that of lymphocytes isolated from PBMC of HNSCC patients (Fig. 1A) or of normal controls (data not shown). In TIL, up to 70% of CD4+CD25− cells were IL-4+ and only ~20% expressed IL-10 and/or TGF-β1 (Fig. 1B). CD122 (IL-2Rβ) was not expressed, and ~20% of TIL-derived CD4+CD25− cells expressed CD132 (P < 0.001). The PBMC-derived precursor cells expressed almost no IL-10 or TGF-β1, and only up to 15% were IL-4+ (Fig. 1A and B). Mean levels of expression (MFI) of TGF-β1 were significantly higher (P < 0.001) in TIL than in PBMC, whereas MFI of IL-10 was not (see below). Foxp3 and CTLA-4, markers used to characterize Treg, were detected on ~20% of CD4+CD25− cells isolated from TIL or PBMC (Fig. 1A).
Fig. 1.

Phenotypic analysis of Tr1 cells obtained from PBMC or TIL of HNSCC patients. A, phenotypic characteristics of single-cell sorted CD4+CD25− lymphocytes obtained from circulating PMBC (
 ) or from tumor tissue of HNSCC patients (■). B, flow cytometry dot blots showing relative expression of selected markers on sorted fresh PBMC (top row) or tumor-derived cells (TIL; bottom row). Data are representative for CD4+CD25− cells sorted from lymphocytes of different HNSCC patients. C, phenotypic analysis of single-cell sorted CD4+CD25− T cells obtained from fresh PBMC versus TIL from HNSCC patients and cultured in the presence of “Tr1 cytokines” for 10 d. A and C, are mean ± SD percent positive cells from experiments done with cells of 26 different HNSCC patients. *, P < 0.0006; **, P < 0.0001. Multicolor flow cytometry was done with gates set on CD3+CD4+ T cells. D, box plots show differences in MFI in IL-10 or TGF-β1 expression in PBMC versus TIL. E, representative flow cytometry dot blots showing relative expression of selected markers on CD4+CD25− lymphocytes after culture in the presence of “Tr1 cytokines” for 10 d.
Characteristics of Tr1 cell populations expanded from TIL or PBMC
CD4+CD25− cells isolated from TIL and PBMC were cultured in the presence of IL-2, IL-10, and IL-15, defined previously as “Tr1 cytokines,” for 10 days (27). Importantly, only cytokines and no tumor or dendritic cells were required to expand CD4+ T cells of patients with HNSCC. The phenotype of T cells outgrowing in these cultures is shown in Fig. 1C. Tr1 cells derived from CD4+CD25− PBMC of HNSCC patients were CD122+ (up to 85%), CD132+ (up to 60%), and remained negative for CD25 expression. Foxp3 and CTLA-4 were expressed on various proportions of Tr1 cells derived from PBMC (up to 55% and 45%, respectively; Fig. 1C). CD46 was expressed on ~50% to 60% of Tr1 cells (data not shown), and no significant correlation was observed between CD46 and CD132 expression on Tr1 cells. In contrast, TIL-derived cells were CD4+CD25−, IL-4−, and largely Foxp3− as well as CTLA-4−. MFI of IL-10 and TGF-β1 in Tr1 cells derived from TIL were significantly higher (P < 0.0001) than those in Tr1 cells derived form PBMC (Fig. 1D). As shown in Fig. 1E, TIL were highly enriched in cells expressing TGF-β1, IL-10, and CD132 (IL-2Rγ). This phenotype was consistent with that defined for Tr1 cells (27). Thus, Tr1 cells originating from TIL were phenotypically distinguishable from those derived from PBMC of HNSCC patients after 10 days of culture in the presence of the “Tr1 cytokines.”
Suppression mediated by Tr1 cells or their precursors within the CD4+CD25− subset
To evaluate the ability of Tr1 precursors or ex vivo differentiated Tr1 cells to suppress anti-CD3 antibody-induced proliferation of autologous CD4+CD25− responder cells, CFSE assays were done. Responder cells were peripheral autologous CD4+CD25− T cells isolated from TIL or PBMC of HNSCC patients or from PBMC of normal controls. These responder cells were labeled with CFSE, stimulated with anti-CD3 and anti-CD28 mAb, and cocultured for 5 days with suppressor cells. As shown in Fig. 2A and B, freshly isolated suppressor cells from the peripheral blood of normal controls or HNSCC patients showed low suppressor activity (6.5 ± 3% and 8.2 ± 3%, respectively). However, freshly isolated suppressor cells from TIL significantly suppressed proliferation of autologous CD4+ responder cells with a mean suppression level of 43.9 ± 15% (P < 0.001). On the other hand, ex vivo differentiated Tr1 cells showed much stronger suppression than their precursor cells in freshly isolated PBMC or TIL as illustrated in Fig. 2A and B.
Fig. 2.

Functional analysis of Tr1 cells obtained from PBMC or TIL of HNSCC patients. A, histograms generated using the ModFit software show proliferation of CFSE-labeled responder cells stimulated with anti-CD3/CD28 and cocultured with autologous suppressor cells for 5 d as described in Materials and Methods. Responder cells are CD4+CD25− freshly separated T cells obtained from PBMC of normal controls or HNSCC patients or from TIL. Suppressor cells are autologous CD4+CD25− freshly separated T cells from PBMC of normal controls or from TIL (top row). Bottom row, responder cells are CD4+CD25− freshly separated T cells, whereas suppressor cells are autologous CD4+CD25− cells after culture in the presence of “Tr1 cytokines” for 10 d to generate Tr1 cells. Suppressor cells were added to responder cells at the start of the cocultures at the1:1 ratio. Percent inhibition of proliferation relative to proliferation of responder cells alone is indicated in every panel. The results are from one representative experiment out of10 done with cells obtained from 10 different normal controls and 26 HNSCC patients. B, percentages of suppression of proliferation in CFSE-labeled CD4+CD25− responder cells coincubated at the 1:1 ratio with suppressor cells derived as described in A from autologous fresh PBMC (
) or TIL (■). C, titration of Tr1 cells (suppressor cells) derived from PBMC or TIL into CFSE-labeled autologous proliferating responder cell cultures. Suppression by Tr1 cells expanded from TIL (■) or from PBMC (◆) of proliferating responder cells is shown at various ratios. D, percentages of suppression of proliferation in single-cell sorted CFSE-labeled CD4+CD25− responder cells by autologous suppressor cells cultured with “Tr1 cytokines” for 10 d. Suppressor cell/responder cell ratio was 1:1. Mean ± SD percent suppression for cocultures done with cells of 10 normal controls and 26 HNSCC patients.
Freshly isolated or ex vivo differentiated Tr1 cells titrated into responder cells at various ratios gave linear responses, with suppression considerably higher in TIL-derived suppressor cells than PBMC-derived suppressor cells (P < 0.001) as illustrated in Fig. 2C. Whereas proliferation of autologous responder cells was suppressed in all cultures in the presence of ex vivo differentiated Tr1 cells, TIL-derived Tr1 cells nearly completely inhibited expansion of responder cells (Fig. 2D). Tr1 cells generated from PBMC of normal controls showed a mean suppressive activity of 46.2 ± 9%, whereas those expanded from PBMC of HNSCC patients suppressed at the level of 62.9 ± 15% (mean ± SD; P < 0.001).
Suppression mediated by Tr1 cells is cytokine dependent but cell contact independent
A characteristic feature of differentiated Tr1 cells is the ability to produce IL-10 and TGF-β, the cytokines that likely mediate suppressor activity of these cells. To test this assumption, we inhibited IL-10 and TGF-β secretion by ex vivo differentiated Tr1 cells using the cytokine-specific antibodies. These experiments were done in the presence or absence of a Transwell insert and showed that proliferation of responder cells was inhibited (P < 0.0001) whether these antibodies were used singly or combined (Fig. 3A). Furthermore, the suppressive activity of Tr1 cells was not attenuated when Transwell inserts were used (Fig. 3B). Similar results were obtained with PBMC-derived Tr1 cells (data not shown).
Fig. 3.
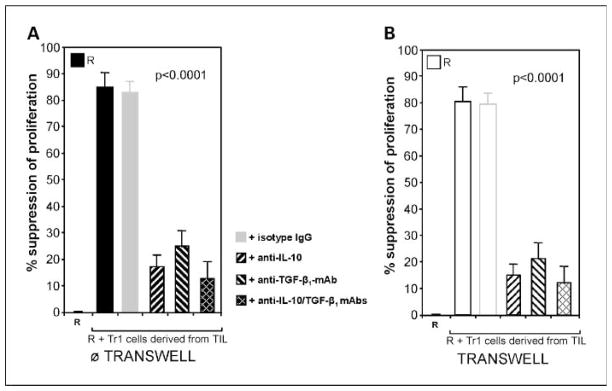
Mechanism of suppression mediated by Tr1 cells. A, responder cells are (CFSE-labeled autologous CD4+CD25− T cells) stimulated with anti-CD3/CD28 mAb and cocultured for 5 d as described in Materials and Methods. Tr1 cells (suppressor cells) are autologous cultured CD4+CD25− cells derived from TIL of HNSCC patients titrated into responder cells at the 1:1 ratio. Suppressor cells mediated strong suppression in the cocultures. Addition of anti-IL-10 and/or anti-TGF-β1, but not isotype control IgG, reduced the level of suppression (P < 0.001). B, suppression of responder cells mediated by Tr1 cells was not decreased when the same cells were cocultured in presence of Transwell inserts. Addition of anti-IL-10 and anti-TGF-β1 mAb in the presence of Transwell inserts reduced levels of suppression (P < 0.0001). A and B, mean ± SD percent suppression of proliferation of CFSE-labeled autologous responder cells observed in experiments done with cells of 10 different donors.
Presence of Tr1 cells and Tr1 precursors at the tumor site
Having identified the phenotypic and functional characteristics of Tr1 cells isolated from TIL, we were able to assess their presence and distribution in the tumor tissue using multicolor immunofluorescence and confocal microscopy. Tumor tissue sections were stained with labeled mAb selected to distinguish Tr1 cells from nTreg. As shown in Fig. 4A, not only CD4+CD25+Foxp3+ (nTreg), as reported previously (23), but also CD4+CD25−Foxp3low (Tr1) T cells infiltrate the tumor. Figure 4B shows that Tr1 cells present in the tumor are CD4+CD25−CD132+IL-10+ and appear to be clustered close to tumor cells. This in situ phenotype of Tr1 cells corresponds to the flow cytometry data reported above (Fig. 1). Similar distribution of CD4+CD25−CD132+TGF- was also observed in the tumor (data not shown). However, Tr1 cells were not the only cells at the tumor site that expressed IL-10. In fact, all HNSCC examined to date expressed IL-10 in situ (data not shown) as shown by immunohistochemistry. This finding supports the conclusion that the tumor microenvironment creates the milieu that promotes induction of Tr1 cells. We also studied expression of OX40L (a suppressor of Tr1 induction) in the tumor (29) by immunohistochemistry and found it to be associated with CD11c+ cells. In addition, we examined CD46 expression in the tumor. This receptor for complement components C3b and C4b was ubiquitously present on all tumor cells as well as infiltrating leukocytes, further suggesting that, in the tumor, CD46-mediated signaling could be involved in Tr1 induction as suggested previously (30).
Fig. 4.

Tr1 and Tr1 precursors in the tumor. Tissue sections of a HNSCC were stained as described in Materials and Methods and examined using immunofluorescence and confocal microscopy. A, a representative tumor section was stained with (a) anti-CD4-FITC (green), (b) anti-CD25-PE (red), and (c) anti-Foxp3-Cy5 (pseudocolored blue). d, the overlap shows the presence of CD4+CD25−Foxp3low Tr1 cells (arrows), CD4+CD25− Foxp3− Tr1 precursor cells, and CD4+CD25+Foxp3+ nTreg. B, a representative tumor section stained with (a) anti-CD4-FITC (green) and anti-CD132-PE (red), with a cluster of CD4+CD132+ T cells (orange); (b) anti-IL-10-Cy5 (pseudocolored blue) and 4′,6-diamidino-2-phenylindole (white) to show cell nuclei; and (c) an overlay shows that the same cluster of cells is CD4+CD132+ and IL-10+. Magnification, ×400.
Supernatants of Tr1 cells
Supernatants of expanded Tr1 cells were collected on day 10 of culture after additional 24 hours in fresh medium containing only anti-CD3 mAb and no exogenous cytokines. In kinetics-type experiments, we showed that the period of 24 hours was optimal for supernatant harvest to evaluate cytokine production. IL-10 and TGF-β were detected in all Tr1 cell cultures but not in control cultures. Supernatants from cultures containing TIL-derived Tr1 cells contained the highest levels of IL-10 and TGF-β (1,480 ± 25 and 3,720 ± 84 pg/mL, respectively), whereas levels of these cytokines were 1-fold lower (P < 0.01) in cultures of PBMC-derived Tr1 in HNSCC patients and 4-fold lower in normal controls (P < 0.001; Fig. 5). For normal control cocultures (n = 11) containing immature dendritic cells and irradiated tumor cells but no Tr1 cells (controls), IFN-γ production was 84 ± 9 pg/mL and IL-10 production was 329 ± 23 pg/mL. These levels of IL-10 production were significantly lower than those for Tr1-containing cultures (P < 0.001). All tested supernatants were negative or contained minimal levels of IL-4, IL12, IFN-γ, and NO.
Fig. 5.

Levels of Tr1-associated cytokines in supernatants of lymphocyte cultures. Supernatants from different Tr1 cocultures were collected on day 10 as described in Materials and Methods. Control cultures included activated T cells cultured alone and immature dendritic cells cocultured with irradiated tumor cells (data not shown). A, IL-10 was not detectable in control T-cell or immature dendritic cell cultures, whereas all Tr1 cell cultures were positive for IL-10. B, TGF-β1 was undetectable in acidified supernatants from control cultures, whereas cultures with Tr1 cells contained TGF-β1. Mean ± SD measured in supernatants of different cocultures done with cells obtained from 36 different donors.
Association of Tr1 cell numbers with disease stage and activity
Patients with HNSCC who donated PBMC for this study were stratified based on the disease stage (International Union Against Cancer I/II versus III/IV) determined at the time of surgery. Patients who presented with advanced-stage disease had significantly higher proportions of CD4+ cells negative for CD25 but positive for IL-10 and TGF-β1 in the peripheral circulation compared with patients with early-stage disease (Fig. 6A). Also, the Tr1 cells isolated from blood of patients who had advanced-stage disease mediated significantly higher suppressor activity than Tr1 cells from patients with early-stage disease (Fig. 6A). These associations were observed with freshly isolated Tr1 precursors as well as expanded Tr1 cells isolated from peripheral blood and were highly significant as shown in Fig. 6.
Fig. 6.

Correlations between Tr1 cell frequency or function and disease stage. A, IL-10, TGF-β1, or CD132 expression and suppressor function of freshly isolated CD4+CD25− T cells or Tr1 cells expanded in culture were measured. T cells were obtained from PBMC of HNSCC patients and were analyzed relative to the early disease stage (International Union Against Cancer I/II) versus late disease stage (International Union Against Cancer III/IV) at the time of surgery. B, IL-10, TGF-β1, and suppressor function of Tr1 cells obtained from PBMC of HNSCC patients were analyzed relative to disease activity (active disease versus no evident disease) defined at the time of phlebotomy. The data are displayed as box-whisker plots that present mean, spread, and distribution of the data set. Suppressor function of Tr1 was measured using responder T cells in CFSE assays as described in Materials and Methods. A and B, mean ± SD percent positive cells or suppression from experiments done with PBMC of 16 different HNSCC patients. Wilcoxon rank-sum tests were used for comparisons. Significance level of 0.0028 was used to adjust for multiple comparisons.
The patients were also stratified into those with active disease (n = 8) and those with no evident disease (n = 8) at the time of phlebotomy for this study. All 8 patients with active disease donated blood for this study before subsequent therapy and none was receiving oncologic therapy. However, 3 of 8 patients had recurrent disease and had surgery 3 to 5 years before the current blood draws. All 8 patients with no evident disease had undergone surgery with curative intent and 7 had subsequent radiotherapy and/or chemotherapy, which were terminated 3 to 7 weeks before phlebotomy. As a group, the patients with no evident disease after oncologic therapy had higher percentages of CD4+CD25− cells expressing TGF-β1 (P < 0.001) in the peripheral circulation than patients with active disease (Fig. 6B), although the percentage of CD4+CD25− cells expressing IL-10 was not significantly different in these two cohorts. Furthermore, suppression mediated by CD4+CD25− cells isolated from PBMC of patients with no evident disease was significantly greater (P = 0.0003) than that mediated by cells obtained from patients with active disease (Fig. 6B). A similar analysis of Tr1 cells expanded ex vivo from PBMC of HNSCC with no evident disease versus active disease showed comparable results, with higher Tr1 cell numbers and function in the cohort with no evident disease (data not shown). In this statistical analysis, disease activity segregated as an independent variable from disease stage.
In aggregate, our data suggest that Tr1 cells are expanded and highly suppressive in the peripheral circulation of HNSCC patients with advanced disease. Unexpectedly, Tr1 cells were also expanded in the periphery of HNSCC patients with no evident disease, and the frequency as well as function of Tr1 cells remained elevated for prolonged time periods (weeks to months) after termination of oncologic therapy. This finding is similar to that reported by us earlier for nTreg in patients with HNSCC (31).
Discussion
Recently, evidence has accumulated indicating that tumors have the ability to shape their microenvironment and use immunosuppressive mechanisms to counteract antitumor immune responses (32). Although these mechanisms vary, accumulations of Treg in the tumor microenvironment are thought to contribute, at least in part, to tumor escape from the immune system (33). The presence of Treg at tumor sites and their frequency and suppressor functions have been described previously by us and others (15, 16, 23). Further, preliminary evidence indicates that the presence and the chemokine/cytokine profile of Treg accumulating in ovarian carcinoma and other human solid tumors are associated with shorter patient survival (34). For this reason, attention has been focused on defining phenotypic and functional properties of Treg present in the tumor as well as peripheral circulation of patients with cancer.
In a previous study, we have reported that the nTreg subset in patients with HNSCC comprises CD4+CD25+Foxp3+ cells with a phenotype that is distinct from that of the corresponding cells in the peripheral circulation (23). These TIL-Treg expressed IL-10 and TGF-β1, were GITR+, and mediated potent suppression even at very low suppressor cell/responder cell ratios. Here, we show that, in addition to CD4+CD25+Foxp3+ Treg, TIL obtained from HNSCC contain another subset of Treg, which are CD4+CD25−Foxp3low/neg. These Treg have phenotypic characteristics consistent with those defined previously by us for Tr1 cells in the in vitro model system: CD4+CD25−Foxp3low/negCD132highIL-10+TGF- (27).
It has been well documented that tumors produce and release a variety of antigens, which may be processed by antigen-processing cells and cross-presented for recognition by immune T cells (35). Because the majority of these tumor-associated antigens are “self,” they tend to induce tolerance rather than immunity. Tr1 cells inducible from CD4+CD25− precursors might be responsible, at least in part, for mediating tolerance to self. Therefore, their enrichment in the tumor microenvironment is not unexpected, although their cellular origin, recruitment to the tumor, and the process of mechanisms responsible for suppression are unclear. Our results suggest that Tr1 cells might originate from precursors present within the CD4+CD25− cell subset in the tumor microenvironment.
The tumor microenvironment is rich in Th2 cytokines, IL-10, TGF-β1, and IL-4. Our preliminary experiments indicate that IL-10 is produced by HNSCC in situ. Also, tumor-associated normal tissue cells and/or tumor-infiltrating immune cells, including immature dendritic cells and Treg, might secrete immunosuppressive cytokines (36). Such a microenvironment favors the development of Tr1 cells from precursor cells present within the CD4+CD25− subset. Our data suggest that Tr1 cells require previous priming and activation by the antigen to differentiate into functional suppressor cells in the presence of Tr1 cytokines. Engagement by T-cell receptor of tumor antigens abundant in the tumor in the presence of these cytokines as well as prostaglandin E2, a byproduct of the COX-2 pathway in HNSCC (24), likely induces differentiation of the precursor cells into Tr1 cells. Other factors, such as OX40L (29) or ICOS (37), could also influence differentiation of CD4+CD25− precursors into Tr1 cells in the tumor microenvironment. The in situ conditions determine how rapidly the precursor cells differentiate into fully functional Tr1 cells. It has been reported that induction of Treg can result from cross-linking of CD46 on activated T cells with CD46 ligands (C3b- or C4b-opsonized immune complexes; ref. 30). Such CD46-induced Treg were reported to proliferate strongly and suppress the activation of responder T cells via IL-10 secretion and granzyme B–mediated lysis (38). In our hands, OKT3-activated Tr1 cells as well as CD4+CD25− T cells were shown to express CD46. Furthermore, we observed granzyme B and perforin expression in expanded Tr1 cells.5 In aggregate, these data suggest that, in the tumor microenvironment, Tr1 induction may be favored. An excess of CD46 and IL-10 (Tr1 inducers) and the paucity of OX40L (a suppressor of Tr1 induction) found in HNSCC supports this conclusion. The observation that a considerable fraction of TIL-derived Tr1 cells express TGF-β1 and IL-10 in situ further supports the role for these cytokines in the Tr1 differentiation process.
To mimic the in vivo microenvironment necessary for the induction of Tr1 cells, we previously established a coculture system in which CD4+CD25− cells obtained from PBMC of normal controls were coincubated with irradiated tumor cells as a source of tumor-associated antigens, immature dendritic cells serving as antigen-processing cells, and “Tr1 cytokines” (IL-2, IL-10, and IL-15; ref. 27). This in vitro system allowed us to generate functionally active Tr1 cells from the naive precursors in numbers sufficient for a complete analysis of their attributes. The phenotype and function of T cells expanded in this system were consistent with those described previously for Tr1 cells (13), although levels of IL-10 production were lower than those reported in Tr1 cells by other groups (39). This could reflect differences in the nature of Tr1, which in our experiments are induced by the tumor or in culture methods used for ex vivo Tr1 induction. TIL or PBMC obtained from HNSCC patients expanded rapidly in this coculture system containing “Tr1 cytokines” presumably because freshly isolated CD4+CD25− cells were in vivo primed. Tr1 cells that expanded were phenotypically and functionally comparable with Tr1 cells present in the tumor or fresh PBMC in the circulation of cancer patients. As Tr1 cells represent a minor component of CD3+CD4+ population, the possibility for expanding them ex vivo using “Tr1 cytokines” is an obvious advantage.
Interestingly, IL-2 and IL-15 are the key cytokines for Tr1 cell induction and expansion, possibly because Tr1 precursors express the β and γ receptor chains, which are shared by receptors for IL-2 and IL-15. The prominent display of CD132 (IL-2Rγ) on functional Tr1 is consistent with a requirement for relatively high doses of exogenous IL-2 in support of suppressor functions. In mice, IL-2 was shown to control the balance between IL-17+ T cells and Treg in the tumor microenvironment (40). Distinctive expression of the IL-2Rγ chain (CD132) by TIL-derived versus PBMC-derived Tr1 cells (high versus low, respectively) in HNSCC patients might reflect different requirements of these subpopulations for IL-2, which regulates their suppressive functions.
To date, contributions of Tr1 cells to down-regulation of immune responses in cancer patients have not been defined. To begin to explore the potential clinical significance of the observed Tr1 enrichment in patients with HNSCC, we examined associations between their frequency and suppressor activity versus disease activity at the time of phlebotomy and the disease stage (International Union Against Cancer I/II versus III/IV) determined at the time of surgery. Although the patient cohorts used in our cross-sectional analyses were small, we found that Tr1 cells expressing functionally Treg markers, IL-10, TGF-β, and CD132, were expanded in PBMC of HNSCC patients with advanced disease stages. Thus, cancer progression appears to be accompanied by differentiation and expansion of Tr1 cells in the periphery, which is not attenuated by therapy. In fact, it could be an effect of oncologic therapy. Surprisingly, elevated Tr1 frequency and activity seem to persist long after therapy is terminated. Similar results were obtained with nTreg in patients no evident disease (31). These findings imply that oncologic therapy has long-term effects on Treg survival and function. As this was not a prospectively designed study and the patient cohorts were small, the presence of significant correlations between Tr1 expansion and disease stage or activity was surprising. Clearly, serial sampling of individual patients enrolled in a prospective study will be necessary to confirm these intriguing preliminary observations. If oncologic therapy does not decrease but rather expands Tr1 cells and augments their function, then it may be critical to serially monitor the frequency and activity of Treg in cancer patients treated with oncologic therapies to ascertain the role of these cells in disease progression, recurrence, and prognosis. Additional preliminary data in our laboratory indicate that (a) Treg are resistant to chemotherapeutic drugs in vitro and (b) Treg expand in the presence of cisplatin.6 Therefore, it is reasonable to speculate that oncologic therapies, which themselves induce inflammatory responses, also recruit, activate, and expand Treg, which are expected to control excessive inflammatory responses (41, 42).
In this study, we report for the first time that Tr1 cells derived from TIL in HNSCC patients or those present in the tumor expressed CD132 rather than CD25 and produced high levels of IL-10 and TGF-β1. These cytokines were shown to be responsible for Tr1-mediated suppression of responder cell proliferation. Although the tumor microenvironment enriched in tumor antigens and immature dendritic cells might be an ideal milieu for inducing generation of tumor antigen-specific Tr1 cells from inactive precursor cells, it remains unclear that Tr1 cells regulate responses of tumor antigen-specific T cells. The mechanism of suppression involving cytokines implies that a variety of immune or nonimmune cell types expressing receptors for IL-10 or TGF-β1 are likely to be responder cells. Our data are consistent with the hypothesis that, in patients with cancer, Tr1 cells tolerate receptor-expressing immune cells but also regulate numbers and activity of many other cell types present in the tumor. Therefore, understanding of phenotypic, functional, and molecular characteristics of Tr1 cells is crucially important for the development of novel therapies for cancer, which are dependent on the removal or inhibition of IL-10-and TGF-producing Tr1 cells (43). In this respect, nearly complete abrogation of their suppressor activity by antibodies to IL-10 or TGF-β1 suggests that antibody-mediated inhibition of the immunosuppressive cytokines might be effective in modulating Tr1 activity in vivo.
Acknowledgments
We thank the University of Pittsburgh Cancer Institute Flow Cytometry Facility and the Center for Biologic Imaging at the University of Pittsburgh for technical assistance.
Grant support: NIH grants RO-1 DE13918, PO-1DE12321, and PO-1CA109688 (T.L. Whiteside) and Philip Morris USA, Inc. and Philip Morris International (S. Lang).
Footnotes
L. Strauss, C. Bergmann, T.L. Whiteside, unpublished data.
L. Strauss, unreported data.
Disclosure of Potential Conflicts of Interest
No potential conflicts of interest were disclosed.
References
- 1.Lang S, Wollenberg B, Dellian M, et al. Clinical and epidemiological data of patients with malignomas of the head and neck. Laryngorhinootologie. 2002;81:499–508. doi: 10.1055/s-2002-33285. [DOI] [PubMed] [Google Scholar]
- 2.Forastiere A, Koch W, Trotti A, Sidransky D. Head and neck cancer. N Engl J Med. 2001;345:1890–900. doi: 10.1056/NEJMra001375. [DOI] [PubMed] [Google Scholar]
- 3.Chin D, Boyle GM, Porceddu S, Theile DR, Parsons PG, Coman WB. Head and neck cancer: past, present and future. Expert Rev Anticancer Ther. 2006;6:1111–8. doi: 10.1586/14737140.6.7.1111. [DOI] [PubMed] [Google Scholar]
- 4.Young MR. Protective mechanisms of head and neck squamous cell carcinomas from immune assault. Head Neck. 2006;28:462–70. doi: 10.1002/hed.20331. [DOI] [PubMed] [Google Scholar]
- 5.Whiteside TL. Immunobiology of head and neck cancer. Cancer Metastasis Rev. 2005;24:95–105. doi: 10.1007/s10555-005-5050-6. [DOI] [PubMed] [Google Scholar]
- 6.Kawakami Y, Rosenberg SA. Human tumor antigens recognized by T-cells. Immunol Res. 1997;16:313–39. doi: 10.1007/BF02786397. [DOI] [PubMed] [Google Scholar]
- 7.Adler AJ. Mechanisms of T cell tolerance and suppression in cancer mediated by tumor-associated antigens and hormones. Curr Cancer Drug Targets. 2007;7:3–14. doi: 10.2174/156800907780006931. [DOI] [PubMed] [Google Scholar]
- 8.Gershon RK, Kondo K. Infectious immunological tolerance. Immunology. 1971;21:903–14. [PMC free article] [PubMed] [Google Scholar]
- 9.Sakaguchi S, Sakaguchi N, Asano M, Itoh M, Toda M. Immunologic self-tolerance maintained by activated T cells expressing IL-2 receptor α-chains (CD25). Breakdown of a single mechanism of self-tolerance causes various autoimmune diseases. J Immunol. 1995;155:1151–64. [PubMed] [Google Scholar]
- 10.Groux H, O’Garra A, Bigler M, et al. A CD4+ T-cell subset inhibits antigen-specific T-cell responses and prevents colitis. Nature. 1997;389:737–42. doi: 10.1038/39614. [DOI] [PubMed] [Google Scholar]
- 11.Weiner HL. Induction and mechanism of action of transforming growth factor-β-secreting Th3 regulatory cells. Immunol Rev. 2001;182:207–14. doi: 10.1034/j.1600-065x.2001.1820117.x. [DOI] [PubMed] [Google Scholar]
- 12.Wang HY, Lee DA, Peng G, et al. Tumor-specific human CD4+ regulatory T cells and their ligands: implications for immunotherapy. Immunity. 2004;20:107–18. doi: 10.1016/s1074-7613(03)00359-5. [DOI] [PubMed] [Google Scholar]
- 13.Roncarolo MG, Gregori S, Battaglia M, Bacchetta R, Fleischhauer K, Levings MK. Interleukin-10-secreting type 1 regulatory T cells in rodents and humans. Immunol Rev. 2006;212:28–50. doi: 10.1111/j.0105-2896.2006.00420.x. [DOI] [PubMed] [Google Scholar]
- 14.Saloga J, Bellinghausen I, Knop J. Do Tr1 cells play a role in immunotherapy? Int Arch Allergy Immunol. 1999;118:210–11. doi: 10.1159/000024071. [DOI] [PubMed] [Google Scholar]
- 15.Badoual C, Hans S, Rodriguez J, et al. Prognostic value of tumor-infiltrating CD4+ T-cell subpopulations in head and neck cancers. Clin Cancer Res. 2006;12:465–72. doi: 10.1158/1078-0432.CCR-05-1886. [DOI] [PubMed] [Google Scholar]
- 16.Ichihara F, Kono K, Takahashi A, Kawaida H, Sugai H, Fujii H. Increased populations of regulatory T cells in peripheral blood and tumor-infiltrating lymphocytes in patients with gastric and esophageal cancers. Clin Cancer Res. 2003;9:4404–8. [PubMed] [Google Scholar]
- 17.Hiraoka N, Onozato K, Kosuge T, Hirohashi S. Prevalence of FOXP3+ regulatory T cells increases during the progression of pancreatic ductal adenocarcinoma and its premalignant lesions. Clin Cancer Res. 2006;12:5423–34. doi: 10.1158/1078-0432.CCR-06-0369. [DOI] [PubMed] [Google Scholar]
- 18.Schaefer C, Kim GG, Albers A, Hoermann K, Myers EN, Whiteside TL. Characteristics of CD4+CD25+ regulatory T cells in the peripheral circulation of patients with head and neck cancer. Br J Cancer. 2005;92:913–20. doi: 10.1038/sj.bjc.6602407. [DOI] [PMC free article] [PubMed] [Google Scholar]
- 19.Liyanage UK, Goedegebuure PS, Moore TT, et al. Increased prevalence of regulatory T cells (Treg) is induced by pancreas adenocarcinoma. J Immunother. 2006;29:416–24. doi: 10.1097/01.cji.0000205644.43735.4e. [DOI] [PubMed] [Google Scholar]
- 20.Ling KL, Pratap SE, Bates GJ, et al. Increased frequency of regulatory T cells in peripheral blood and tumour infiltrating lymphocytes in colorectal cancer patients. Cancer Immunol. 2007;7:7. [PMC free article] [PubMed] [Google Scholar]
- 21.Strauss L, Bergmann C, Whiteside TL. Functional and phenotypic characteristics of CD4+CD25+ Foxp3+ nTreg clones obtained from peripheral blood of normal controls and patients with cancer. Int J Cancer. 2007;121:2473–83. doi: 10.1002/ijc.23001. [DOI] [PubMed] [Google Scholar]
- 22.Albers AE, Ferris RL, Kim GG, Chikamatsu K, DeLeo AB, Whiteside TL. Immune responses to p53 in patients with cancer: enrichment in tetramer+ p53 peptide-specific T cells and regulatory T cells at tumor sites. Cancer Immunol Immunother. 2005;54:1072–81. doi: 10.1007/s00262-005-0670-9. [DOI] [PMC free article] [PubMed] [Google Scholar]
- 23.Strauss L, Bergmann C, Szczepanski M, Gooding W, Johnson JT, Whiteside TL. A unique subset of CD4+CD25highFoxp3+ T cells secreting IL-10 and TGF-β1 mediates suppression in the tumor microenvironment. Clin Cancer Res. 2007;13:4345–54. doi: 10.1158/1078-0432.CCR-07-0472. [DOI] [PubMed] [Google Scholar]
- 24.Bergmann C, Strauss L, Zeidler R, Lang S, White-side TL. Expansion of human T regulatory type 1 cells in the microenvironment of COX-2 overexpressing head and neck squamous cell carcinoma. Cancer Res. 2007;67:8865–73. doi: 10.1158/0008-5472.CAN-07-0767. [DOI] [PubMed] [Google Scholar]
- 25.Zhou G, Levitsky HI. Natural regulatory T cells and de novo-induced regulatory T cells contribute independently to tumor-specific tolerance. J Immunol. 2007;178:2155–62. doi: 10.4049/jimmunol.178.4.2155. [DOI] [PubMed] [Google Scholar]
- 26.Whiteside TL, Miescher S, MacDonald HR, Von Fliedner V. Separation of tumor-infiltrating lymphocytes from tumor cells in human solid tumors. A comparison between velocity sedimentation and discontinuous density gradients. J Immunol Methods. 1986;90:221–33. doi: 10.1016/0022-1759(86)90079-7. [DOI] [PubMed] [Google Scholar]
- 27.Bergmann C, Strauss L, Zeidler R, Lang S, Whiteside TL. Expansion and characteristics of human T regulatory type 1 cells in co-cultures simulating tumor micro-environment. Cancer Immunol Immunother. 2007;56:1429–42. doi: 10.1007/s00262-007-0280-9. [DOI] [PMC free article] [PubMed] [Google Scholar]
- 28.Kruskal W, Wallis W. Use of ranks in one-criterion variance analysis. J Am Stat Assoc. 1952;47:583–21. [Google Scholar]
- 29.So T, Croft M. Cutting edge: OX40 inhibits TGF-β- and antigen-driven conversion of naive CD4 T cells into CD25+Foxp3+ T cells. J Immunol. 2007;179:1427–30. doi: 10.4049/jimmunol.179.3.1427. [DOI] [PubMed] [Google Scholar]
- 30.Kemper C, Atkinson JP. T-cell regulation: with complements from innate immunity. Nat Rev Immunol. 2007;7:9–18. doi: 10.1038/nri1994. [DOI] [PubMed] [Google Scholar]
- 31.Strauss L, Bergmann C, Gooding W, Johnson JT, Whiteside TL. The frequency and suppressor function of CD4+CD25highFoxP3+ T cells in the circulation of patients with squamous cell carcinoma of the head and neck. Clin Cancer Res. 2007;13:6301–11. doi: 10.1158/1078-0432.CCR-07-1403. [DOI] [PubMed] [Google Scholar]
- 32.Whiteside TL. Immune suppression in cancer: effects on immune cells, mechanisms and future therapeutic intervention. Semin Cancer Biol. 2006;16:3–15. doi: 10.1016/j.semcancer.2005.07.008. [DOI] [PubMed] [Google Scholar]
- 33.Beyer M, Schultze JL. Regulatory T cells in cancer. Blood. 2006;108:804–11. doi: 10.1182/blood-2006-02-002774. [DOI] [PubMed] [Google Scholar]
- 34.Curiel TJ, Coukos G, Zou L, et al. Specific recruitment of regulatory T cells in ovarian carcinoma fosters immune privilege and predicts reduced survival. Nat Med. 2004;10:942–9. doi: 10.1038/nm1093. [DOI] [PubMed] [Google Scholar]
- 35.Ferris RL, Whiteside TL, Ferrone S. Immune escape associated with functional defects in antigen-processing machinery in head and neck cancer. Clin Cancer Res. 2006;12:3890–5. doi: 10.1158/1078-0432.CCR-05-2750. [DOI] [PubMed] [Google Scholar]
- 36.Fricke I, Gabrilovich DI. Dendritic cells and tumor microenvironment: a dangerous liaison. Immunol Invest. 2006;35:459–83. doi: 10.1080/08820130600803429. [DOI] [PMC free article] [PubMed] [Google Scholar]
- 37.Struass L, Bergmann C, Szczepanski MJ, Lang S, Kirkwood JM, Whiteside TL. Expression of inducible co-stimulatory molecules (ICOS) on human melanoma-infiltrating CD4+CD25highFoxp3+ T regulatory cells: implications and impact on tumor-mediated immune suppression. J Immunol. 2008;180:2967–80. doi: 10.4049/jimmunol.180.5.2967. [DOI] [PubMed] [Google Scholar]
- 38.Kemper C, Verbsky JW, Price JD, Atkinson JP. T cell stimulation and regulation: with complements from CD46. Immunol Res. 2005;32:31–43. doi: 10.1385/IR:32:1-3:031. [DOI] [PubMed] [Google Scholar]
- 39.Gregori S, Bacchetta R, Passerini L, Levings MK, Roncarolo MG. Isolation, expansion and characterization of human natural and adaptive regulatory T cells. Meth Mol Biol. 2007;380:83–105. doi: 10.1007/978-1-59745-395-0_6. [DOI] [PubMed] [Google Scholar]
- 40.Kryczek I, Wei S, Zou L, et al. Cutting edge: Th17 and regulatory T cell dynamics and the regulation by IL-12 in the tumor microenvironment. J Immunol. 2007;178:6730–33. doi: 10.4049/jimmunol.178.11.6730. [DOI] [PubMed] [Google Scholar]
- 41.de Visser KE, Eichten A, Coussens LM. Paradoxical roles of the immune system during cancer development. Nat Rev Cancer. 2006;6:24–37. doi: 10.1038/nrc1782. [DOI] [PubMed] [Google Scholar]
- 42.Banerjee DK, Dhodapkar MV, Matayeva E, Steinman RM, Dhodapkar KM. Expansion of FOXP3 high regulatory T cells by human dendritic cells (DCs) in vitro and after injection of cytokine-matured DCs in myeloma patients. Blood. 2006;108:2655–61. doi: 10.1182/blood-2006-03-011353. [DOI] [PMC free article] [PubMed] [Google Scholar]
- 43.Curiel TJ. Tregs and rethinking cancer immunotherapy. J Clin Invest. 2007;117:1167–74. doi: 10.1172/JCI31202. [DOI] [PMC free article] [PubMed] [Google Scholar]