

Abstract
Transcription start site (TSS) evolution remains largely undescribed in Drosophila, likely due to limited annotations in non-melanogaster species. In this study, we introduce a concise new method that selectively sequences from the 5′-end of mRNA and used it to identify TSS in four Drosophila species, including Drosophila melanogaster, D. simulans, D. sechellia, and D. pseudoobscura. For verification, we compared our results in D. melanogaster with known annotations, published 5′-rapid amplification of cDNA ends data, and with RNAseq from the same mRNA pool. Then, we paired 2,849 D. melanogaster TSS with its closest equivalent TSS in each species (likely to be its true ortholog) using the available multiple sequence alignments. Most of the D. melanogaster TSSs were successfully paired with an ortholog in each species (83%, 86%, and 55% for D. simulans, D. sechellia, and D. pseudoobscura, respectively). On the basis of the number and distribution of reads mapped at each TSS, we also estimated promoter-specific expression (PSE) and TSS peak shape, respectively. Among paired TSS orthologs, the location and promoter activity were largely conserved. TSS location appears important as PSE, and TSS peak shape was more frequently divergent among TSS that had moved. Unpaired TSS were surprisingly common in D. pseudoobscura. An increased mutation rate upstream of TSS might explain this pattern. We found an enrichment of ribosomal protein genes among diverged TSS, suggesting that TSS evolution is not uniform across the genome.
Keywords: promoter, transcription start site, gene expression, CAGE, TSS, Drosophila
Introduction
At a given gene, a functionally redundant promoter and associated transcription start site (TSS) may emerge (“birth") via random mutations, and similar to gene duplication events, one copy may experience relaxed selection (Ohno 1970). Ultimately, one copy “dies" or evolves a new function. Thus, a new TSS may arise or a TSS may move, or turnover, via this birth and death process (fig. 1). Conservation of TSS locations has mostly been explored between human and mouse, where TSS turnover (20%) (Frith et al. 2006) is reported to be less common than transcription factor binding site (TFBS) turnover (32–40%) (Dermitzakis and Clark 2002). However, regulatory divergence (including TSS movement) may be difficult to interpret at such evolutionary distances as mouse and human. Thus, comparisons among Drosophila species would be ideal, as multiple species genome alignments are available. For example, a recent study found that TFBS locations are highly conserved between Drosophila species in spite of extensive sequence turnover (Bradley et al. 2010). TSS turnover has been assessed in Drosophila but only for select genes (Sorourian 2010), including gene duplicates (Park and Makova 2009). We suspect that this is due to a lack of genome-wide TSS annotations in non-Drosophila melanogaster species. TSS annotations remain limited perhaps in part due to the lack of a clear canonical promoter motif (Ohler et al. 2002). Thus, the requirements for TSS initiation may be rather flexible, highlighting the importance of molecularly validated TSS in making quality annotations and comparisons between species. Understanding TSS evolution is important because variants for TSS usage have been linked to important phenotypic differences (Wray 2003), including susceptibility to disease (Shin et al. 2000; Bonilla et al. 2006). Furthermore, promoter and TSS differences may account for important cis-regulatory differences (Wittkopp et al. 2004) between Drosophila species.
Fig. 1.

Sequence turnover is indicated as color changes and TSS turnover as movement of TSS location. Note that expression and location are largely maintained during sequence turnover. TSS turnover is coincident with sequence changes and may be a gradual process.
In this study, we developed a new method that identifies TSS and employed it to explore trends in TSS evolution in Drosophila. This concise method yields long (e.g., 76 bp), paired-end reads that are anchored to the 5′-end of mRNA. After mapping to each respective genome, we estimated and removed background noise using RNAseq reads (as a null model) generated from the same mRNA pool. Using this approach, we called TSS in four Drosophila species, including D. melanogaster (mel), D. simulans (sim), D. sechellia (sec), and D. pseudoobscura (pse). Then, we paired each mel TSS with its putative ortholog in each species (based on proximity) using the available multiple sequence alignment. From these results, we estimated overall and species-specific TSS differences, with respect to mel. For example, TSSs that are conserved in all but one species were considered species-specific TSS differences. Additionally, if a TSS variant was shared between sim and sec alone, we assumed the mutation event occurred before the split of these sister species. The relative abundance and distribution of coverage (TSS peak shape) at each TSS was highly reproducible between biological and technical replicates, and expression estimates were comparable to RNAseq results generated from the same mRNA pool. Thus, we also estimated promoter-specific expression (PSE) and TSS peak shape for each species and compared conservation of promoter activity with the conservation of TSS location.
New Approaches
5′-Anchored Reads
Several molecular techniques can be used to locate TSS including cap analysis for gene expression (CAGE) (Shiraki et al. 2003) and several updated versions (Ni et al. 2010; Plessy et al. 2010; Kanamori-Katayama et al. 2011), 5′-rapid amplification of cDNA ends (RACE) (Harvey and Darlison 1991), robust analysis of 5′-transcript ends (Gowda et al. 2007), and FLcDNA assays (Suzuki et al. 1997). The original CAGE protocol involves the concatenation of short 5′-sequence tags (14–20 bp), followed by traditional Sanger sequencing (Shiraki et al. 2003). More recently, CAGE and similar 5′-targeting methods have been adapted to high-throughput sequencing (Sandelin et al. 2007; Ni et al. 2010; Plessy et al. 2010; Kanamori-Katayama et al. 2011). One major difference between the available methods is the approach used to target 5′-ends of full length transcripts. For example, some methods rely on the removal of the 5′-cap structure with tobacco acid pyrophosphatase (TAP), others use the 5′-cap structure to perform template switching, and 5′-caps can also be biotinyled and isolated with streptavidin beads. We wanted a simple and straightforward approach without specific limitations, such as short reads (tags) (Harbers and Carninci 2005; Kodzius et al. 2006; Ni et al. 2010) and single-end reads (Kodzius et al. 2006), which hinder mapping, and added sampling bias from a required semisuppressive polymerase chain reaction (PCR) step (Plessy et al. 2010; Salimullah et al. 2011). Thus, we generated 5′-anchored reads using a concise TAP-based protocol that employs standard Illumina adapters and barcode indexes and is free of the aforementioned drawbacks. We extracted total RNA from whole body, adult female flies from each Drosophila species. We purified mRNA using oligo-dT Dynabeads (Invitrogen) and ligated an RNA adapter oligo to the 5′-end of each mRNA molecule. We chemically fragmented the ligated mRNA using RNA fragmentation reagent (Ambion) and generated single-stranded cDNA with reverse transcriptase and random hexamers, followed by RNAse H treatment. We added a primer complementary to the 5′-ligated adapter sequence and performed one primer extension step at 72 °C with Taq polymerase to yield double-stranded fragments of all 5′-ends (fig. 2). This primer has a 5′-amine group to prevent concatenation and subsequent ligation. Taq adds an A-overhang in a template-independent fashion (Clark 1988), thus we can bypass the typical blunt-end repair and cleanup step and immediately ligate standard Illumina adapters in a strand-specific orientation. Standard Illumina indexing barcodes were then added during PCR enrichment of each sample. We sequenced the 5′-enriched fragments on an Illumina Genome Analyzer II (see supplementary file, Supplementary Material online, for a detailed protocol).
Fig. 2.
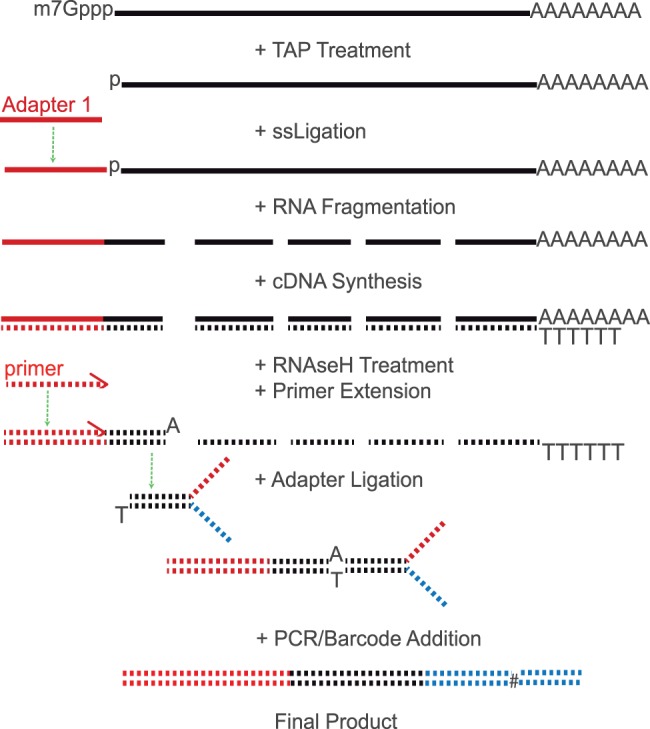
Solid lines represent RNA and dashed lines indicate cDNA. Black lines are biological sequences, and red and blue represent Illumina adapters 1 and 2, respectively. Standard Illumina barcoding Indexes (see the # symbol) can be incorporated during PCR.
One potential concern with using TAP treatment and RNA ligation is that RNA secondary structure might bias ligation. However, our results were highly reproducible, and expression estimates were similar with RNAseq results generated from the same mRNA pool (table 1). Also, we expect any bias in our sampling of TSS to be largely consistent between species, enabling us to compare TSS among species. Unlike typical 5′-RACE protocols, phosphatase treatment (e.g., using CIP) is optional in our protocol due to a required mRNA purification step, which leaves only trace amounts of uncapped product (e.g., rRNA). It is possible that fragmented or nonfull-length mRNA are present and could result in a false-positive TSS read. However, assuming break points are random, these signals would be removed as background. As with any 5′-cap targeting method, results may include reads from transcripts that have broken and been recapped (ENCODE 2009).
Table 1.
Method Reproducibility.
| Comparison | ra | P | Nb |
|---|---|---|---|
| 5′-Anchored technical reps | 0.91 | <0.000001 | 759,628 |
| 5′-Anchored biological reps | 0.87 | <0.000001 | 2,471,760 |
| RNAseq technical reps | 0.86 | <0.000001 | 132,600 |
RNAseq vs. 5′-anchored 
|
0.60 | <0.0001 | NA |
Note.—NA, not applicable.
aPearson correlation coefficient.
bSample size.
Genome sequencing technology has advanced at an incredible rate making genome annotations a limiting factor in comparative genomics. This issue highlights the importance of methods similar to the one described here. Our method generates long, paired-end reads for improved mapping and the removal of PCR duplicates. This concise approach is amenable to projects with many samples and only requires 1–5 µg of total RNA, which is less than other methods that, like ours, do not rely on semisuppressive PCR (Shiraki et al. 2003; Kodzius et al. 2006; Ni et al. 2010). We believe this approach will be a valuable option for exploring TSS differences, improving genome annotations, and more generally, for gene expression studies where comparing PSE is important.
Results and Discussion
Analysis of 5′-Anchored Reads
We mapped the 76-bp paired-end reads to each respective reference genome of each species using the Burrows–Wheeler Aligner (BWA) (Li and Durbin 2009) (allowing 4% mismatches). We required that both reads in a pair mapped unambiguously, which allowed us to remove a substantial amount of PCR duplicates (table 2). The 5′-mapping position of the first read in each pair represents the TSS. We observed a prominent enrichment of reads mapped near known TSS in mel, but there was apparent background noise, likely due to residual RNAseq reads. Thus, we modeled the error in the method using RNAseq reads generated from the same mRNA pool. We chose a threshold that removed 99% of positions identified from RNAseq (10 reads within 50 bp, see Materials and Methods). Next, we identified a single-representative TSS position centered in each cluster of TSS reads (TSS peak) to compare between species (see Materials and Methods). The majority of representative TSS positions (85%) and total reads mapped (84%) occurred within 200 bp of annotated 5′-transcript ends in mel (table 3). A previous CAGE study found a similar percent of reads that overlapped known TSS regions (86%) (Hoskins et al. 2011).
Table 2.
Mapping Results.
| Species | Method | Total RNA (µg) | Reads | Mapped | Percentage | Filtereda | Percentage |
|---|---|---|---|---|---|---|---|
| mel | CAGE | 5 | 858,863 | 372,550 | 43 | 166,096 | 19b |
| mel | CAGE | 10 | 119,426 | 58,556 | 49 | NA | NA |
| sim | CAGE | 5 | 1,180,578 | 823,516 | 70 | 320,263 | 27 |
| sec | CAGE | 5 | 1,003,687 | 695,863 | 69 | 287,079 | 29 |
 c c
|
CAGE | 5 | 627,904 | 286,214 | 46 | NA | NA |
 |
CAGE | 5 | 1,201,745 | 488,569 | 41 | NA | NA |
| pse | CAGE | 5 | 1,161,039 | 822,188 | 71 | 323,942 | 28 |
| mel | RNAseq | 5 | 1,209,363 | 706,386 | 58 | 1,232,707 | 43b |
| mel | RNAseq | 10 | 1,664,075 | 1,004,598 | 60 | NA | NA |
Note.—NA, note applicable.
aMapped reads after removing PCR duplicates.
b5 μg and 10 μg samples were pooled.
cDrosophila mauritiana was used for reproducibility estimates only.
Table 3.
Accuracy of TSS Estimates.
| Enrichment Category | Reads (%) | TSS (%) |
|---|---|---|
| 5′-end (±200 bp) | 83,237 (84%) | 2,453 (85%) |
| CDS regions | 5,673 (6%) | 180 (6%) |
| Other | 10,284 (10%) | 240 (8%) |
To determine whether the non-5′-end TSS peaks are likely new TSS or error, we explored these further. The non-5′-end TSS peaks included 301 that mapped to chromosome U and Uextra; sequences composed of unmapped heterochromatic regions of the genome that are arbitrarily concatenated together (Hoskins et al. 2007). Another 6% mapped within coding regions and 10% mapped to intergenic regions. Additionally, seven TSS peaks were identified at 5′-ends of protein-coding genes in the mitochondrial genome (e.g., CoI-III and ND3). Here, we focused on PolII transcripts, so mitochondrial TSSs were not analyzed further. We also avoided heterochromatic regions (i.e., TSS in chrU and chrUextra) of the genome because inherent challenges in sequencing, assembling, and localizing repeats in these regions may result in quality differences and limited alignments between species. Unexpected TSS locations are not unique to our TSS study (Frith et al. 2006; Hoskins et al. 2011) and may represent previously unannotated promoters, RNA breaks followed by recapping events (ENCODE 2009), or background noise from the method.
In summary, we compared 2,849 high confidence mel TSS with relative positions of TSS orthologs in sim, sec, and pse. It should be noted that this subset of mel genes is enriched for highly expressed genes, and extremely tissue-specific genes are under-represented (see supplementary figs. S1 and S2, Supplementary Material online). We attribute a portion of this bias to our conservative threshold for identifying TSS. However, as diverged TSSs were also enriched for highly expressed genes (see supplementary fig. S1, Supplementary Material online), our overall estimates of TSS conservation likely remain conservative.
TSS Conservation between Drosophila Species
The birth of a new (alternative) TSS and TSS movement may contribute to regulatory variation, but the degree to which relative TSS locations are conserved among Drosophila is unknown. To assess TSS conservation in Drosophila, we paired each mel TSS with its ortholog in sim, sec, and pse. We accomplished this by converting the mel TSS position to an equivalent position in each species using the whole-genome pairwise alignment available from the UCSC genome browser and a LiftOver utility (see Materials and Methods). The most likely ortholog was then chosen based on proximity. Transcription initiates from a range of local positions at a given promoter, typically spanning less than 50 bp (Hoskins et al. 2011). Thus, we required that TSS orthologs be separated by more than 50 bp before we considered it as evidence for TSS movement. Intuitively, as the distance between putative orthologs increases, so does the likelihood that it was mispaired (e.g., with a promoter at a nearby gene). To limit this, we only paired TSS orthologs within 500 bp. Using this approach, we identified orthologous positions for nearly all the mel TSS in the sister species sim (96%) and sec (98%, table 4). We found much fewer orthologous positions in the more diverged pse (71%).
Table 4.
Mapping Percentages of mel TSS to each Species.
| Species | Mapped (%) | Unpaireda (%) | Paired (%) | <50 bp (%)b | >50 bp (%)b |
|---|---|---|---|---|---|
| sim | 2,730 (96%) | 374 (13%) | 2,356 (86%) | 2,242 (95%) | 114 (5%) |
| sec | 2,799 (98%) | 359 (13%) | 2,440 (87%) | 2,332 (96%) | 108 (4%) |
| pse | 2,036 (71%) | 469 (16%) | 1,567 (77%) | 1,385 (88%) | 182 (12%) |
aUnpaired mel TSS do not include unmapped.
bPercent out of all paired.
In total, 1,285 mel TSSs were paired with orthologs in all three other species, an additional 1,106 were paired with orthologs in at least two species, and an additional 296 mel TSSs were identified in only one species (fig. 3). We plotted the distribution of distances between all TSS orthologs for each species to elucidate any trends in TSS movement. This resulted in a sharp distribution of distances centered at 0 bp (relative to mel) between orthologous TSS for each species (fig. 4). Furthermore, only 4% of mel TSS between sister species and 9% between pse were separated by more than 50 bp. Thus, over 90% of the paired TSS locations were conserved in each Drosophila species, including the more distantly related pse. We expect these estimates of TSS conservation to be an overestimate because this trend excludes orthologs separated by more than 500 bp, movement less than 50 bp, TSS in unaligned regions, and TSS that were expressed below detection. For example, 13–16% of mel TSS locations had identifiable orthologous positions but lacked an orthologous TSS within 500 bp in a given species. Unaligned regions prevented the identification of another 4%, 2%, and 29% of mel TSS regions in sim, sec, and pse, respectively (table 4). Many of these cases likely involve substantial evolutionary events. For example, we observed a sec-specific deletion at a promoter (fig. 5). Improved multiple species alignments, exhaustive sequencing coverage, combinations of sequencing approaches, and tests between more intermediate species (e.g., D. yakuba and D. erecta) and even comparisons within species may further help track highly diverged orthologous sequences and TSS movement between Drosophila species.
Fig. 3.

The number of overlapping mel orthologs found in each species is shown. For example, 1,285 mel TSS had an identified ortholog in each species, and another 103 mel orthologs were only found in sim.
Fig. 4.

These histograms show that mel TSS locations are largely conserved in sim (A), sec (B), and pse (C). Distances were calculated with respect to mel and the coding region. Thus, positive numbers are downstream from mel and negative values are upstream from mel.
Fig. 5.
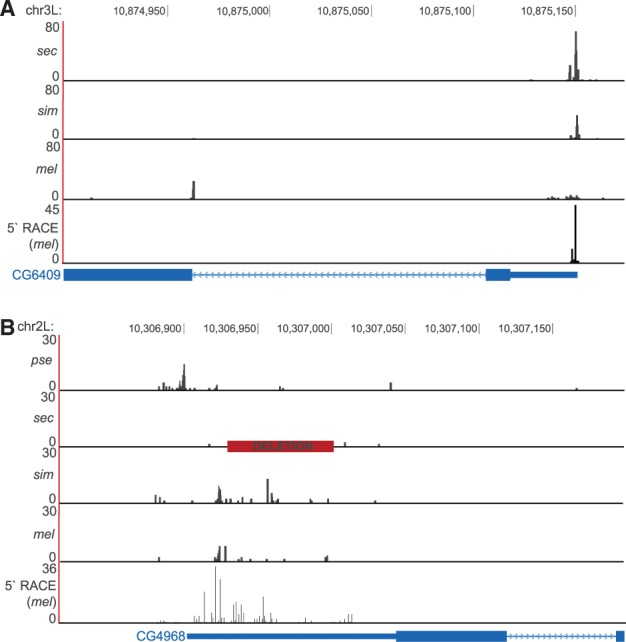
Detailed examples of TSS variation between species. (A) There is a mel-specific, downstream TSS in CG6409, associated with the broadening of the upstream TSS. This may be an intermediate TSS turnover event. pse is not aligned in this region. (B) A sec-specific deletion (red square) at the TSS associated with nearly a complete loss of activity in sec. Also, predominant pse activity appears to have shifted 20 bp upstream.
We hypothesized that TSS divergence accounts for important cis-regulatory differences between species. Thus, we identified cases of species-specific TSS movement. We assumed that cases of TSS divergence in both sim and sec exist due to a mutation before their speciation event (fig. 6). Similarly, if a mel TSS was diverged in all species, based on parsimony, we considered it as mel-specific TSS movement. Similar to our overall results, we report cases of species-specific TSS differences in three distinct categories of promoter divergence: paired but separated by more than 50 bp, mapped but unpaired, and unmapped. As expected, we observed similar species-specific differences for sim and sec, due to their equal divergence time from mel (fig. 6). However, unmapped TSSs were more common in sim (65 vs. 18), likely due to differences in genome quality between species. The pse-specific TSS differences were highest in all categories as expected due to its higher divergence time. The mel TSS positions that did not align between species likely indicate considerable sequence divergence at these regions. This may occur from movement of the entire TSS followed by degeneration of the now nonfunctional promoter element or a duplication event that prevents unambiguous alignment. We believe the relative proportion of mel TSS that do not map between species is an informative estimate of sequence divergence at TSS. To test whether TSS divergence was uniform across the genome, we checked for enrichment of gene ontology categories among genes with TSS differences. Interestingly, we found a significant enrichment of ribosomal protein genes for each species (P = 1.4e-16). Perhaps, TSS movement and sequence turnover have hindered the discovery of functional regulatory elements for these genes (Hu and Li 2007). Overall, we observed highly conserved TSS locations between each species, which is in contrast to estimates among mammals (Frith et al. 2006).
Fig. 6.
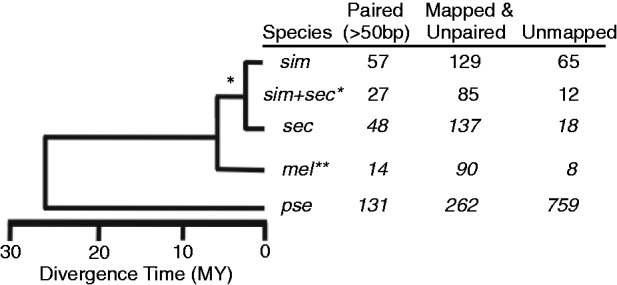
The relatedness of each species and the number of TSS changes in each species with respect to mel (N = 2,849). *When TSS turnover events were shared by sim and sec, we assumed it occurred before speciation of sim and sec. **When mel TSSs were diverged between all species pairs, we considered it a mel-specific turnover event.
Considering that promoters are essential regulatory elements, we were surprised that 29% of mel TSS positions did not map to pse. Positive selection on distinct elements or an increased mutation rate in TSS proximal DNA might explain this elevated sequence divergence. To test this, we explored patterns of local sequence conservation flanking the TSS. Interestingly, there is a prominent increase in sequence divergence upstream of the TSS among insects (fig. 7). If positive selection has occurred between species, we might expect increased divergence between species and reduced sequence variation within species. Thus, we examined mutation frequencies within a population of mel. We observed a trend of increased variation (elevated frequency of segregating mutations) upstream of the TSS that coincided with reduced sequence conservation between species (fig. 7D). This suggests that an increased mutation rate upstream of TSS might be the source.
Fig. 7.

We examined patterns of sequence conservation within 2 kb of mel TSS (N = 2,849). (A) The trend of SNPs around all mel TSS in sim (black) and sec (red). This plot shows the averages of a 100 bp sliding window. (B) Similar to (A), but with indels. (C) Plotted are the average sequence conservation (PhastCons 15 insect species) scores around TSS. Note that there is a dip in conservation corresponding with the spike in mutations between mel and sim. (D) We examined mel population data and plotted the frequency of segregating sites around TSS. This spike in sequence diversity upstream of TSS indicates that there is likely an increased mutation rate upstream of TSS.
Conservation of Promoter-Specific Expression (PSE) and TSS Peak Shape
Expression profiles from our 5′-anchored reads were highly reproducible between technical and biological replicates (Pearson correlation, r = 0.91, P < 0.0001 and r = 0.87, P < 0.0001, respectively; table 1), and expression estimates (FPKM) were highly correlated with standard RNAseq derived from the same RNA pool (r = 0.60, P < 0.0001). Thus, we did not detect substantial bias from the method. We estimated PSE from the total number of reads that map within 50 bp of each representative TSS position. We normalized each PSE estimate by dividing by the total number of reads mapped in each sample. To illustrate the type of data we generated and the value of estimating PSE, we describe species-specific usage of two alternative promoters of alcohol dehydrogenase (ADH), a highly studied gene important in ethanol preference and tolerance in fermenting food (Malherbe et al. 2005; Ogueta et al. 2010). These alternative promoters are known to be tissue specific and temporally regulated (Posakony et al. 1985). The proximal TSS is favored in mel, sim, and sec to varying degrees, but pse exclusively uses the distal TSS in adult females (fig. 8). Interspecific differences in expression from these alternative promoters has been observed previously, but an adaptive link has not been reported (Papaceit et al. 2004).
Fig. 8.

In the ADH gene, we observe significant differences in PSE between species. For example, mel has biased expression of the downstream promoter, such as sec. However, pse is restricted to the upstream alternative promoter and sim is restricted to the downstream promoter.
Highly significant correlations in PSE were found between Drosophila species (Pearson correlation, r = 0.63, P < 0.0001; r = 0.66, P < 0.0001; and r = 0.54, P < 0.0001 for sim, sec, and pse, respectively; table 5). TSS movement may significantly alter the suite of regulatory elements associated with each promoter. Thus, we hypothesized that PSE differences will increase between TSS that have moved. To test this, we compared correlations in PSE between TSS with conserved locations and TSS that have moved beyond 50 bp. For conserved TSS, correlations in PSE increased relative to the overall estimates (r = 0.65, P < 0.0001; r = 0.68, P < 0.0001; and r = 0.57, P < 0.0001 for sim, sec, and pse, respectively; table 5). Interestingly, the minority of paired TSS orthologs that have moved beyond 50 bp have more differences in expression (r = 0.17, P = 0.07; r = 0.26, P = 0.006; table 5). This result highlights the importance of the relative position of TSS on maintaining gene expression levels.
Table 5.
Conservation of Promoter-Specific Expression between Species.
| Species | r (All)a | Nb | P | r (TSS < 50 bp)c | N | P | r (TSS > 50 bp) | N | P |
|---|---|---|---|---|---|---|---|---|---|
| sim | 0.63 | 2,381 | 9.1e-261 | 0.65 | 2,266 | 1.9e-268 | 0.17 | 115 | 0.07 |
| sec | 0.66 | 2,448 | 7.9e-301 | 0.68 | 2,340 | 4.3e-315 | 0.26 | 108 | 0.006 |
| pse | 0.54 | 1,585 | 8.9e-120 | 0.57 | 1,400 | 5.4e-119 | 0.22 | 185 | 0.002 |
ar = Pearson correlation coefficient.
bN = Sample size.
cr < 50 bp are correlations limited to orthologs within 50 bp.
Contrary to many “textbook” descriptions of transcription initiation in eukaryotes, transcripts start from a range of local positions at a given promoter. This results in a frequency distribution of initiation events that varies between promoters from “broad” to “sharp” (Ohler et al. 2002; Carninci et al. 2006; Nickel and Seedorf 2008; Rach et al. 2009). These “broad” and “sharp” structures are reproducible and largely conserved between mouse and human (Carninci et al. 2006) and between life stages of Drosophila (Hoskins et al. 2011). Comparisons between Drosophila species have only been made on select genes (Park and Makova 2009; Sorourian 2010). In this study, we roughly quantify the structure at each promoter using an entropy-based model (see Materials and Methods) and compare estimates between orthologs. Using this approach, we report that TSS initiation distributions are highly correlated between all species (Pearson correlation, r = 0.75, P < 0.0001; r = 0.76, P < 0.0001; and r = 0.66, P < 0.0001 for sim, sec, and pse, respectively; table 6). Roughly, sharp peaks remain as sharp peaks between species (and vice versa). Similar to PSE, correlations between TSS distributions increase when TSS location is conserved (r = 0.77, P < 0.0001, r = 0.79, P < 0.0001, r = 0.70, P < 0.0001 for sim, sec, and pse respectively) and decrease when TSSs are separated by more than 50 bp (r = 0.06, P = 0.56, r = 0.30, P = 0.002, r = 0.11, P = 0.15 for sim, sec, and pse respectively; table 6). Thus, the relative location of TSS is important for maintaining several aspects of promoter activity. A previous study highlighted a species-specific change in TSS peak shape (Sorourian 2010). In support of this, we observed several cases of divergence in TSS peak shape from sharp to broad (with respect to the inferred ancestral state) coinciding with the birth of a new TSS (fig. 5A).
Table 6.
Conservation of TSS Peak Shape between Species.
| Species | r (All) | N | P | r (< 50 bp) | N | P | r (> 50 bp) | N | P |
|---|---|---|---|---|---|---|---|---|---|
| sim | 0.75 | 2,381 | 0.0 | 0.77 | 2,266 | 0.0 | 0.06 | 115 | 0.54 |
| sec | 0.76 | 2,448 | 0.0 | 0.79 | 2,340 | 0.0 | 0.30 | 108 | 0.002 |
| pse | 0.66 | 1,585 | 6.1e-202 | 0.70 | 1,400 | 4.2e-209 | 0.11 | 185 | 0.15 |
Materials and Methods
Fly Strains
We used the following Drosophila strains in this study: Drosophila melanogaster: DGRP line hybrid of 303 and 313. Bloomington stock: 25176 and 25180, respectively. Drosophila simulans: st e line; UCSD stock: 14021 0251.034. Drosophila pseudoobscura: UCSD stock: 14011 0121.32. Drosophila sechellia: Robertson Line 1. Drosophila mauritiana: w140 (used in reproducibility estimates).
CAGE Library Preparation
We collected 20 virgin females from each Drosophila species and snap-froze them in liquid nitrogen in the morning as 3–5-day-old adults before storing them at −80 °C until further processing. We extracted total RNA using the Zymoresearch duet Kit. We prepared CAGE libraries for each of the five Drosophila species using 5 µg of total RNA (fig. 2). First, we used Dynabeads to isolate mRNA by polyA selection. Then, we treated the mRNA with TAP, which removes a pyrophosphate from the 5′-cap structure and exposes a 5′-phosphate to ligation with an RNA oligo (containing a Solexa adapter sequence). Next, we used RNA fragmentation reagent (Ambion) to randomly fragment the adapter-ligated mRNA before converting to single-stranded cDNA. We enriched for 5′-fragments by adding a primer that is homologous to the ligated RNA adapter oligo and performing one round of polymerase extension using Taq DNA Polymerase (Thermus aquaticus). Taq was specifically chosen because it adds an A at the end of each fragment in a template-independent fashion (Clark et al. 2006). Thus, after Taq extension (hence the name: Taq-ex CAGE), all 5′-fragments are double-stranded with an A-overhang on one end. From here, the standard RNAseq protocol is followed including adapter ligation, size selection, and index addition with PCR enrichment. A detailed protocol is available in supplementary materials, Supplementary Material online.
Mapping CAGE Reads
Sequencing on an Illumina GAII with 76-bp reads resulted in over 1 million paired-end reads per species library (table 2). For a given species, the raw paired-end reads were mapped to their own genome using BWA version 0.5.9-r16. We mapped D. simulans reads to droSim1, D. sechellia reads to droSec1, D. pseudoobscura reads to dp4, and D. mauritiana reads to a DroMau draft genome (Nolte et al. 2013) (used for reproducibility estimates only). We allowed 4% mismatches and only accepted uniquely mapping reads. Next, PCR duplicates were removed using picards Mark Duplicate Reads (version 1.56.0).
TSS Peak Calling
TSSs were identified from the paired-end CAGE data from the 5′-mapping position of the first read in each pair. Active promoters are represented as a frequency distribution of initiation events along the genome. We filtered for promoter regions with a minimum of 10 reads mapped within 50 bp, similar to Hoskins et al. (2011). At each promoter, we identified the average position used within the local frequency distribution of initiation events. Then, we chose the highest expressed TSS within 500 bp in D. melanogaster for comparisons between species. Thus, alternative TSSs were compared only if they were separated by 500 bp or more.
TSS Peak Shape Quantification
To quantify peak shape, we calculated an entropy-based score within a 65-bp window centered on each TSS, similar to Hoskins et al. (2011). For some positions within the window, there may be zero reads mapped resulting in a probability of 0, underestimating of the true probability. The approach used by Hoskins et al. (2011) excluded these positions from the analysis, which effectively results in variable window sizes for each TSS distribution. When the window sizes are different, entropy estimates will be biased. Thus, we incorporated Laplace's rule to account for cases of zero hits before calculating entropy. This approach adds a uniform probability (one mapped TSS read) across the entire window before estimating entropy. Here is the equation for our entropy-based score (E) estimated at each TSS: 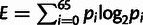 . It should be noted that entropy estimates for bimodal peaks or other higher order peak shapes may be overestimated using this method.
Connecting Orthologs
We created an interval file with each TSS peak position found in D. melanogaster and converted these chromosomal positions to coordinates in the D. simulans (droSim1), D. sechellia (droSec1), and D. pseudoobscura (dp4) genomes using a LiftOver utility (Convert Genome Coordinates [Version 1.0.3]) available on the web-based galaxy platform (Giardine et al. 2005; Blankenberg et al. 2010; Goecks et al. 2010). Starting with the D. melanogaster TSS position converted to D. simulans (for example), we paired putative TSS orthologs based on proximity in D. simulans within 500 bp.
Supplementary Material
Supplementary file and figures S1 and S2 are available at Molecular Biology and Evolution online (http://www.mbe.oxfordjournals.org/).
Acknowledgments
The authors thank J.P. Masly for donating fly stocks and Christian Schlotterer for sharing genomic data. They also thank Johanna Main and Joe Dunham for discussions about the article and the method, respectively. This work was supported by the National Institutes of Health (grant numbers RO1 MH091561 and P50 HG002790 to S.V.N.).
References
- Blankenberg D, Von Kuster G, Coraor N, Ananda G, Lazarus R, Mangan M, Nekrutenko A, Taylor J. Galaxy: a web-based genome analysis tool for experimentalists. Curr Protoc Mol Biol. 2010;Chapter 19 doi: 10.1002/0471142727.mb1910s89. Unit 19.10.1–21. [DOI] [PMC free article] [PubMed] [Google Scholar]
- Bonilla C, Panguluri RK, Taliaferro-Smith L, et al. (22 co-authors) Agouti-related protein promoter variant associated with leanness and decreased risk for diabetes in West Africans. Int J Obes (Lond). 2006;30:715–721. doi: 10.1038/sj.ijo.0803047. [DOI] [PubMed] [Google Scholar]
- Bradley RK, Li Xy, Trapnell C, Davidson S, Pachter L, Chu HC, Tonkin LA, Biggin MD, Eisen MB. Binding site turnover produces pervasive quantitative changes in transcription factor binding between closely related Drosophila species. PLoS Biol. 2010;8:e1000343. doi: 10.1371/journal.pbio.1000343. [DOI] [PMC free article] [PubMed] [Google Scholar]
- Carninci P, Sandelin A, Lenhard B, et al. (41 co-authors) Genome-wide analysis of mammalian promoter architecture and evolution. Nat Genet. 2006;38:626–635. doi: 10.1038/ng1789. [DOI] [PubMed] [Google Scholar]
- Clark JM. Novel non-templated nucleotide addition reactions catalyzed by procaryotic and eucaryotic DNA polymerases. Nucleic Acids Res. 1988;16:9677–9686. doi: 10.1093/nar/16.20.9677. [DOI] [PMC free article] [PubMed] [Google Scholar]
- Clark RM, Wagler TN, Quijada P, Doebley J. A distant upstream enhancer at the maize domestication gene tb1 has pleiotropic effects on plant and inflorescent architecture. Nat Genet. 2006;38:594–597. doi: 10.1038/ng1784. [DOI] [PubMed] [Google Scholar]
- Dermitzakis ET, Clark AG. Evolution of transcription factor binding sites in Mammalian gene regulatory regions: conservation and turnover. Mol Biol Evol. 2002;19:1114–1121. doi: 10.1093/oxfordjournals.molbev.a004169. [DOI] [PubMed] [Google Scholar]
- ENCODE. Post-transcriptional processing generates a diversity of 5’-modified long and short RNAs. Nature. 2009;457:1028–1032. doi: 10.1038/nature07759. [DOI] [PMC free article] [PubMed] [Google Scholar]
- Frith MC, Ponjavic J, Fredman D, Kai C, Kawai J, Carninci P, Hayashizaki Y, Sandelin A. Evolutionary turnover of mammalian transcription start sites. Genome Res. 2006;16:713–722. doi: 10.1101/gr.5031006. [DOI] [PMC free article] [PubMed] [Google Scholar]
- Giardine B, Riemer C, Hardison R, et al. (13 co-authors) Galaxy: a platform for interactive large-scale genome analysis. Genome Res. 2005;15:1451–1455. doi: 10.1101/gr.4086505. [DOI] [PMC free article] [PubMed] [Google Scholar]
- Goecks J, Nekrutenko A, Taylor J, Galaxy Team Galaxy: a comprehensive approach for supporting accessible, reproducible, and transparent computational research in the life sciences. Genome Biol. 2010;11:R86. doi: 10.1186/gb-2010-11-8-r86. [DOI] [PMC free article] [PubMed] [Google Scholar]
- Gowda M, Li H, Wang G. Robust analysis of 5′-transcript ends: a high-throughput protocol for characterization of sequence diversity of transcription start sites. Nat Protoc. 2007;2:1622–1632. doi: 10.1038/nprot.2007.242. [DOI] [PubMed] [Google Scholar]
- Harbers M, Carninci P. Tag-based approaches for transcriptome research and genome annotation. Nat Methods. 2005;2:495–502. doi: 10.1038/nmeth768. [DOI] [PubMed] [Google Scholar]
- Harvey RJ, Darlison MG. Random-primed cDNA synthesis facilitates the isolation of multiple 5’-cDNA ends by RACE. Nucleic Acids Res. 1991;19:4002. doi: 10.1093/nar/19.14.4002. [DOI] [PMC free article] [PubMed] [Google Scholar]
- Hoskins RA, Carlson JW, Kennedy C, et al. (14 co-authors) Sequence finishing and mapping of Drosophila melanogaster heterochromatin. Science. 2007;316:1625–1628. doi: 10.1126/science.1139816. [DOI] [PMC free article] [PubMed] [Google Scholar]
- Hoskins RA, Landolin JM, Brown JB, et al. (19 co-authors) Genome-wide analysis of promoter architecture in Drosophila melanogaster. Genome Res. 2011;21:182–192. doi: 10.1101/gr.112466.110. [DOI] [PMC free article] [PubMed] [Google Scholar]
- Hu H, Li X. Transcriptional regulation in eukaryotic ribosomal protein genes. Genomics. 2007;90:421–423. doi: 10.1016/j.ygeno.2007.07.003. [DOI] [PubMed] [Google Scholar]
- Kanamori-Katayama M, Itoh M, Kawaji H, et al. (13 co-authors) Unamplified cap analysis of gene expression on a single-molecule sequencer. Genome Res. 2011;21:1150–1159. doi: 10.1101/gr.115469.110. [DOI] [PMC free article] [PubMed] [Google Scholar]
- Kodzius R, Kojima M, Nishiyori H, et al. (12 co-authors) CAGE: cap analysis of gene expression. Nat Methods. 2006;3:211–222. doi: 10.1038/nmeth0306-211. [DOI] [PubMed] [Google Scholar]
- Li H, Durbin R. Fast and accurate short read alignment with Burrows-Wheeler transform. Bioinformatics. 2009;25:1754–1760. doi: 10.1093/bioinformatics/btp324. [DOI] [PMC free article] [PubMed] [Google Scholar]
- Malherbe Y, Kamping A, van Delden W, van de Zande L. ADH enzyme activity and Adh gene expression in Drosophila melanogaster lines differentially selected for increased alcohol tolerance. J Evol Biol. 2005;18:811–819. doi: 10.1111/j.1420-9101.2004.00877.x. [DOI] [PubMed] [Google Scholar]
- Nickel W, Seedorf M. Unconventional mechanisms of protein transport to the cell surface of eukaryotic cells. Annu Rev Cell Dev Biol. 2008;24:287–308. doi: 10.1146/annurev.cellbio.24.110707.175320. [DOI] [PubMed] [Google Scholar]
- Ni T, Corcoran DL, Rach EA, Song S, Spana EP, Gao Y, Ohler U, Zhu J. A paired-end sequencing strategy to map the complex landscape of transcription initiation. Nat Methods. 2010;7:521–527. doi: 10.1038/nmeth.1464. [DOI] [PMC free article] [PubMed] [Google Scholar]
- Nolte V, Pandey RV, Kofler R, Schlötterer C. Genome-wide patterns of natural variation reveal strong selective sweeps and ongoing genomic conflict in Drosophila mauritiana. Genome Res. 2013;23:99–110. doi: 10.1101/gr.139873.112. [DOI] [PMC free article] [PubMed] [Google Scholar]
- Ogueta M, Cibik O, Eltrop R, Schneider A, Scholz H. The influence of Adh function on ethanol preference and tolerance in adult Drosophila melanogaster. Chem Senses. 2010;35:813–822. doi: 10.1093/chemse/bjq084. [DOI] [PubMed] [Google Scholar]
- Ohler U, Liao GC, Niemann H, Rubin GM. Computational analysis of core promoters in the Drosophila genome. Genome Biol. 2002;3 doi: 10.1186/gb-2002-3-12-research0087. RESEARCH0087. [DOI] [PMC free article] [PubMed] [Google Scholar]
- Ohno S. Evolution by gene duplication. London: George Alien & Unwin Ltd; 1970. [Google Scholar]
- Papaceit M, Orengo D, Juan E. Sequences upstream of the homologous cis-elements of the Adh adult enhancer of Drosophila are required for maximal levels of Adh gene transcription in adults of Scaptodrosophila lebanonensis. Genetics. 2004;167:289–299. doi: 10.1534/genetics.167.1.289. [DOI] [PMC free article] [PubMed] [Google Scholar]
- Park C, Makova K. Coding region structural heterogeneity and turnover of transcription start sites contribute to divergence in expression between duplicate genes. Genome Biol. 2009;10:R10. doi: 10.1186/gb-2009-10-1-r10. [DOI] [PMC free article] [PubMed] [Google Scholar]
- Plessy C, Bertin N, Takahashi H, et al. (24 co-authors) Linking promoters to functional transcripts in small samples with nanoCAGE and CAGEscan. Nat Methods. 2010;7:528–534. doi: 10.1038/nmeth.1470. [DOI] [PMC free article] [PubMed] [Google Scholar]
- Posakony JW, Fischer JA, Maniatis T. Identification of DNA sequences required for the regulation of Drosophila alcohol dehydrogenase gene expression. Cold Spring Harbor Symp Quant Biol. 1985;50:515–520. doi: 10.1101/sqb.1985.050.01.063. [DOI] [PubMed] [Google Scholar]
- Rach EA, Yuan HY, Majoros WH, Tomancak P, Ohler U. Motif composition, conservation and condition-specificity of single and alternative transcription start sites in the Drosophila genome. Genome Biol. 2009;10:R73. doi: 10.1186/gb-2009-10-7-r73. [DOI] [PMC free article] [PubMed] [Google Scholar]
- Salimullah M, Sakai M, Mizuho S, Plessy C, Carninci P. NanoCAGE: a high-resolution technique to discover and interrogate cell transcriptomes. Cold Spring Harb Protoc. 2011;2011 doi: 10.1101/pdb.prot5559. pdb.prot5559. [DOI] [PMC free article] [PubMed] [Google Scholar]
- Sandelin A, Carninci P, Lenhard B, Ponjavic J, Hayashizaki Y, Hume DA. Mammalian RNA polymerase II core promoters: insights from genome-wide studies. Nat Rev Genet. 2007;8:424–436. doi: 10.1038/nrg2026. [DOI] [PubMed] [Google Scholar]
- Shin HD, Winkler C, Stephens JC, et al. (15 co-authors) Genetic restriction of HIV-1 pathogenesis to AIDS by promoter alleles of IL10. Proc Natl Acad Sci U S A. 2000;97:14467–14472. doi: 10.1073/pnas.97.26.14467. [DOI] [PMC free article] [PubMed] [Google Scholar]
- Shiraki T, Kondo S, Katayama S, et al. (17 co-authors) Cap analysis gene expression for high-throughput analysis of transcriptional starting point and identification of promoter usage. Proc Natl Acad Sci U S A. 2003;100:15776–15781. doi: 10.1073/pnas.2136655100. [DOI] [PMC free article] [PubMed] [Google Scholar]
- Sorourian M. Turnover and lineage-specific broadening of the transcription start site in a testis-specific retrogene. Fly. 2010;4:3–11. doi: 10.4161/fly.4.1.11136. [DOI] [PMC free article] [PubMed] [Google Scholar]
- Suzuki Y, Yoshitomo-Nakagawa K, Maruyama K, Suyama A, Sugano S. Construction and characterization of a full length-enriched and a 5’-end-enriched cDNA library. Gene. 1997;200:149–156. doi: 10.1016/s0378-1119(97)00411-3. [DOI] [PubMed] [Google Scholar]
- Wittkopp PJ, Haerum BK, Clark AG. Evolutionary changes in cis and trans gene regulation. Nature. 2004;430:85–88. doi: 10.1038/nature02698. [DOI] [PubMed] [Google Scholar]
- Wray GA. Transcriptional regulation and the evolution of development. Int J Dev Biol. 2003;47:675–684. [PubMed] [Google Scholar]
Associated Data
This section collects any data citations, data availability statements, or supplementary materials included in this article.