Abstract
Estrogens, acting via estrogen receptor (ER) play key roles in growth, differentiation and gene regulation in the reproductive, central nervous and skeletal systems. ER-mediated gene transcription contributes to the development and spread of breast, uterine, and liver cancer. Steroid receptor coactivator-1a (SRC1a) belongs to the P160 family of coactivators, which is the best known of the many coactivators implicated in ER-mediated transactivation. Binding of full-length P160 coactivators to steroid receptors has been difficult to investigate in vitro. This chapter details how to investigate the interaction of SRC1a with ER using the fluorescence anisotropy/polarization microplate assay (FAMA).
Keywords: Estrogen receptor, Steroid receptor coactivator-1a, Fluorescence anisotropy, Microplate, LxxLL motif
1. Introduction
Estrogens regulate the normal growth and differentiation of reproductive tissues, bone and nervous system and play an important role in human pathologies such as osteoporosis and breast, uterine, ovarian liver and lung cancer (1–2). Estrogens, such as 17β-estradiol (E2), execute their genomic actions mainly through estrogen receptor (ER) (3). There are two estrogen receptor isoforms, ERα and ERβ with substantial differences in the N-terminal domain and ligand binding domain (LBD) (4–5). In the classical mechanism of ER action, the ER dimerizes when bound to E2, and the E2-ER complex regulates gene expression by direct binding to estrogen response elements (EREs), or closely related sequences, (6–8). The consensus ERE (cERE) is a perfect palindrome, but most functional EREs are not perfect palindromes (9). For example, the downstream regulatory region of the proteinase inhibitor 9 (PI-9) gene called the estrogen responsive unit (ERU) consists of both an imperfect ERE palindrome and a direct repeat (10). Once bound to an ERE, the ligand binding domain of ER assumes a conformation that enables the recruitment of coactivators (11). Bound coactivators help assemble a multi-protein complex that facilitates both chromatin remodeling and formation of an active transcription complex.
The steroid receptor coactivator (SRC) or p160 family of coactivators, including SRC1/NCoA-1, SRC2/TIF2/GRIP1/NCoA-2 and SRC3/pCIP/ACTR/AIB1 represents a major class of coactivators that play key roles in ER-mediated transcription (12). The p160 coactivators interact with the hydrophobic binding cleft in the ER LBD mainly via highly conserved α-helical Leu-x-x-Leu-Leu (LxxLL) motifs, also called nuclear receptor (NR) boxes (13). All of the SRCs contain a central nuclear receptor-interacting domain (NRID) made up of three NR boxes separated by ~55 amino acids. SRC1a is an alternatively spliced form of SRC1 and contains a fourth NR box at its C-terminus (14).
We developed the fluorescence anisotropy/polarization microplate assay (FAMA) to analyze the interactions of steroid receptors with their DNA recognition sites (15) and with coactivators, such as full length SRC1a (16). In addition FAMA is a facile technology for high throughput screening for small molecule inhibitors of receptor interactions (17–19).
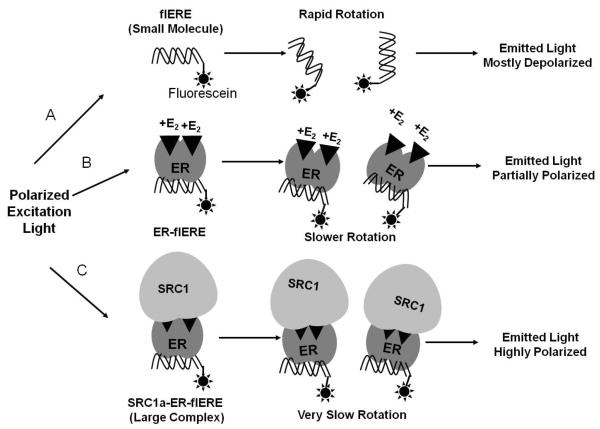
In this assay, ER is pre-bound to a fluorescein-labeled ERE (flERE) in ultra low-volume microplates (16). When polarized light excites the flERE, most of the emitted light is depolarized because of rapid rotational diffusion of the flERE that results in its position being largely randomized at the time of emission. Binding of the ER protein, or of the even larger full-length SRC1a-ER complex, to the flERE slows rotation of the flERE, increasing the possibility that the complex is in the same plane at emission and excitation. These changes can be observed as an increase in fluorescence polarization, or the closely-related parameter, fluorescence anisotropy (detailed in Fig. 1). The coactivator binding assay described here is the most sophisticated application of the FAMA.
Fig. 1.
Schematic of the fluorescence anisotropy/polarization microplate assay (FAMA). Excitation of the flERE with polarized light leads to excitation of only those flERE which have a similar orientation relative to the polarized excitation light. Most of the excited free flERE undergoes rapid random rotational diffusion, resulting in its position being largely randomized at the time of light emission. Therefore, the emitted light is depolarized (A). Binding of the larger ER protein to the flERE creates a high molecular weight complex. This slows rotation of the flERE, increasing the likelihood that the complex will be in the same plane at the time of emission as it was at the time of excitation. Therefore, the emitted light will be more polarized (B). When the large 160 kDa SRC1 binds to the ER-flERE, the even larger complex further slows rotation of the flERE, with the emitted light being highly polarized (C).
2. Material
2.1 flERE preparation
Labeled sense strand: The oligonucleotide was synthesized with fluorescein (specifically: 6-FAM) at its 5' end using phosphoramidite chemistry and PolyPak II- (Glen Research Corp, Sterling, VA, USA) and purified by the Biotechnology Center (University of Illinois). This service is provided in many biotechnology companies. The sequences of the fluorescein (fl)-labeled sense strand of cERE and PI-9 respectively are: 5'-fl-CTAGATTACAGGTCACAGTGACCTTACTCA-3' and 5'-fl-AGATTACACTGGGGGGACCCTGACCTCTAGACTTACGCTGATCACTTCGGTACGCA-3'.
Unlabeled antisense strand: The sequences of the oligonucleotide are complimentary to the sense strand. It can be synthesized by any company providing DNA synthesis services.
TE buffer: 10 mM Tris-HCl (pH 7.5), 1 mM EDTA. Annealing buffer: 100 mM NaCl in TE buffer.
2.2 Protein and peptide
Full-length FLAG-epitope-tagged human ERα and FLAG-epitope-tagged human ERβ were expressed in the presence of 200 nM E2, purified in the presence of 20 nM E2 and quantitated as described (20). Aliquots of ER are stored at −80 C. ER can be thawed and flash frozen with liquid nitrogen once.
Full-length FLAG-epitope-tagged human SRC1a was purified as described (21). Aliquots of SRC1a are stored at −80 C. Use a fresh tube each time for optimal results. Used SRC1a flash frozen in liquid nitrogen exhibits slightly lower binding activity.
Peptides: The nuclear receptor interaction box 2 (NR-2) and box 4 (NR-4) peptides of SRC1 were synthesized by Abgent (San Diego, CA, USA). The amino acid sequences of the NR box peptides are as follows: SRC1 NR Box 2, LTERHKILHRLLQE; SRC1 NR Box 4, QAQQKSLLQQLLTE. Weigh ~1 mg of peptide and dissolve in H2O to prepare a 10 mM stock solution. Seal the rest of the peptide in its original tube with Parafilm and store at −80 C. Aliquot the 10 mM peptide and store at −80 C. The aliquots can be thawed several times and re-frozen using liquid nitrogen.
2.3 Fluorescence anisotropy microplate assay
ER dilution buffer: 20 mM Tris-HCl (pH 7.9), 300 mM KCl, 20% Glycerol, 0.5 μg/μl BSA, 0.2 mM EDTA, 1 μM E2.
SRC1 dilution buffer: 20 mM Tris-HCl (pH 7.5), 100 mM NaCl, 15% Glycerol, 0.5 μg/μl BSA.
FAMA buffer: 30 mM Tris-HCl (pH 7.5), 300 mM KCl, 10% Glycerol, 0.1% NP-40, 2 mM DTT, 0.2 ng/μl poly-dI:dC, 200 nM E2. The KCl and glycerol in the FAMA buffer should be adjusted to corresponding to the salt (KCl and NaCl) and glycerol brought in by the added SRC1a and ER dilution buffer so the final concentrations of salt and glycerol in each assay are 150 nM and 5%, respectively.
We use black 96-well low volume, high efficiency HE microplates (Molecular Devices Corp., Sunnyvale, CA).
A plate-reader that can perform fluorescence anisotropy/polarization measurements in small volumes is required. The PHERAStar plate-reader (BMG Labtech) was used for the experiments described.
3. Methods
3.1 flERE preparation
A260 values were measured to calculate the oligonucleotide concentration.
The fluorescein-labeled sense strand was annealed with an equimolar concentration of the unlabeled antisense strand. Add the fluorescein-labeled sense strand to an equimolar concentration of the unlabeled antisense strand in annealing buffer to a final concentration of 1 μM each in a tube. Wrap the tube with aluminum foil.
Boil 400 ml of water in a large glass beaker on a hotplate and incubate the tube of oligonucleotides in the boiling water for 5 minutes.
Turn off the hotplate, leaving the oligonucleotides in the beaker on the hotplate to slowly cool to room temperature.
Aliquot the 1 μM flERE stock, keep it in the dark and store at −20 C. Avoid multiple freeze-thaw cycles. The flERE can be stored at 4 C for a few weeks.
3.2. ER-flcERE Binding curves
Dilute the fluorescein-labeled double stranded cERE (flcERE) to 20 nM with TE buffer. The final volume of each assay in a 96-well microplate well will be 20 μl, containing 10 μl FAMA buffer, 7 μl H2O, 1 μl flcERE and 2 μl ER. Combine H2O, FAMA buffer and 20 nM flcERE in proportion. The final concentration of flcERE in a 20 μl assay is 1 nM.
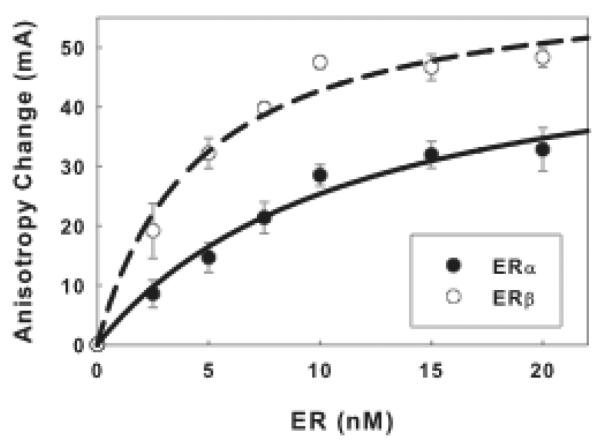
Dilute ER protein with ER dilution buffer to 10X the desired final concentrations. In the binding curves we show (Fig. 2); 200, 150, 100, 75, 50 and 25 nM ER stocks were used to achieve final ER concentrations of 20, 15, 10, 7.5, 5 and 2.5 nM. The tubes and dilution buffer should be pre-chilled and the diluted ER should remain on ice.
Add 18 μl of the complete assay mix (minus ER) prepared in step 1 to each well in a microplate.
Then add 2 μl of ER generated in step 2 into each well prepared in step 3. Mix by pippetting (Note 1). In the control (ER concentration is 0), add 2 μl ER dilution buffer instead. 3 wells are assayed at each concentration.
Cover the microplate and incubate in the dark at room temperature for 15 minutes. Take off the cover and measure anisotropy with a plate-reader (Note 2). The excitation and emission wavelengths are 485 nM and 535 nM respectively. The signal will not change significantly for at least an hour when the plate is covered and stored in the dark at room temperature.
Anisotropy changes resulting from ER binding are calculated by subtracting the average anisotropy values measured for flcERE alone, without added ER, from the value measured for each flcERE-ER reaction. Plot anisotropy changes vs. ER concentration and fit binding curves through the data points (Fig. 2). The Kd values of ERα and ERβ binding to flcERE are ~5 nM and ~3 nM, respectively. A concentration of ER (15 nM) that approaches saturated binding was used in the SRC1a-ER binding assays.
Fig. 2.
Binding curves of ERα and ERβ to the flcERE.
3.3 SRC1a binding to the ER-flcERE
Dilute the flcERE to 20 nM with TE buffer. Dilute the ER to 150 nM with ER dilution buffer (Note 3). The final volume of each assay in a microplate well will be 20 μl, containing 10 μl FAMA buffer, 5 μl H2O, 1 μl flcERE, 2 μl ER, and 2 μl SRC1a. Combine H2O, FAMA buffer, 20 nM flcERE and 150 nM ER in proportion. The final concentrations of flcERE and ER in a 20 μl assay are 1 nM and 15 nM respectively. Add 18 μl of the combined solution to each well in a microplate. Cover the microplate and incubate in the dark at room temperature for 15–30 minutes to enable ER-flcERE complex to form. Measure anisotropy with the plate-reader to ensure the anisotropy values in all wells are similar. If any well appears very different than others, do not use that well in step 3.
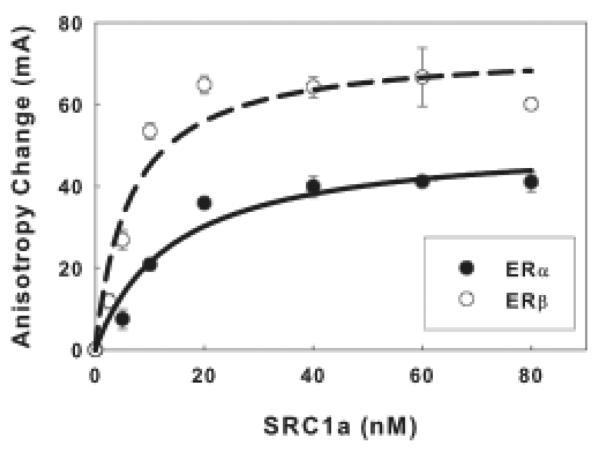
While incubating the plate, dilute SRC1a protein with SRC1 dilution buffer to 10 fold higher than the desired final concentrations. In the binding curves we show (Fig. 3); 800, 600, 400, 200, 100, 50 and 25 nM SRC1a stocks were used to achieve final concentrations 80, 60, 40, 20, 10, 5 and 2.5 nM. The tubes and dilution buffer should be pre-chilled and the diluted SRC1a should remain on ice.
Add 2 μl SRC1a prepared in step 2 into each well prepared in step 1. Mix by pipetting (Note 1). In the control, there is no SRC1a and 2 μl SRC1 dilution buffer is added instead. 3 wells are assayed at each concentration.
Cover the microplate and incubate in the dark at room temperature for 10–20 minutes. Take off the cover and measure the anisotropy with a plate-reader (Note 2).
Anisotropy changes resulting from SRC1a binding are calculated by subtracting the average anisotropy values measured for ER-flcERE complex, with no added SRC1a, from the value measured for the SRC1a-ER-flcERE reactions. Plot anisotropy changes vs. SRC1a concentration and fit binding curves through the data points (Fig. 3). Robust binding curves can be obtained with FAMA. The apparent Kd values for binding of full-length SRC1a to the ERα-flcERE and ERβ-flcERE complexes were ~14 nM and ~6 nM respectively, indicating that full-length SRC1a interacts with ER-flcERE complex with very high affinity. An SRC1a concentration that results in 70–90% maximum binding was used in competition assays and kinetic assays.
Fig. 3.
Binding of full-length SRC1a to ERα-flcERE and ERβ-flcERE complexes.
3.4 Competition assays
Dilute the flcERE to 20 nM with TE buffer. Dilute the ER with ER dilution buffer to 150 nM (Note 3). The final volume of each assay in a microplate well will be 20 μl, containing 10 μl FAMA buffer, 3 μl H2O, 1 μl flcERE, 2 μl ER, 2 μl peptide and 2 μl SRC1a. Combine H2O, FAMA buffer, 20 nM flcERE and 150 nM ER in proportion. The final concentrations of flcERE and ER in a 20 μl assay are 1 nM and 15 nM, respectively. Add 16 μl of the combined solution to each well in a microplate. Cover the microplate and incubate in the dark at room temperature for 15–20 minutes to enable the ER-flcERE complex to form.
We used NR boxes 2 and 4 in the binding studies because previous studies suggested binding to ER is mediated primarily through these peptides (22). While incubating the plate, dilute the NR box peptide with H2O to 10 fold higher than the desired final concentrations. Add 2 μl of the peptide into each wells generated in step 1. Mix by pipetting (Note 1). 3 wells are assayed at each concentration. Cover the microplate and incubate in the dark at room temperature for 15–20 minutes to the enable the peptide-ER-flcERE complex to form. Take off the cover and measure anisotropy with a plate-reader (Note 2).
While performing the incubation in step 2, dilute SRC1a with SRC1 dilution buffer to 250 nM (Note 3). Add 2 μl SRC1a into each well prepared in step 2 so the final assay concentration is 25 nM. Mix by pipetting (Note 1). Cover the microplate and incubate in the dark at room temperature for 15–20 minutes. Take off the cover and measure anisotropy with a plate-reader (Note 2). Anisotropy can be measured several times at ~5 minutes intervals to ensure equilibrium is reached. Between each measurement, the plate should be covered and kept in the dark.
-
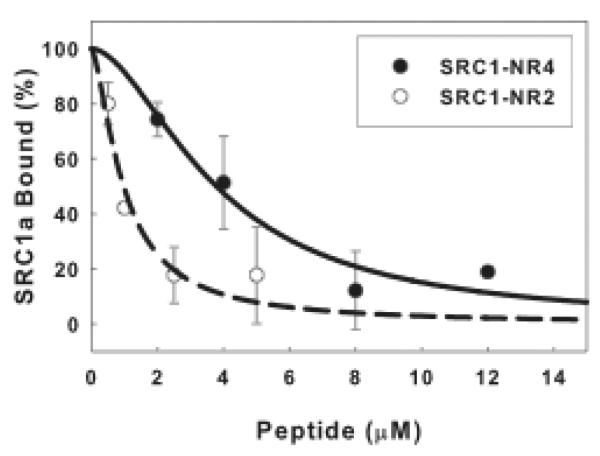
Anisotropy changes are calculated by subtracting the anisotropy values measured before SRC1a addition from the value measured after SRC1a addition. The average anisotropy changes for binding of SRC1a to the ERα-flcERE complex in the absence of added peptide is the maximum anisotropy change and defined as 100% bound. % SRC1a bound = (Anisotropy Change/Max Anisotropy Change) * 100. Plot % SRC1a bound vs. peptide concentration and fit binding curves through the data points (Fig. 4). The concentrations of peptide required to inhibit SRC1a binding to ERα-flcERE by 50% (the IC50) were ~1.0 and ~3.8 μM for the SRC1a NR box 2 and NR box 4 peptides respectively. Since it requires μM NR box peptides to compete with 25 nM full-length SRC1a for binding to ER-flcERE, the LxxLL containing peptides exhibit much lower affinity than the full-length SRC1a.
Small molecules can be used instead of peptides. Competition FAMA can be used to study the ability of a small molecule to inhibit binding of SRC1a to ER.
Fig. 4.
NR box peptides compete for full-length SRC1a interaction with ERα-flcERE.
3.5 Binding kinetics of SRC1a
Dilute the flcERE to 20 nM with TE buffer. Dilute the ER with ER dilution buffer to 150 nM (Note 3). The final volume of each assay in a microplate well will be 20 μl, containing 10 μl FAMA buffer, 5 μl H2O, 1 μl flcERE, 2 μl ER, and 2 μl SRC1a. Combine H2O, FAMA buffer, 20 nM flcERE and 150 nM ER in proportion. The final concentrations of flcERE and ER in a 20 μl assay are 1 nM and 15 nM respectively. Incubate the combined solution in the dark at room temperature for 15–30 minutes to allow formation of the ER-flcERE complex.
While incubating the plate, dilute SRC1a with SRC1 dilution buffer to 150 nM (Note 3). The tubes and dilution buffer should be pre-chilled and the diluted SRC1a should remain on ice.
Add 18 μl in one well of the microplate, measure anisotropy of this well with the plate-reader. With the plate is still in the drawer of the plate-reader, add 2 μl SRC1a and quickly mix by pipetting up-and-down once (Note 1). Using a kinetic mode, read the anisotropy immediately every 2 seconds over 5 minutes (Note 4).
Repeat step 3 for each well and measure for at least 4 assays. Increase the number of assays needed depending on the quality of the experimental data.
-
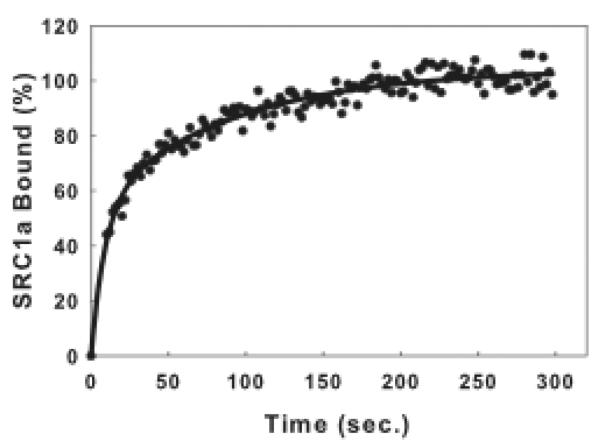
Anisotropy changes are calculated by subtracting the average anisotropy values measured at time 0 (before SRC1a addition) from the value measured at time (t). The anisotropy change when binding reached a plateau at equilibrium is the maximum anisotropy change and is set equal to 100% bound. %SRC1a bound = (Anisotropy Change (time=t)/Max Anisotropy Change (time=0))* 100. Plot % SRC1a bound vs. time (Fig. 5). In this figure ERα is used. Binding of SRC1a to ERα-flcERE complex is extremely rapid with half time of 15–20 sec. The binding reaches equilibrium with 5 minutes.
Similar experiments can be used to measure dissociation of SRC1a from ER-flcERE complex.
Fig. 5.
SRC1a binds rapidly to ERα-flcERE complex.
3.6 Bridging effect
This experiments tests the ability of SRC1a to bridge, or link, two ER dimers bound at a complex DNA binding site. Linking the two DNA-bound ER dimers will increase the stability of the ERDNA complex.
Perform an experiment to measure binding of ERα to the fl-PI-9 ERU as described in 3.2 for the cERE. The suggested ERα final concentrations are 400, 200, 150, 100, 50 and 25 nM since ER has much lower affinity for the PI-9 ERU than for the cERE. The Kd for binding of ERα to the fl-PI-9 ERU is ~166 nM (data not shown). The maximum anisotropy change for ERα binding to the fl-PI-9 ERU is ~90 mA, which is much higher than is seen for ERα binding to the flcERE. This is reasonable since the PI-9 ERU contains two ER binding sites, and the final complex formed includes two ERα dimers (9). Binding of 50 nM ERα to the fl-PI-9 ERU results in an anisotropy change of only ~10 mA, while binding of 2.5 nM ERα to the flcERE gives similar change as shown in Fig. 2. To test the bridging effects of SRC1a on ERα binding to the PI-9 ERU, compared to the cERE, 50 and 2.5 nM ERα are used for the fl-PI-9 ERU and flcERE respectively.
Dilute the flcERE and the fl-PI-9 ERU to 20 nM with TE buffer. The final volume of each assay in a microplate well will be 20 μl, containing 10 μl FAMA buffer, 5 μl H2O, 1 μl flERE, 2 μl ER, and 2 μl SRC1a. Combine H2O, FAMA buffer, 20 nM flERE in proportion. Use separate tubes for flcERE and fl-PI-9 ERU. Add 16 μl combined solution to each well in a microplate. 9 wells for flcERE and 9 wells for fl-PI-9 ERU will be used.
Dilute the ER with ER dilution buffer to 25 and 500 nM (Note 3). Add 2 μl ER dilution buffer to wells 1–3 for both flEREs. Then add 2 μl 25 nM ER to wells 4–9 containing flcERE and 2 μl 500 nM ER to wells 4–9 containing fl-PI-9 ERU. Mix by pipetting (Note 1). Cover the microplate and incubate in dark at room temperature for 30 minutes to enable formation of the ER-flERE complex.
While incubating the plate, dilute SRC1a protein with SRC1 dilution buffer to 400 nM. The tubes and dilution buffer should be pre-chilled and the diluted SRC1a should remain on ice.
Add 2 μl SRC1a dilution buffer to wells 1–6 for both flEREs. Then add 2 μl 400 nM SRC1a to wells 7–9 for both flEREs. Mix by pipetting (Note 1). Cover the microplate and incubate in the dark at room temperature for 10–20 minutes. Take off the cover and measure anisotropy with a plate-reader (Note 2).
For flcERE, the anisotropy units of SRC1a-ERα-flERE, ERα-flERE and flERE alone are 46, 53, 59 mA, respectively (Fig. 6). For fl-PI-9 ERU, the anisotropy units of SRC1a-ERα-flERE, ERα-flERE and flERE alone are 42, 58, 122 mA, respectively (Fig. 6). The very small anisotropy increase resulting from ERα binding (7 mA for flcERE and 16 mA for fl-PI-9 ERU) indicates that at a low concentration of ERα, only a very small fraction of the ER is bound to the flERE. When SRC1a is added, the minimal anisotropy increases (6 mA) with flcERE indicates the amount of ERα bound to the flcERE is still limited. The addition of SRC1a dramatically increases the anisotropy (by 64 mA) for the complex with the fl-PI-9 ERU. The results imply that SRC1a binding to the ERα-PI-9 ERU complex dramatically increased the affinity of the two ER dimers for the two binding sites of the PI-9 ERU. This likely involves bridging the two ER dimers with different LxxLL motifs so the larger complex helps to stabilize ER dimer on the low affinity binding sites.
Fig. 6.
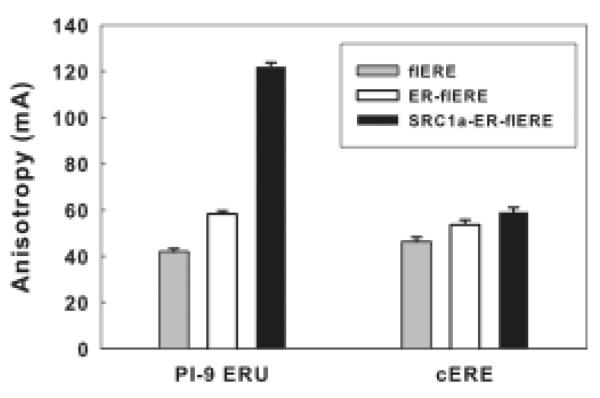
Full-length SRC1a increases ERα binding to the PI-9 ERU but not to the cERE.
Footnotes
Avoid generating bubbles when mixing the samples in the microplate. Bubbles can alter the readings.
Many fluorescence polarization/anisotropy plate readers lack the sensitivity required to accurately measure polarization in small 10–20 μl volumes. If the plate-reader does not directly show anisotropy as a read-out, the anisotropy can be calculated from the raw data using the formula: FA= (I//−I⊥)/ (I//+2I⊥), where I// and I⊥ are the emission light intensity (I) in the parallel (//) and perpendicular (⊥) directions to the excitation light, respectively. Although outcomes were independent of the instrument, gain settings vary widely between instruments; therefore the magnitude of the anisotropy change can vary significantly in experiments performed using different plate readers.
The activities of different batches of purified protein may vary. It is best to determine the actual concentration needed by generating a binding curve.
The time lag between SRC1a addition and the reading of the first data point is likely to be 5–15 seconds, and depends on the speed with which the microplate reader can move a microplate into place and begin reading it. A timer can be used to count. The time intervals between each reading may be limited by the plate-reader and can be more than 2 seconds. In that case just choose the fastest mode available.
References
- 1.Luconi M, Forti G, Baldi E. Genomic and nongenomic effects of estrogens: molecular mechanisms of action and clinical implications for male reproduction. J Steroid Biochem Mol Biol. 2002;80:369–381. doi: 10.1016/s0960-0760(02)00041-9. [DOI] [PubMed] [Google Scholar]
- 2.Katzenellenbogen BS, Katzenellenbogen JA. Estrogen receptor transcription and transactivation: Estrogen receptor alpha and estrogen receptor beta: regulation by selective estrogen receptor modulators and importance in breast cancer. Breast Cancer Res. 2000;2:335–344. doi: 10.1186/bcr78. [DOI] [PMC free article] [PubMed] [Google Scholar]
- 3.Tsai MJ, O'Malley BW. Molecular mechanisms of action of steroid/thyroid receptor superfamily members. Annu Rev Biochem. 1994;63:451–486. doi: 10.1146/annurev.bi.63.070194.002315. [DOI] [PubMed] [Google Scholar]
- 4.Evans RM. The steroid and thyroid hormone receptor superfamily. Science. 1988;240:889–895. doi: 10.1126/science.3283939. [DOI] [PMC free article] [PubMed] [Google Scholar]
- 5.Mosselman S, Polman J, Dijkema R. ER beta: identification and characterization of a novel human estrogen receptor. FEBS Lett. 1996;392:49–53. doi: 10.1016/0014-5793(96)00782-x. [DOI] [PubMed] [Google Scholar]
- 6.Carroll JS, Brown M. Estrogen receptor target gene: an evolving concept. Mol Endocrinol. 2006;20:1707–1714. doi: 10.1210/me.2005-0334. [DOI] [PubMed] [Google Scholar]
- 7.Carroll JS, Liu XS, Brodsky AS, Li W, Meyer CA, Szary AJ, Eeckhoute J, Shao W, Hestermann EV, Geistlinger TR, Fox EA, Silver PA, Brown M. Chromosome-wide mapping of estrogen receptor binding reveals long-range regulation requiring the forkhead protein FoxA1. Cell. 2005;122:33–43. doi: 10.1016/j.cell.2005.05.008. [DOI] [PubMed] [Google Scholar]
- 8.O'Lone R, Frith MC, Karlsson EK, Hansen U. Genomic targets of nuclear estrogen receptors. Mol Endocrinol. 2004;18:1859–1875. doi: 10.1210/me.2003-0044. [DOI] [PubMed] [Google Scholar]
- 9.Klinge CM, Jernigan SC, Smith SL, Tyulmenkov VV, Kulakosky PC. Estrogen response element sequence impacts the conformation and transcriptional activity of estrogen receptor alpha. Mol Cell Endocrinol. 2001;174:151–166. doi: 10.1016/s0303-7207(01)00382-3. [DOI] [PubMed] [Google Scholar]
- 10.Krieg SA, Krieg AJ, Shapiro DJ. A unique downstream estrogen responsive unit mediates estrogen induction of proteinase inhibitor-9, a cellular inhibitor of IL-1beta- converting enzyme (caspase 1) Mol Endocrinol. 2001;15:1971–1982. doi: 10.1210/mend.15.11.0719. [DOI] [PubMed] [Google Scholar]
- 11.Glass CK, Rosenfeld MG. The coregulator exchange in transcriptional functions of nuclear receptors. Genes Dev. 2000;14:121–141. [PubMed] [Google Scholar]
- 12.Xu J, O'Malley BW. Molecular mechanisms and cellular biology of the steroid receptor coactivator (SRC) family in steroid receptor function. Rev Endocr Metab Disord. 2002;3:185–192. doi: 10.1023/a:1020016208071. [DOI] [PubMed] [Google Scholar]
- 13.Spiegelman BM, Heinrich R. Biological control through regulated transcriptional coactivators. Cell. 2004;119:157–167. doi: 10.1016/j.cell.2004.09.037. [DOI] [PubMed] [Google Scholar]
- 14.Kalkhoven E, Valentine JE, Heery DM, Parker MG. Isoforms of steroid receptor co-activator 1 differ in their ability to potentiate transcription by the oestrogen receptor. EMBO J. 1998;17:232–243. doi: 10.1093/emboj/17.1.232. [DOI] [PMC free article] [PubMed] [Google Scholar]
- 15.Wang SY, Ahn BS, Harris R, Nordeen SK, Shapiro DJ. Fluorescence anisotropy microplate assay for analysis of steroid receptor-DNA interactions. Biotechniques. 2004;37:807–808. 810–807. doi: 10.2144/04375RR01. [DOI] [PubMed] [Google Scholar]
- 16.Wang S, Zhang C, Nordeen SK, Shapiro DJ. In vitro fluorescence anisotropy analysis of the interaction of full-length SRC1a with estrogen receptors alpha and beta supports an active displacement model for coregulator utilization. J Biol Chem. 2007;282:2765–2775. doi: 10.1074/jbc.M607531200. [DOI] [PubMed] [Google Scholar]
- 17.Mao C, Patterson NM, Cherian MT, Aninye IO, Zhang C, Montoya JB, Cheng J, Putt KS, Hergenrother PJ, Wilson EM, Nardulli AM, Nordeen SK, Shapiro DJ. A new small molecule inhibitor of estrogen receptor alpha binding to estrogen response elements blocks estrogen-dependent growth of cancer cells. J Biol Chem. 2008;283:12819–12830. doi: 10.1074/jbc.M709936200. [DOI] [PMC free article] [PubMed] [Google Scholar]
- 18.Kretzer NM, Cherian MT, Mao CJ, Aninye IO, Reynolds PD, Schiff R, Hergenrother PJ, Nordeen SK, Wilson EM, Shapiro DJ. A Noncompetitive Small Molecule Inhibitor of Estrogen-regulated Gene Expression and Breast Cancer Cell Growth That Enhances Proteasome-dependent Degradation of Estrogen Receptor alpha. Journal of Biological Chemistry. 2010;285:41863–41873. doi: 10.1074/jbc.M110.183723. [DOI] [PMC free article] [PubMed] [Google Scholar]
- 19.Shapiro DJ, Mao CJ, Cherian MT. Small Molecule Inhibitors as Probes for Estrogen and Androgen Receptor Action. Journal of Biological Chemistry. 2011;286:4043–4048. doi: 10.1074/jbc.R110.203026. [DOI] [PMC free article] [PubMed] [Google Scholar]
- 20.Zhang CC, Krieg S, Shapiro DJ. HMG-1 stimulates estrogen response element binding by estrogen receptor from stably transfected HeLa cells. Mol Endocrinol. 1999;13:632–643. doi: 10.1210/mend.13.4.0264. [DOI] [PubMed] [Google Scholar]
- 21.Thackray VG, Nordeen SK. High-yield purification of functional, full-length steroid receptor coactivator 1 expressed in insect cells. Biotechniques. 2002;32:260, 262–263. doi: 10.2144/02322bm05. [DOI] [PubMed] [Google Scholar]
- 22.Bramlett KS, Wu Y, Burris TP. Ligands specify coactivator nuclear receptor (NR) box affinity for estrogen receptor subtypes. Mol Endocrinol. 2001;15:909–922. doi: 10.1210/mend.15.6.0649. [DOI] [PubMed] [Google Scholar]


