

Abstract
Background
Persons with HIV infection have been reported to develop age-related diseases at younger ages than those without HIV. Whether this finding is related to HIV infection or failure to control for other risk factors is unknown.
Objective
To investigate whether persons with HIV infection develop hepatitis C virus (HCV)–related liver disease at younger ages than similar persons without HIV.
Design
Comparison of the severity of liver fibrosis by age among persons who have HCV with and without HIV followed concurrently in the same protocol.
Setting
Observational cohort from Baltimore, Maryland, participating in the ALIVE (AIDS Linked to the IntraVenous Experience) study.
Participants
1176 current and former injection drug users with antibodies to HCV.
Measurements
Liver fibrosis assessed semiannually from 2006 to 2011 by elastography (FibroScan, Echosens, Paris, France) and using previously validated thresholds for clinically significant fibrosis and cirrhosis; concurrent assessment of medical history, alcohol and illicit drug use, HCV RNA levels, hepatitis B virus surface antigen level, body mass index, and (for those with HIV) CD4+ lymphocyte count and HIV RNA levels.
Results
Among 1176 participants with antibodies to HCV, the median age was 49 years and 34% were coinfected with HIV and HCV. Participants contributed 5634 valid liver fibrosis measurements. The prevalence of clinically significant fibrosis without cirrhosis (12.9% vs. 9.5%) and of cirrhosis (19.5% vs. 11.0%) was greater in persons coinfected with HIV and HCV than in those with only HCV (P < 0.001). Increasing age and HIV infection were independently associated with liver fibrosis, as were daily alcohol use, chronic hepatitis B virus infection, body mass index greater than 25 kg/m2, and greater plasma HCV RNA levels. When these factors were kept constant, persons with HIV had liver fibrosis measurements equal to those of persons without HIV, who were, on average, 9.2 years older.
Limitation
The process of liver fibrosis began before the study in most persons.
Conclusion
In this cohort, persons who have HCV with HIV have liver fibrosis stages similar to those without HIV who are nearly a decade older.
Even when treated with antiretroviral therapy (ART), persons with HIV are more likely to develop or die of cardiovascular disease, liver disease, and some forms of cancer than are those without HIV of similar age and sex (1–3). Because the incidence rates of these conditions increase with age, an explanation of these findings is that HIV accelerates the biological effects of aging. The observations that both HIV infection and aging are associated with accelerated thymic atrophy, immunosenescence, and increased susceptibility to infections support this hypothesis (4–6). On the other hand, the increased risk for such conditions as cardiovascular and liver disease associated with HIV may merely reflect greater exposure to tobacco, alcohol, viral hepatitis, or illicit drugs, which themselves could be responsible for the observed elevated disease risk (3, 7, 8). Differences in the underlying age structure between younger populations with HIV infection and the general population at risk for these chronic diseases could also explain the age disparity (3). Because studies have lacked appropriate control participants without HIV; data on confounding exposures; or structured, valid disease assessments, it has not been possible to answer this question conclusively.
To investigate whether HIV reduces the age at which liver disease occurs and understand other correlates of liver fibrosis in this setting, we studied a cohort of persons with hepatitis C virus (HCV) in whom liver fibrosis, HIV disease, and other key exposures have been systematically monitored since 2006.
Methods
Study Population
The ALIVE (AIDS Linked to the IntraVenous Experience) study (9) is a prospective, community-recruited observational cohort of current and former injection drug users followed outside clinical treatment settings in Baltimore, Maryland. Enrollment of persons older than 17 years with a history of injection drug use began in 1988, with subsequent recruitments in 1994 to 1995, 1998, 2000, and 2005 to 2008. Participants with and without HIV are followed under a common protocol involving biannual visits with interview, clinical examination, and bio-specimen collection. Eligibility for the present study included having HCV antibodies and at least 1 valid liver fibrosis assessment by transient elastography (FibroScan, Echosens, Paris, France). All participants provided written informed consent, and the study was approved by the Johns Hopkins University Institutional Review Board.
Cohort Measurements
At the baseline visit and each 6-month follow-up visit, risk behavior information was collected using audio computer-assisted self-interview, medical history was reviewed through standardized interview, and selected clinical measures were done. Routine laboratory testing at each visit included HIV serologic testing for participants without HIV and T-cell subsets and HIV RNA level measurements (COBAS AmpliPrep/COBAS Taqman HIV-1 Monitor test, version 2, Roche Diagnostics, Indianapolis, Indiana) for those with HIV. Blood chemistries and complete blood counts were done in a commercial laboratory.
Antibodies to HCV and the hepatitis B virus (HBV) surface antigen (HBsAg) were detected in serum collected at the first available visit on each participant (10). Hepatitis C virus RNA testing was done on plasma collected at or near the time of the initial liver stiffness measurement using the Abbott RealTime HCV assay (Abbott Molecular, Des Plaines, Illinois) (11).
Liver Fibrosis Measurement
Unless otherwise specified, “liver fibrosis” was defined as liver stiffness determined at semiannual study visits by transient elastography with use of a FibroScan machine, as previously validated in our cohort (12, 13). Pulse-echo ultrasonography acquisitions measure the velocity of a shear wave propagated through the liver. Results are instantaneously received as a single, quantitative variable of liver stiffness measurement, reported in kilopascals (kPa). All elastographies were done by certified operators trained by the manufacturer with use of a single device in the research clinic. Examinations with 8 discrete, validated measurements; a success rate greater than 60% (number of validated measurements divided by the total number of measurements); and limited variability (interquartile range [IQR] of measures divided by the median value <0.30) were considered valid (a minor modification of 10 discrete measures recommended by the manufacturer) (12). The median value from each valid examination was used for analysis.
Statistical Analysis
Although cohort members may have been followed before liver fibrosis testing, we defined “baseline” as the visit with the first valid liver fibrosis measurement after routine implementation in 2006. Unless otherwise specified, information on potential determinants of liver fibrosis referred to this visit or exposures reported in the previous 6 months. Hepatitis C virus RNA levels were log10-transformed and grouped as less than 2.8 log10 IU/mL (viral clearance), 2.8 to 5 log10 IU/mL (low), 5 to 6 log10 IU/mL (expected), and greater than 6 log10 IU/mL (high). Previous studies in this cohort show that these thresholds correspond with either discrete conditions (for example, viral clearance) or extremes of viral replication (10, 14). Based on cumulative self-reported data, alcohol use was dichotomized into time-updated groups: Participants who at any study visit reported “daily” use in the previous 6 months and those who never reported using alcohol daily. HIV status was considered as seropositive or seronegative; participants who were HIV-seropositive were further classified according to HIV RNA levels or CD4 lymphocyte counts. An HIV RNA level of 2.6 log10 copies/mL was considered to be the threshold of detection.
The distribution of elastography results was analyzed, and then linear regression of nontransformed fibrosis scores was analyzed in γ models using the log-link function (log γ models). The intraperson correlation of repeated measurements was accounted for by using generalized estimating equations assuming an exchangeable correlation structure, based on detailed exploration of the data (15). Various functional forms of age were considered (polynomial with squared term, log-transformed), but none was significant beyond the linear term. Therefore, age was included as a continuous, time-updated covariate. We further evaluated both the cross-sectional association of age at baseline visit and the longitudinal association of increasing age during follow-up (age at time of elastography minus age at baseline visit). Interactions of age variables and HIV were assessed. Analyses considered potential confounders, including race, sex, and HBV status (which were fixed at the baseline visit); illicit drug, alcohol, and tobacco use; body mass index (BMI); and HIV disease markers (which were time-updated at every visit). To illustrate the relationship between age, HIV, and liver fibrosis, we calculated expected liver fibrosis values by using the regression equation for the final multivariable model for the age range of a representative study participant (that is, an overweight black man who has never reported regular alcohol use, is HBsAg-negative, and has an HCV RNA level >6 log10 IU/mL). Then, for each predicted value of liver fibrosis for a specific person with HIV at age α1, we calculated the corresponding age, α0, for a similar person without HIV with equal liver fibrosis stage, based on the following equation.
The 90% coverage limit for this parameter ratio was calculated by drawing a sample of 10 000 from the bivariate normal asymptotic distribution of the 2 parameter estimates. Analyses were conducted in SAS, version 9 (SAS Institute, Cary, North Carolina), or STATA, version 12 (StataCorp, College Station, Texas).
Results
From February 2006 (when liver fibrosis assessments began) to March 2011, 1475 persons with HCV antibodies had at least 1 study visit. A total of 215 participants never had a liver fibrosis measurement, chiefly because their only visit was at enrollment and liver stage was not included in enrollment visit assessments (median number of study visits was 1 among the 215 compared with 7 among those with a fibrosis measurement; P < 0.001). Of the 1260 participants who had at least 1 liver fibrosis measurement, 1176 (93%) had at least 1 valid result obtained (Table 1). Invalid liver fibrosis results were associated with greater BMI, which was a median of 33 kg/m2 among those with invalid results compared with 25 kg/m2 among those with valid results (P < 0.001). Among the 1176 with at least 1 valid liver fibrosis measurement, the baseline median age was 49 years, 85% were black, 32% were women, and 34% were coinfected with HIV and HCV.
Table 1.
Demographic, Behavioral, and Clinical Characteristics of Participants
| Characteristic* | Participants With Valid Liver Fibrosis Measures (n = 1176) | Participants Without Valid Liver Fibrosis Measures (n = 84) |
|---|---|---|
| Median study visits (IQR), n | 7 (4–10) | 3 (2–8) |
| Median age (IQR), y | 49 (43–53) | 47 (42–54) |
| Women, n (%) | 371 (32) | 47 (56) |
| Black, n (%) | 997 (85) | 69 (82) |
| Median BMI (IQR), kg/m2 | 25 (22–28) | 33 (28–42) |
| Injection drug use, n (%) | ||
| None | 554 (47) | 38 (45) |
| Less than daily | 264 (22) | 24 (29) |
| Daily or more | 356 (30) | 22 (26) |
| Ever used alcohol daily, n (%)† | 412 (35) | 23 (27) |
| Median ALT level (IQR), IU/L | 32 (20–52) | 29 (21–45) |
| HCV RNA level (IQR), log10 IU/mL‡ | 6.08 (5.08–6.58) | 5.49 (ND–6.50) |
| HIV infection, n (%) | 394 (34) | 24 (29) |
| Median CD4 count (IQR), × 109 cells/L | 0.287 (0.148–0.458) | 0.257 (0.178–0.512) |
| Median nadir CD4 count (IQR), × 109 cells/L | 0.175 (0.075–0.282) | 0.258 (0.164–0.420) |
| Median HIV RNA level (IQR), log10 copies/mL | 3.0 (<2.6–4.5) | 2.6 (<2.6–4.0) |
ALT = alanine aminotransferase; BMI = body mass index; HCV = hepatitis C virus; IQR = interquartile range; ND = not detected.
Data refer to measurement at the baseline visit or the ptevious 6-mo period. Baseline visit was defined as the first visit with valid liver fibrosis measurement or, for those with no valid liver fibrosis measurement, the first visit after February 2006 when FibroScan (Echosens, Paris, France) was incorporated into the ALIVE (AIDS Linked to the IntraVenous Experience) study protocol.
Indicates self-reported use during cumulative study visits before the first FibroScan measurement (baseline).
Data were missing in 10 (1%) and 53 (32%) of participants with and without valid liver fibrosis measurements, respectively.
Determinants of Liver Fibrosis
Among the 1176 anti-HCV–positive persons, 5634 liver fibrosis measurements were available—a median of 5 tests (IQR, 2 to 7 tests) per person over 2.9 years (IQR, 0.9 to 4.1 years). The median liver stiffness result was 6.7 kPa (IQR, 5.3 to 9.2 kPa). Based on previously published thresholds (12, 13), 163 (13.9%) participants at the baseline visit had cirrhosis (≥12.3 kPa), 125 (10.6%) had clinically significant fibrosis but not cirrhosis (9.3 to 12.2 kPa), and 888 (75.5%) had clinically insignificant fibrosis (<9.3 kPa). At the baseline visit, persons coinfected with HIV and HCV had a greater prevalence of cirrhosis (19.5% [77 of 394] vs. 11.0% [86 of 782]) and clinically significant fibrosis without cirrhosis (12.9% [51 of 394] vs. 9.5% [74 of 782]) than persons with only HCV (P < 0.001).
Liver fibrosis was associated with older age (P < 0.001) and was greater in persons with HIV than those without HIV (P = 0.005) (Table 2). Black race, ever using alcohol daily, chronic HBV infection, greater BMI, and greater HCV RNA level were also associated with greater liver fibrosis. No significant association was observed with sex, illicit drug use, or ART use. In multivariable regression models, liver fibrosis remained strongly associated with age and HIV infection (Table 3). Likewise, liver fibrosis remained associated with HCV RNA level (P < 0.001), with lower fibrosis seen in persons in whom HCV RNA could not be detected and with increasing fibrosis in persons with greater HCV RNA levels (Figure 1). Associations of liver fibrosis with alcohol use, BMI, and chronic hepatitis B were sustained in multivariable analysis, whereas race was no longer associated.
Table 2.
Determinants of Liver Fibrosis in 5634 Fibrosis Measurements Among 1176 Persons With HCV Antibodies
| Characteristic* | Measurements, n | Exponentiated Coefficient† | 95% CI | P Value |
|---|---|---|---|---|
| All participants | ||||
| Age (per year) | 5634 | 1.02 | 1.01–1.03 | <0.001 |
| Women | 1724 | 0.94 | 0.84–1.06 | 0.32 |
| Black | 5066 | 1.18 | 1.03–1.35 | 0.019 |
| Ever used alcohol daily | 2275 | 1.21 | 1.10–1.33 | <0.001 |
| BMI | ||||
| <25 kg/m2 | 2984 | Reference | ||
| 25–29 kg/m2 | 1725 | 1.09 | 1.04–1.15 | 0.001 |
| ≥30 kg/m2 | 845 | 1.16 | 1.06–1.26 | 0.001 |
| HBsAg-positive | 108 | 1.29 | 0.97–1.70 | 0.078 |
| HCV RNA level | ||||
| ND | 930 | Reference | ||
| 2.8–5 log10 IU/mL | 255 | 1.15 | 0.90–1.49 | 0.27 |
| 5–5.9 log10 IU/mL | 1341 | 1.28 | 1.06–1.54 | 0.010 |
| ≥6 log10 IU/mL | 3091 | 1.40 | 1.20–1.64 | <0.001 |
| HIV infection | 1891 | 1.16 | 1.05–1.29 | 0.005 |
| CD4 count | ||||
| Not infected with HIV | 3743 | Reference | ||
| ≥0.500 × 10⁹ cells/L | 367 | 1.09 | 0.98–1.21 | 0.100 |
| 0.350–0.499 × 10⁹ cells/L | 376 | 1.09 | 0.98–1.21 | 0.130 |
| 0.200–0.349 × 10⁹ cells/L | 544 | 1.20 | 1.06–1.36 | 0.004 |
| <0.200 × 10⁹ cells/L | 588 | 1.20 | 1.06–1.36 | 0.003 |
| HIV RNA level | ||||
| Not infected with HIV | 3743 | Reference | ||
| <2.6 log10 copies/mL | 944 | 1.14 | 1.02–1.27 | 0.021 |
| 2.6–3.9 log10 copies/mL | 336 | 1.13 | 1.00–1.26 | 0.042 |
| ≥4.0 log10 copies/mL | 601 | 1.21 | 1.08–1.36 | 0.001 |
| Participants with HIV only | ||||
| CD4 count | ||||
| ≥0.500 × 10⁹ cells/L | 367 | Reference | ||
| 0.350–0.499 × 10⁹ cells/L | 376 | 1.00 | 0.94–1.06 | 0.96 |
| 0.200–0.349 × 10⁹ cells/L | 544 | 1.10 | 1.00-1.22 | 0.022 |
| <0.200 × 10⁹ cells/L | 588 | 1.11 | 1.01–1.22 | 0.039 |
| Nadir CD4 count, per 100-cell increase‡ | 1875 | 0.94 | 0.91–0.97 | <0.001 |
| HIV RNA level | ||||
| <2.6 log10 copies/mL | 944 | Reference | ||
| 2.6–3.9 log10 copies/mL | 336 | 0.99 | 0.91–1.07 | 0.73 |
| ≥4.0 log10 copies/mL | 601 | 1.06 | 0.98–1.15 | 0.148 |
| Current ART use | 1136 | 1.01 | 0.92–1.11 | 0.83 |
| Cumulative ART use | ||||
| None | 532 | Reference | ||
| 1%–24% visits | 306 | 1.07 | 0.97–1.18 | 0.171 |
| 25%–49% visits | 427 | 1.00 | 0.87–1.15 | 0.99 |
| ≥50% visits | 561 | 1.12 | 0.94–1.33 | 0.22 |
ART = antiretroviral therapy; BMI = body mass index; HBsAg = hepatitis B surface antigen; HCV = hepatitis C virus; ND = not detected.
Factors were time-updated at each study visit except for sex, race, HBsAg status, and HCV RNA level, which were fixed at the first valid liver fibrosis measurement (baseline visit). Daily alcohol use (ever) and ART use (proportion of visits) wete calculated from cumulative data on self-reports of previous 6-mo exposure during the entire cohort follow-up.
Coefficients of the change in continuous liver stiffness measurement (in kilopascals) were estimated from log γ models with generalized estimating equations. The natural logarithm coefficients have been exponentiated to aid interpretation as the relative differences in fibrosis associated with the specified variable.
Represents lowest CD4 cell count measured during study follow-up, presented in units of 0.100 × 10⁹ cells/L increase.
Table 3.
Determinants of Liver Fibrosis Among 1176 Persons With HCV Antibodies*
| Characteristic* | HIV Infection |
CD4 Count |
HIV Viral Load |
||||||
|---|---|---|---|---|---|---|---|---|---|
| Exponentiated Coefficient† | 95% CI | P Value | Exponentiated Coefficient† | 95% CI | P Value | Exponentiated Coefficient† | 95% CI | P Value | |
| Age (per year) | 1.02 | 1.01–1.03 | <0.001 | 1.02 | 1.01–1.03 | <0.001 | 1.02 | 1.01–1.03 | <0.001 |
| Black | 0.91 | 0.79–1.05 | 0.22 | 0.91 | 0.79–1.05 | 0.199 | 0.91 | 0.79–1.05 | 0.21 |
| Women | 1.02 | 0.90–1.15 | 0.77 | 1.02 | 0.91–1.15 | 0.73 | 1.02 | 0.90–1.15 | 0.76 |
| Ever used alcohol daily | 1.17 | 1.05–1.30 | 0.004 | 1.17 | 1.05–1.30 | 0.004 | 1.17 | 1.05–1.30 | 0.004 |
| BMI | |||||||||
| <25 kg/m2 | Reference | Reference | Reference | ||||||
| 25–29 kg/m2 | 1.08 | 1.03–1.13 | 0.003 | 1.08 | 1.03–1.14 | 0.002 | 1.08 | 1.03–1.14 | 0.002 |
| ≥30 kg/m2 | 1.14 | 1.05–1.24 | 0.003 | 1.14 | 1.05–1.24 | 0.001 | 1.14 | 1.05–1.24 | 0.002 |
| HCV RNA level | |||||||||
| <2.8 log10 IU/mL | Reference | Reference | Reference | ||||||
| 2.8–5.9 log10 IU/mL | 1.26 | 1.06–1.50 | 0.008 | 1.26 | 1.06–1.50 | 0.009 | 1.26 | 1.06–1.50 | 0.008 |
| ≥6 log10 IU/mL | 1.32 | 1.13–1.55 | <0.001 | 1.32 | 1.13–1.54 | 0.001 | 1.32 | 1.13–1.55 | <0.001 |
| HBsAg-positive | 1.50 | 1.11–2.02 | 0.008 | 1.48 | 1.10–1.99 | 0.009 | 1.49 | 1.11–2.02 | 0.009 |
| No HIV infection | Reference | Reference | Reference | ||||||
| HIV infection | 1.18 | 1.06–1.31 | 0.002 | ||||||
| CD4 count | |||||||||
| ≥0.350 × 10⁹cells/L | 1.11 | 1.00–1.24 | 0.050 | ||||||
| <0.350 × 10⁹ cells/L | 1.23 | 1.10–1.38 | <0.001 | ||||||
| HIV RNA level | |||||||||
| <4.0 log10 copies/mL | 1.15 | 1.03–1.28 | 0.010 | ||||||
| ≥4.0 log10 copies/mL | 1.25 | 1.11–1.40 | <0.001 | ||||||
BMI = body mass index; HBsAg = hepatitis B virus surface antigen; HCV = hepatitis C virus.
Factors were time-updated at each study visit except for sex, race, HBsAg status, and HCV RNA level, which were fixed at the first valid liver fibrosis measurement (baseline visit). Daily alcohol use (ever) and antiretroviral use (proportion of visits) were calculated from cumulative data on self-reports of previous 6-mo exposure during the entire cohort follow-up.
Coefficients of the change in continuous liver stiffness measurement (in kilopascals) were estimated from multivariable log γ models with generalized estimating equations (adjusting for other factors listed). The natural logarithm coefficients have been exponentiated to aid interpretation as the relative differences in fibrosis associated with the specified variable.
Figure 1. Liver fibrosis increases with greater HCV RNA levels.
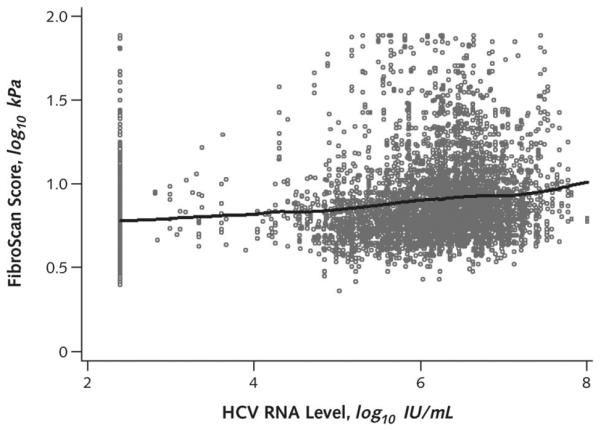
In this scatterplot of liver fibrosis scores by HCV RNA levels, each dot represents a participant with measurement of HCV RNA level and liver fibrosis measured by elastography. The solid line (based on Lowess regression) illustrates increasing HCV RNA levels in relation to greater liver fibrosis scores. HCV RNA levels that were not detectable were plotted at the limit of detection of the assay. HCV = hepatitis C virus.
Alternative models were constructed to evaluate associations with CD4 lymphocyte count and HIV RNA levels. Compared with persons without HIV, those with HIV who had lower CD4 lymphocyte counts or greater HIV RNA levels have more severe liver fibrosis (Table 3). The association of HIV with liver fibrosis was not sensitive to an unmeasured confounder (Figure 2). In analyses restricted to persons with HIV (Table 4), liver fibrosis remained independently associated with alcohol use and HCV RNA level, whereas the association of liver fibrosis with age in this subset of persons coinfected with HIV and HCV was of marginal statistical significance. Fibrosis was increased in relation to more severe immunosuppression (lower nadir CD4 count; contemporaneous CD4 count < 0.350 × 10⁹ cells) and greater levels of viremia (HIV RNA level > 4.0 log10 copies/mL). In participants with HIV, no association was seen between degree of fibrosis and BMI or with measures of current or cumulative ART use (data not shown).
Figure 2. Sensitivity analysis of the effect of an unmeasured confounder on the association between HIV status and liver fibrosis.
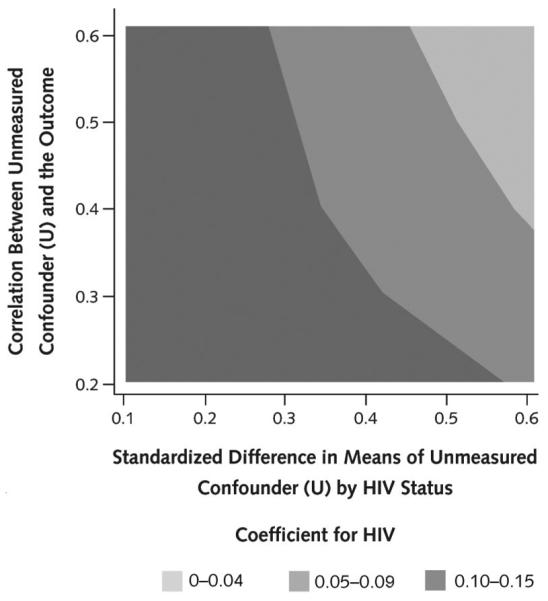
In our primary analysis of liver fibrosis scores, the β-coefficient for HIV positivity was 0.18. To evaluate the effect of an unmeasured confounder (U) for potentially attenuating this β-coefficient for HIV, we generated U as a continuous variable with a range of association with both the primary exposure of HIV status and the outcome of liver fibrosis measured continuously as FibroScan score. The strength of correlation of U with HIV status was measured as a standardized difference in mean U between groups with and without HIV ranging from 0.1 to 0.6 (x-axis). The strength of association of U with FibroScan score was measured as a Pearson correlation coefficient ranging from 0.2 to 0.6 (y-axis). U was generated for the first study visit for all participants with values carried forward during follow-up. The goal was to assess whether adjustment for U attenuates the estimated β-coefficient for HIV in the regression model. For each combination of correlation coefficient and standardized difference in means, 200 replicates of the β-coefficient were generated and averaged. Results are presented as a contour plot that summarizes the range for values of the β-coefficient across combinations of correlation with the outcome and standardized difference in means between the HIV exposure groups. As illustrated, an unmeasured confounder would need to be both strongly associated with HIV status (for example, difference in means approaching 0.5 SDs) and moderately correlated with liver fibrosis (correlation coefficient >0.35) to substantially attenuate the observed HIV association with liver fibrosis. Because no known exposure met those thresholds, it is exceptionally unlikely that an as-yet unrecognized or incompletely measured factor would substantially alter the results. For example, HCV RNA level is known to be associated with HIV and, in our analysis, was found to be one of the strongest factors associated with liver fibrosis; however, the correlation between log10 HCV RNA level and fibrosis was only 0.13, and the standardized difference in mean HCV RNA levels by HIV status was 0.31. HCV = hepatitis C virus.
Table 4.
Determinants of Liver Fibrosis Among 394 Persons With HIV and HCV
| Characteristic* | CD4 Nadir |
CD4 Count |
HIV Viral Load |
||||||
|---|---|---|---|---|---|---|---|---|---|
| Exponentiated Coefficient† | 95% CI | P Value | Exponentiated Coefficient† | 95% CI | P Value | Exponentiated Coefficient† | 95% CI | P Value | |
| Age (per year) | 1.01 | 1.00–1.02 | 0.069 | 1.01 | 1.00–1.02 | 0.045 | 1.01 | 1.00–1.02 | 0.046 |
| Black | 0.92 | 0.75–1.12 | 0.41 | 0.93 | 0.75–1.15 | 0.51 | 0.94 | 0.76–1.16 | 0.55 |
| Women | 0.94 | 0.78–1.14 | 0.54 | 0.94 | 0.77–1.14 | 0.51 | 0.93 | 0.77–1.13 | 0.48 |
| Ever used alcohol daily | 1.27 | 1.04–1.54 | 0.020 | 1.27 | 1.04–1.55 | 0.017 | 1.28 | 1.05–1.56 | 0.015 |
| BMI | |||||||||
| 25–29 kg/m2 | 1.06 | 0.98–1.14 | 0.131 | 1.06 | 0.98–1.15 | 0.128 | 1.07 | 0.99–1.15 | 0.094 |
| ≥30 kg/m2 | 1.05 | 0.87–1.26 | 0.62 | 1.06 | 0.88–1.28 | 0.53 | 1.06 | 0.88–1.28 | 0.54 |
| HCV RNA level | |||||||||
| <2.8 log10 IU/mL | Reference | Reference | Reference | ||||||
| 2.8–5.9 log10 IU/mL | 1.34 | 0.98–1.82 | 0.06 | 1.34 | 0.98–1.84 | 0.071 | 1.35 | 0.98–1.86 | 0.066 |
| ≥6 log10 IU/mL | 1.38 | 1.05–1.80 | 0.020 | 1.39 | 1.05–1.84 | 0.019 | 1.41 | 1.06–1.86 | 0.018 |
| HBsAg-positive | 1.44 | 0.97–2.13 | 0.073 | 1.46 | 0.97–2.21 | 0.072 | 1.48 | 0.97–2.26 | 0.066 |
| CD4 nadir count, per 100-cell increase | 0.95 | 0.92–0.98 | 0.002 | ||||||
| Current CD4 count | |||||||||
| <0.350 × 10⁹cells/L | Reference | – | |||||||
| ≥0.350 × 10⁹cells/L | 0.91 | 0.85–0.99 | 0.019 | ||||||
| HIV RNA level | |||||||||
| <4.0 log10 copies/mL | Reference | – | |||||||
| ≥4.0 log10 copies/mL | 1.08 | 1.01–1.15 | 0.025 | ||||||
BMI = body mass index; HBsAg = hepatitis B surface antigen; HCV = hepatitis C virus.
Factors were time-updated at each study visit except for sex, race, HBsAg status, and HCV RNA level, which were fixed at the first valid liver fibrosis measurement (baseline visit). Daily alcohol use (ever) and antiretroviral use (proportion of visits) were calculated from cumulative data on self-reports of previous 6-mo exposure during the entire cohort follow-up
Coefficients of the change in continuous liver stiffness measurement (in kilopascals) were estimated from multivariable log γ models with generalized estimating equations (adjusting for other factors listed). The natural logarithm coefficients have been exponentiated to aid interpretation as the relative differences in fibrosis associated with the specified variable.
Age, HIV, and Liver Fibrosis
Using our final adjusted model (Table 3, HIV Infection model), we calculated the expected liver fibrosis values for a representative participant from 30 to 60 years of age by HIV status (Figure 3). The average predicted liver fibrosis score ranged from 1.17 to 2.02 kPa greater in persons with HIV compared with those without HIV. Persons with HIV had liver fibrosis measurements equal to those of persons without HIV, who were, on average, 9.2 years older (90% coverage limit, 5.2 to 14.3 years). As depicted in Figure 3, our model suggests similarly increasing slopes of liver fibrosis with older age in both participants with and without HIV. To assess both the longitudinal and cross-sectional elements of age, we repeated models with age at baseline (age) and the time in follow-up (age at visit minus age at baseline). Both baseline age and time in follow-up were associated with liver fibrosis, as was HIV infection (Appendix Table, available at www.annals.org).
Figure 3. Liver fibrosis and age among persons coinfected with HIV and HCV (dashed line) and those with only HCV (solid line).
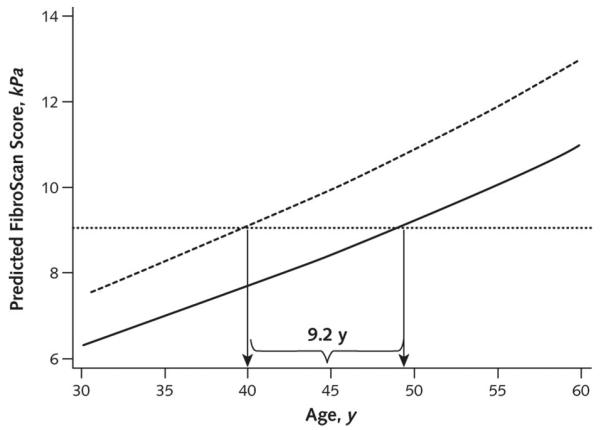
For each age, predicted liver fibrosis scores were calculated using a regression equation that included the race, sex, alcohol use, body mass index, hepatitis B virus surface antigen level status, and HCV RNA level values for a representative participant (overweight black male who has no regular alcohol use, is hepatitis B virus surface antigen–negative, and has high HCV viral load) for persons coinfected with HIV and HCV (dashed line) and for persons with only HCV (solid line). For example, a 40-year-old HIV- and HCV-coinfected person with these characteristics was calculated to have a predicted FibroScan score of 9.04 kPa. For this same degree of fibrosis, the predicted age in a similar person but with only HCV was 49.2 years. Over the entire age range, the average difference in estimated age between persons coinfected with HIV and HCV and those with only HCV was 9.2 years (90% coverage limit, 5.2 to 14.3 years). HCV = hepatitis C virus.
Discussion
In this investigation, persons coinfected with HIV and HCV had liver fibrosis measures equal to those of persons with only HCV who were nearly 1 decade older. These data are consistent with the hypothesis that both HIV infection and older age promote HCV-related liver disease progression and may reflect common mechanisms.
Older age is consistently associated with greater progression of HCV-related liver disease (10, 16–18). For example, in a large cross-sectional study of persons with HCV, Poynard and colleagues (16) reported that the rate of fibrosis progression (biopsy stage divided by estimated years of infection) increased progressively with age and was 67% greater in those older than 50 years than in those aged 41 to 50 years. Age was strongly linked to liver fibrosis even after adjustment for duration of HCV infection. HIV infection is also consistently associated with progression of HCV-related liver fibrosis (19–21). In a study of 1816 anti-HCV–positive persons with hemophilia, the risk for end-stage liver disease was increased 8.1-fold in those who also had HIV (21).
HIV infection and age also increase the risk for other conditions, including cardiovascular disease, cancer, dementia, and various forms of lung disease (1–3, 22). The reported ages at which these diseases manifest have been younger for persons with HIV than for those without HIV. For example, Shiels and colleagues (3) reported that the ages when most types of cancer were diagnosed were approximately 20 years younger among persons with AIDS. However, they and others have also pointed out that some (or, in some instances, all) of this apparent reduction in the age of onset of cancer could be explained by the younger age distribution of persons with HIV compared with the general population (3, 23). In addition to a younger age distribution, risk factors for cancer and other chronic non-AIDS conditions (for example, cigarette smoking, alcohol use, and viral hepatitis) are highly prevalent among populations with HIV. Thus, it is critical to identify control populations that are similar in all respects other than the HIV infection to make inferences about the effects of HIV.
It is noteworthy that in the present study, persons with and without HIV were recruited and followed identically in a study designed to assess the effect of HIV on various conditions. Liver disease outcome and exposures were evaluated prospectively and directly using a method that includes the full spectrum of disease, rather than by using death certificates or billing codes. Instead of using general population-based controls, we recruited and studied persons with and without HIV by using the same protocols and carefully monitored potential confounders. Even after adjustment for HCV RNA level, chronic HBV status, sex, race, BMI, and alcohol use, persons with HIV had liver fibrosis as advanced as those without HIV who were nearly 1 decade older.
The mechanisms through which HIV and aging affect liver fibrosis progression are poorly understood. Accumulating evidence points toward a role for telomere dysfunction or cellular senescence in several age-related phenotypes, especially in mice (24, 25). In humans, telomere shortening in various cell types has been reported with cirrhosis (26), HCV (27), and HIV (28, 29). Although these data support the hypothesis that shortened hepatocyte telomeres (whether due to age, HCV, HIV, or a combination of these) may contribute to hepatocyte senescence and reduced regenerative capacity, there is no convincing unifying evidence.
In this study, we detected a dose–response relationship between HCV RNA level and contemporaneous liver fibrosis. Although the connection between blood HCV RNA level and the likelihood of response to interferon and ribavirin treatment is well-recognized, most previous studies failed to detect a strong correlation between HCV RNA level and liver fibrosis (10, 30–32). However, some other studies have also suggested an increased risk for end-stage liver disease or death in persons with greater HCV RNA levels (33, 34). Whether the strong association detected in the present study is related to the wider linear range of newer HCV RNA real-time assays compared with former viral load tests, the large number of persons studied, or the use of liver stiffness to assess liver fibrosis is not evident.
In addition to age and HCV RNA level, liver fibrosis among persons with HIV was associated with having lower nadir or current CD4 count and greater HIV RNA levels. These findings may suggest that ART would reduce the risk for liver fibrosis progression among persons coinfected with HIV and HCV. In a study from 1 center, the risk for liver-related deaths seemed to be lower during the highly active ART era than in earlier periods or that of persons not taking ART (35). However, in the present study, we did not detect an association among persons coinfected with HIV and HCV between liver fibrosis and ART use. Long-term, prospective follow-up is ongoing to clarify the longitudinal relationships among age, ART use, HIV disease markers, and liver fibrosis.
Besides treatment directed against HIV or HCV infections, other risk factors for liver fibrosis (for example, overweight or obesity and alcohol use) were identified that may be potentially modifiable. Although widely recognized that weight loss and reduced alcohol consumption should be encouraged among persons with chronic HCV infection (36), implementation in practice is often limited. With aging of the populations with HCV and HIV infections, increasing emphasis should be placed on determining the most effective strategies for reducing modifiable risk factors and incorporating newer antivirals into HCV management of complex, older patients.
The measurement of fibrosis is a challenge in all studies of liver disease. The gold standard is the clinical expression of end-stage liver disease (10, 35). However, studies of the clinical expression of liver disease fail to capture important intermediate transitions because they are not clinically evident. We have also assessed the degree of liver fibrosis in this cohort by examination of liver tissue obtained by biopsy (33). However, too few persons could be studied regularly by liver biopsy to assess risk factors with high precision. Thus, an indirect measurement of liver fibrosis, liver stiffness measured by elastography using FibroScan, which was first developed in Europe and subsequently validated in our cohort, was used to provide insights about the associations of age, HCV RNA levels, and race that we previously failed to detect (12, 37). Nonetheless, it is important to acknowledge that liver stiffness is only a proxy for liver fibrosis.
Liver fibrosis occurs over decades in most persons with HCV. Thus, the exposures that we assessed at or near the time of the liver stiffness measurement may not be representative of the previous exposures responsible for the development of fibrosis detected later, as illustrated perhaps by the lack of association of liver fibrosis with ART use. Greater measured fibrosis at each age among persons with HIV but with similarly increasing slopes of fibrosis with age by HIV status may suggest that the difference between persons with and without HIV occurred before our fibrosis assessment. In addition, the relatively flat slope of the elastography–age relationship may result in imprecision in our estimate of how much older a person without HIV would be compared with someone with HIV who had equal liver fibrosis (for example, small changes in FibroScan score can translate into substantial changes in age). Likewise, too few persons in this study had successful treatment of HCV infection to assess the effect of anti-HCV treatment on fibrosis progression. It is also noteworthy that duration of HCV infection is not known for most persons; however, in this cohort, time from first drug use correlates strongly (38, 39). Age is also strongly correlated with both measures, such that we can model only 1 of these variables at a time. Thus, if HCV infection occurred at earlier ages in persons with HIV, it may seem that HIV causes liver fibrosis at younger ages. Of importance, the estimated duration of HCV infection in our population does not differ substantially by HIV status (median, 28.6 vs. 28.9 years for persons with and without HIV, respectively).
In summary, persons who are coinfected with HIV and HCV have liver fibrosis stages similar to persons infected with HCV alone who are nearly 1 decade older. Additional work is needed to understand the biological basis for this observation and investigate whether effective treatment of HIV and HCV infections reduce future liver fibrosis progression.
Context
It has been postulated that HIV infection accelerates hepatitis C virus (HCV)–related liver disease progression.
Contribution
Elastography was used prospectively to compare the severity of liver fibrosis by age in a well-characterized cohort of persons with HCV, one third of whom were coinfected with HIV. Patients coinfected with HIV and HCV had liver fibrosis measures equivalent to those of patients with only HCV who were nearly 1 decade older.
Implication
Increasing age and HIV infection are independently associated with the stage of HCV-related liver fibrosis.
—The Editors
Acknowledgment
All persons who have contributed substantially to this work have been recognized.
Grant Support: By United States Public Health Service, National Institute of Drug Abuse (R01-DA-016078, R01-DA-04334, and R01-DA-12568). Dr. Kirk was supported by the American Cancer Society (MRSG-07-284-01-CCE). Support of reagents for HCV RNA testing was generously provided by Abbott Molecular.
Primary Funding Source: National Institute on Drug Abuse.
Role of the Funding Source The work was funded primarily by the National Institute on Drug Abuse. The funding source was not involved in the design, conduct, or reporting of the study or in the decision to submit the manuscript for publication.
Footnotes
Potential Conflicts of Interest: Disclosures can be viewed at www.acponline.org/authors/icmje/ConflictOfInterestForms.do?msNum=M12-1085.
Reproducible Research Statement: Study protocol and data set: Not available. Statistical code: Available from Dr. Kirk (address at www.annals.org).
References
- 1.Triant VA, Lee H, Hadigan C, Grinspoon SK. Increased acute myocardial infarction rates and cardiovascular risk factors among patients with human immunodeficiency virus disease. J Clin Endocrinol Metab. 2007;92:2506–12. doi: 10.1210/jc.2006-2190. PMID: 17456578. [DOI] [PMC free article] [PubMed] [Google Scholar]
- 2.Hsue PY, Lo JC, Franklin A, Bolger AF, Martin JN, Deeks SG, et al. Progression of atherosclerosis as assessed by carotid intima-media thickness in patients with HIV infection. Circulation. 2004;109:1603–8. doi: 10.1161/01.CIR.0000124480.32233.8A. PMID: 15023877. [DOI] [PubMed] [Google Scholar]
- 3.Shiels MS, Pfeiffer RM, Engels EA. Age at cancer diagnosis among persons with AIDS in the United States. Ann Intern Med. 2010;153:452–60. doi: 10.1059/0003-4819-153-7-201010050-00008. PMID: 20921544. [DOI] [PMC free article] [PubMed] [Google Scholar]
- 4.Douek DC, McFarland RD, Keiser PH, Gage EA, Massey JM, Haynes BF, et al. Changes in thymic function with age and during the treatment of HIV infection. Nature. 1998;396:690–5. doi: 10.1038/25374. PMID: 9872319. [DOI] [PubMed] [Google Scholar]
- 5.Brenchley JM, Price DA, Schacker TW, Asher TE, Silvestri G, Rao S, et al. Microbial translocation is a cause of systemic immune activation in chronic HIV infection. Nat Med. 2006;12:1365–71. doi: 10.1038/nm1511. PMID: 17115046. [DOI] [PubMed] [Google Scholar]
- 6.Justice AC, Freiberg MS, Tracy R, Kuller L, Tate JP, Goetz MB, et al. VACS Project Team. Does an index composed of clinical data reflect effects of inflammation, coagulation, and monocyte activation on mortality among those aging with HIV? Clin Infect Dis. 2012;54:984–94. doi: 10.1093/cid/cir989. PMID: 22337823. [DOI] [PMC free article] [PubMed] [Google Scholar]
- 7.Kirk GD, Merlo CA. Lung HIV Study. HIV infection in the etiology of lung cancer: confounding, causality, and consequences. Proc Am Thorac Soc. 2011;8:326–32. doi: 10.1513/pats.201009-061WR. PMID: 21653536. [DOI] [PMC free article] [PubMed] [Google Scholar]
- 8.Hulten E, Mitchell J, Scally J, Gibbs B, Villines TC. HIV positivity, protease inhibitor exposure and subclinical atherosclerosis: a systematic review and meta-analysis of observational studies. Heart. 2009;95:1826–35. doi: 10.1136/hrt.2009.177774. PMID: 19632982. [DOI] [PubMed] [Google Scholar]
- 9.Vlahov D, Anthony JC, Muñoz A, Margolik J, Celentano DD, Solomon L, et al. The ALIVE Study: a longitudinal study of HIV-1 infection in intravenous drug users: description of methods. J Drug Issues. 1991;21:759–76. [PubMed] [Google Scholar]
- 10.Thomas DL, Astemborski J, Rai RM, Anania FA, Schaeffer M, Galai N, et al. The natural history of hepatitis C virus infection: host, viral, and environmental factors. JAMA. 2000;284:450–6. doi: 10.1001/jama.284.4.450. PMID: 10904508. [DOI] [PubMed] [Google Scholar]
- 11.Mehta SH, Astemborski J, Kirk GD, Strathdee SA, Nelson KE, Vlahov D, et al. Changes in blood-borne infection risk among injection drug users. J Infect Dis. 2011;203:587–94. doi: 10.1093/infdis/jiq112. PMID: 21282191. [DOI] [PMC free article] [PubMed] [Google Scholar]
- 12.Kirk GD, Astemborski J, Mehta SH, Spoler C, Fisher C, Allen D, et al. Assessment of liver fibrosis by transient elastography in persons with hepatitis C virus infection or HIV-hepatitis C virus coinfection. Clin Infect Dis. 2009;48:963–72. doi: 10.1086/597350. PMID: 19236273. [DOI] [PMC free article] [PubMed] [Google Scholar]
- 13.Mehta SH, Kirk GD, Astemborski J, Sulkowski MS, Afdhal NH, Thomas DL. Stability of liver fibrosis among HCV-infected injection drug users. Antivir Ther. 2012;17:813–21. doi: 10.3851/IMP2085. PMID: 22418880. [DOI] [PMC free article] [PubMed] [Google Scholar]
- 14.Thomas DL, Astemborski J, Vlahov D, Strathdee SA, Ray SC, Nelson KE, et al. Determinants of the quantity of hepatitis C virus RNA. J Infect Dis. 2000;181:844–51. doi: 10.1086/315314. PMID: 10720503. [DOI] [PubMed] [Google Scholar]
- 15.Zeger SL, Liang KY, Albert PS. Models for longitudinal data: a generalized estimating equation approach. Biometrics. 1988;44:1049–60. PMID: 3233245. [PubMed] [Google Scholar]
- 16.Poynard T, Bedossa P, Opolon P. Natural history of liver fibrosis progression in patients with chronic hepatitis C. The OBSVIRC, METAVIR, CLINIVIR, and DOSVIRC groups. Lancet. 1997;349:825–32. doi: 10.1016/s0140-6736(96)07642-8. PMID: 9121257. [DOI] [PubMed] [Google Scholar]
- 17.Alberti A, Noventa F, Benvegnù L, Boccato S, Gatta A. Prevalence of liver disease in a population of asymptomatic persons with hepatitis C virus infection. Ann Intern Med. 2002;137:961–4. doi: 10.7326/0003-4819-137-12-200212170-00009. PMID: 12484711. [DOI] [PubMed] [Google Scholar]
- 18.Pradat P, Voirin N, Tillmann HL, Chevallier M, Trépo C. Progression to cirrhosis in hepatitis C patients: an age-dependent process. Liver Int. 2007;27:335–9. doi: 10.1111/j.1478-3231.2006.01430.x. PMID: 17355454. [DOI] [PubMed] [Google Scholar]
- 19.Darby SC, Ewart DW, Giangrande PL, Spooner RJ, Rizza CR, Dusheiko GM, et al. Mortality from liver cancer and liver disease in haemophilic men and boys in UK given blood products contaminated with hepatitis C. UK Haemophilia Centre Directors' Organisation. Lancet. 1997;350:1425–31. doi: 10.1016/s0140-6736(97)05413-5. PMID: 9371165. [DOI] [PubMed] [Google Scholar]
- 20.Di Martino V, Rufat P, Boyer N, Renard P, Degos F, Martinot-Peignoux M, et al. The influence of human immunodeficiency virus coinfection on chronic hepatitis C in injection drug users: a long-term retrospective cohort study. Hepatology. 2001;34:1193–9. doi: 10.1053/jhep.2001.29201. PMID: 11732009. [DOI] [PubMed] [Google Scholar]
- 21.Goedert JJ, Eyster ME, Lederman MM, Mandalaki T, De Moerloose P, White GC, 2nd, et al. End-stage liver disease in persons with hemophilia and transfusion-associated infections. Blood. 2002;100:1584–9. PMID: 12176875. [PubMed] [Google Scholar]
- 22.Moore RD, Chaisson RE. Natural history of opportunistic disease in an HIV-infected urban clinical cohort. Ann Intern Med. 1996;124:633–42. doi: 10.7326/0003-4819-124-7-199604010-00003. PMID: 8607591. [DOI] [PubMed] [Google Scholar]
- 23.Martin J, Volberding P. HIV and premature aging: A field still in its infancy [Editorial] Ann Intern Med. 2010;153:477–9. doi: 10.7326/0003-4819-153-7-201010050-00013. PMID: 20921548. [DOI] [PubMed] [Google Scholar]
- 24.Sahin E, Colla S, Liesa M, Moslehi J, Müller FL, Guo M, et al. Telomere dysfunction induces metabolic and mitochondrial compromise. Nature. 2011;470:359–65. doi: 10.1038/nature09787. PMID: 21307849. [DOI] [PMC free article] [PubMed] [Google Scholar]
- 25.Baker DJ, Wijshake T, Tchkonia T, LeBrasseur NK, Childs BG, van de Sluis B, et al. Clearance of p16Ink4a-positive senescent cells delays ageing-associated disorders. Nature. 2011;479:232–6. doi: 10.1038/nature10600. PMID: 22048312. [DOI] [PMC free article] [PubMed] [Google Scholar]
- 26.Wiemann SU, Satyanarayana A, Tsahuridu M, Tillmann HL, Zender L, Klempnauer J, et al. Hepatocyte telomere shortening and senescence are general markers of human liver cirrhosis. FASEB J. 2002;16:935–42. doi: 10.1096/fj.01-0977com. PMID: 12087054. [DOI] [PubMed] [Google Scholar]
- 27.Hoare M, Gelson WT, Das A, Fletcher JM, Davies SE, Curran MD, et al. CD4+ T-lymphocyte telomere length is related to fibrosis stage, clinical outcome and treatment response in chronic hepatitis C virus infection. J Hepatol. 2010;53:252–60. doi: 10.1016/j.jhep.2010.03.005. PMID: 20462651. [DOI] [PMC free article] [PubMed] [Google Scholar]
- 28.Lichterfeld M, Mou D, Cung TD, Williams KL, Waring MT, Huang J, et al. Telomerase activity of HIV-1-specific CD8+ T cells: constitutive up-regulation in controllers and selective increase by blockade of PD ligand 1 in progressors. Blood. 2008;112:3679–87. doi: 10.1182/blood-2008-01-135442. PMID: 18728248. [DOI] [PMC free article] [PubMed] [Google Scholar]
- 29.Wolthers KC, Bea G, Wisman A, Otto SA, de Roda Husman AM, Schaft N, et al. T cell telomere length in HIV-1 infection: no evidence for increased CD4+ T cell turnover. Science. 1996;274:1543–7. doi: 10.1126/science.274.5292.1543. PMID: 8929418. [DOI] [PubMed] [Google Scholar]
- 30.Hadziyannis SJ, Sette H, Jr, Morgan TR, Balan V, Diago M, Marcellin P, et al. PEGASYS International Study Group. Peginterferon-alpha2a and ribavirin combination therapy in chronic hepatitis C: a randomized study of treatment duration and ribavirin dose. Ann Intern Med. 2004;140:346–55. doi: 10.7326/0003-4819-140-5-200403020-00010. PMID: 14996676. [DOI] [PubMed] [Google Scholar]
- 31.Shakil AO, Conry-Cantilena C, Alter HJ, Hayashi P, Kleiner DE, Tedeschi V, et al. Volunteer blood donors with antibody to hepatitis C virus: clinical, biochemical, virologic, and histologic features. The Hepatitis C Study Group. Ann Intern Med. 1995;123:330–7. doi: 10.7326/0003-4819-123-5-199509010-00002. PMID: 7542854. [DOI] [PubMed] [Google Scholar]
- 32.Wilson LE, Torbenson M, Astemborski J, Faruki H, Spoler C, Rai R, et al. Progression of liver fibrosis among injection drug users with chronic hepatitis C. Hepatology. 2006;43:788–95. doi: 10.1002/hep.21091. PMID: 16557548. [DOI] [PubMed] [Google Scholar]
- 33.Hisada M, Chatterjee N, Kalaylioglu Z, Battjes RJ, Goedert JJ. Hepatitis C virus load and survival among injection drug users in the United States. Hepatology. 2005;42:1446–52. doi: 10.1002/hep.20938. PMID: 16317675. [DOI] [PubMed] [Google Scholar]
- 34.McMahon BJ, Bruden D, Bruce MG, Livingston S, Christensen C, Homan C, et al. Adverse outcomes in Alaska natives who recovered from or have chronic hepatitis C infection. Gastroenterology. 2010;138:922–31.e1. doi: 10.1053/j.gastro.2009.10.056. PMID: 19909749. [DOI] [PubMed] [Google Scholar]
- 35.Qurishi N, Kreuzberg C, Lüchters G, Effenberger W, Kupfer B, Sauerbruch T, et al. Effect of antiretroviral therapy on liver-related mortality in patients with HIV and hepatitis C virus coinfection. Lancet. 2003;362:1708–13. doi: 10.1016/S0140-6736(03)14844-1. PMID: 14643119. [DOI] [PubMed] [Google Scholar]
- 36.Ghany MG, Strader DB, Thomas DL, Seeff LB. American Association for the Study of Liver Diseases. Diagnosis, management, and treatment of hepatitis C: an update. Hepatology. 2009;49:1335–74. doi: 10.1002/hep.22759. PMID: 19330875. [DOI] [PMC free article] [PubMed] [Google Scholar]
- 37.Castéra L, Vergniol J, Foucher J, Le Bail B, Chanteloup E, Haaser M, et al. Prospective comparison of transient elastography, Fibrotest, APRI, and liver biopsy for the assessment of fibrosis in chronic hepatitis C. Gastroenterology. 2005;128:343–50. doi: 10.1053/j.gastro.2004.11.018. PMID: 15685546. [DOI] [PubMed] [Google Scholar]
- 38.Thomas DL, Vlahov D, Solomon L, Cohn S, Taylor E, Garfein R, et al. Correlates of hepatitis C virus infections among injection drug users. Medicine (Baltimore) 1995;74:212–20. doi: 10.1097/00005792-199507000-00005. PMID: 7623656. [DOI] [PubMed] [Google Scholar]
- 39.Garfein RS, Vlahov D, Galai N, Doherty MC, Nelson KE. Viral infections in short-term injection drug users: the prevalence of the hepatitis C, hepatitis B, human immunodeficiency, and human T-lymphotropic viruses. Am J Public Health. 1996;86:655–61. doi: 10.2105/ajph.86.5.655. PMID: 8629715. [DOI] [PMC free article] [PubMed] [Google Scholar]