

Abstract
Children with attention-deficit/hyperactivity disorder (ADHD) tend to perform more poorly on tests of reading and mathematical performance than their typical peers. Quantitative genetic analyses allow for a better understanding of the etiology of ADHD and reading and mathematics outcomes, by examining their common and unique genetic and environmental influences. Analyses were conducted on a sample 271 pairs of 10-year-old monozygotic and dizygotic twins drawn from the Western Reserve Reading and Mathematics Project. In general, the results suggested that the associations among ADHD symptoms, reading outcomes, and math outcomes were influenced by both general genetic and general shared-environment factors. The analyses also suggested significant independent genetic effects for ADHD symptoms. The results imply that differing etiological factors underlie the relationships among ADHD and reading and mathematics performance. It appears that both genetic and common family or school environments link ADHD with academic performance.
Keywords: genes, environments, ADHD behaviors, reading performance, math performance
Attention-deficit/hyperactivity disorder (ADHD) affects 3 to 7% of all children in the United States (American Psychological Association, 2000). Children with ADHD experience attention and behavior difficulties that can negatively affect academic achievement (Barry, Lyman, & Klinger, 2002). As many as 20% to 40% of individuals with ADHD also have comorbid learning disabilities, which suggests that learning and attention problems may be related (Capano, Minden, Chen, Schachar, & Ickowicz, 2008; Willcutt, Pennington, Chabildas, Olson, & Hulslander, 2005). Moreover, ADHD is predictive of lower future academic achievement in both mathematics and reading, even after controlling for intelligence (Rapport, Scanlan, & Denney, 1999).
The educational and cognitive literature has indicated that ADHD may be associated with lower academic achievement because of underlying deficits in executive functions, such as working memory (Martinussen, Hayden, Hogg-Johnson, & Tannock, 2005). If ADHD is associated similarly with reading and mathematics skills, potentially because of limitations in the general working memory system, this would seem to indicate a common etiology. However, some children have ADHD and reading difficulties without math difficulties, and others have ADHD and math difficulties without reading difficulties (Zentall, 2007). This suggests that the association between ADHD and reading performance may have a different etiology than the association between ADHD and mathematics performance. Such differences could arise from instructional differences or differential task demands. During the late elementary-school years, in most classrooms, mathematics learning requires more sustained attention in class and more independent seat work than reading learning, and these behaviors can be difficult for students with ADHD symptoms (DuPaul & Stoner, 2004). This may be the basis for any difference between the association of ADHD with reading performance and its association with math performance.
Quantitative genetic designs allow for the examination of the genetic and environmental etiology of a specific behavior or of relationships among multiple behaviors of interest. Univariate results indicate that ADHD, reading performance, and mathematics performance each have significant genetic influences, and vary in the extent to which their shared-environment influences are significant in children (Plomin & Kovas, 2005; Stevenson et al., 2005). Bivariate modeling of reading and mathematics performance suggests that they have substantial and significant genetic overlap (Light & DeFries, 1995; Markowitz, Willemsen, Trumbetta, van Beijsterveldt, & Boomsma, 2005). Also, the literature has suggested that attention and behavior difficulties associated with academic problems have a familial component (Doyle, Faraone, DuPre, & Biederman, 2001). Multivariate work has indicated that when symptoms of ADHD and achievement outcomes (e.g., reading) are related, genetic influences are usually implicated (Ebejer et al., 2010; Saudino & Plomin, 2007). However, the relationship between ADHD and mathematics performance has not been fully explored (see Monuteaux, Faraone, Herzig, Navsaria, & Biederman, 2005, for initial work).
We are not aware of a study that has examined the extent to which the associations among symptoms of ADHD, reading skill, and mathematics skill are influenced by similar or unique genetic or environmental effects (for a recent review examining the genetic and environmental influences on ADHD, reading, and math skill independently, see Willcutt et al., 2010). We explored this issue in a general twin population that represents a range of symptoms along a continuum of behaviors and ability. Although the previous work in the educational literature has typically taken a special-education approach, identifying children with diagnosed ADHD and disability, it is possible to compare our study with that work. This is because it is commonly agreed that disability and behavior problems are the low end of the typical distribution of ability and behavior, and not qualitatively different from typical ability and behavior (Polderman et al., 2007; Shaywitz, Shaywitz, Makuch, Fletcher, & Escobar, 1992). Therefore, if ADHD symptoms, reading performance, and mathematics performance share a common underlying etiology, then a multivariate genetic analysis would be expected to show that they have general genetic or shared-environment factors, or both. If there is a unique relationship between ADHD symptoms and reading performance, or between ADHD symptoms and mathematics performance, then corresponding differential genetic and environmental influences would be expected. Given other multivariate work on specific cognitive abilities, we hypothesized that genetic influences would contribute to any common relationship among ADHD, reading performance, and math performance and that any environmental influences would contribute to unique variance in these outcomes (i.e., Kovas & Plomin, 2007).
Method
Participants
The Western Reserve Reading and Mathematics Project (WRRMP) is an ongoing longitudinal twin project based in Ohio (Hart, Petrill, Thompson, & Plomin, 2009; Petrill et al., 2007). Twins are assessed across 7 years, with one home visit per year. The assessments focus on reading, language, and mathematics performance. This study is based on data from the fifth home visit, the first to simultaneously measure reading and mathematics skill. Twins are approximately 10 years old for this home visit (M = 9.82 years, SD = 0.99 years). Data from 271 pairs of monozygotic (n = 112) and same-sex dizygotic (n = 159) twins were available for analysis.
Procedure and measures
Measures of reading and mathematics performance were collected by two trained testers, one per child, during a 3-hr home visit. At the end of the home visit, each tester rated one child on his or her behavior. Ratings of ADHD symptoms were also derived from maternal responses to items included in a mailed questionnaire that parents returned voluntarily (n = 164). Both the maternal ratings and the tester ratings were used to form a rater-free factor of ADHD symptoms.
ADHD measures
The Strength and Weaknesses of ADHD-Symptoms and Normal-Behavior (SWAN) scale was used to obtain the maternal ratings of attention and activity levels (Swanson et al., 2005). This scale is composed of two nine-item subscales: Inattention and Hyperactivity/Impulsivity. Mothers rated each child separately for each item on a 7-point Likert scale (1 = far below, 7 = far above). The tester ratings were obtained with the Bayley Behavior Rating Scale (BBR; Bayley, 1993). We used two items relevant to ADHD symptoms, “attention to tasks” and “hyperactivity.” Ratings were made on 5-point Likert scales (1 = does not attend/constantly hyperactive, 5 = constantly attends/consistently not hyperactive). In our analyses, we used raw scores for ADHD symptoms, with lower scores indicating a higher level of symptoms.
Reading measures
Reading performance was measured by two subtests of the Woodcock Reading Mastery Tests (WRMT; Woodcock, 1987). Word Identification is a test of whole-word decoding; this test requires recognizing and correctly pronouncing real words. Passage Comprehension is a cloze-format test of comprehension.
Mathematics measures
Mathematics achievement was measured via four subtests of the Woodcock-Johnson III achievement test (WJ; Woodcock, McGraw, & Mather, 2001). The Applied Problems subtest measures the ability to solve applied math problems. Quantitative Concepts is a measure of understanding of mathematical concepts, as well as counting ability and understanding of number series. Calculation is a test of ability to perform mathematical computations. Finally, Fluency measures how many computations the child can complete in 3 min.
Results
Descriptive statistics
Descriptive statistics for all measures are presented in Table 1. For descriptive purposes alone, all reading and mathematics measures were age- and sex-normed to a population mean of 100 and a standard deviation of 15. For all measures, the standardized means were slightly higher than the population average, and the standard deviations were slightly lower than the population average (e.g., MWord ID = 106.93, SDWord ID = 10.54). Pearson correlation coefficients among the measures are in Table 2.
Table 1.
Descriptive Statistics for All Measures
| Variable | Mean | SD | Minimum | Maximum | n |
|---|---|---|---|---|---|
| SWAN Inattention subscale | 4.68 | 1.07 | 1.89 | 7.00 | 328 |
| BBR rating for attention to tasks | 4.70 | 0.61 | 2.00 | 5.00 | 543 |
| SWAN Hyperactivity/Impulsivity subscale | 4.73 | 1.08 | 1.67 | 7.00 | 327 |
| BBR rating for hyperactivity | 4.79 | 0.66 | 1.00 | 5.00 | 542 |
| WRMT Word Identification subtest | 106.93 | 10.54 | 68.00 | 140.00 | 538 |
| WRMT Passage Comprehension subtest | 103.61 | 11.11 | 65.00 | 134.00 | 504 |
| WJ Applied Problems subtest | 107.85 | 11.55 | 61.00 | 144.00 | 478 |
| WJ Quantitative Concepts subtest | 105.59 | 12.95 | 73.00 | 145.00 | 366 |
| WJ Fluency subtest | 101.29 | 14.73 | 62.00 | 154.00 | 526 |
| WJ Calculation subtest | 106.41 | 13.33 | 71.00 | 152.00 | 530 |
Note: BBR = Bayley Behavior Rating Scale (Bayley, 1993); SWAN = The Strength and Weaknesses of ADHD-Symptoms and Normal-Behavior scale (Swanson et al., 2005); WJ = Woodcock-Johnson III (Woodcock, McGraw, & Mather, 2001); WRMT = Woodcock Reading Mastery Tests (Woodcock, 1987).
Table 2.
Pearson Correlation Coefficients Among All Measures
| Variable | 1 | 2 | 3 | 4 | 5 | 6 | 7 | 8 | 9 | 10 |
|---|---|---|---|---|---|---|---|---|---|---|
| 1. SWAN Inattention subscale | 1.00 | |||||||||
| 2. BBR rating for attention to tasks | .22* | 1.00 | ||||||||
| 3. SWAN Hyperactivity/Impulsivity subscale | .78* | .17* | 1.00 | |||||||
| 4. BBR rating for hyperactivity | .12* | .55* | .14* | 1.00 | ||||||
| 5. WRMT Word Identification subtest | .28* | .26* | .19* | .13* | 1.00 | |||||
| 6. WRMT Passage Comprehension subtest | .37* | .36* | .29* | .22* | .78* | 1.00 | ||||
| 7. WJ Applied Problems subtest | .30* | .27* | .24* | .11* | .61* | .67* | 1.00 | |||
| 8. WJ Quantitative Concepts subtest | .23* | .26* | .21* | .05 | .58* | .62* | .80* | 1.00 | ||
| 9. WJ Fluency subtest | .30* | .27* | .23* | .09* | .44* | .42* | .59* | .61* | 1.00 | |
| 10. WJ Calculation subtest | .24* | .29* | .17* | .16* | .58* | .56* | .77* | .77* | .64* | 1.00 |
Note: BBR = Bayley Behavior Rating Scale (Bayley, 1993); SWAN = The Strength and Weaknesses of ADHD-Symptoms and Normal-Behavior scale (Swanson et al., 2005); WJ = Woodcock-Johnson III (Woodcock, McGraw, & Mather, 2001); WRMT = Woodcock Reading Mastery Tests (Woodcock, 1987).
p < .05.
Measurement modeling
The main purpose of this study was to examine whether the relationships among ADHD symptoms, reading performance, and mathematics performance are influenced by unitary or multifactorial genetic and environmental effects (see Fig. 1). For this multivariate measurement analysis, we employed a latent factor model, to test construct validity and obtain random error-free latent factors for further analysis (see Gayan & Olson, 2003). We used this general model to test three specific models of the associations among ADHD symptoms, reading performance, and math performance. The models differed in their definition of ADHD symptoms.
Fig. 1.
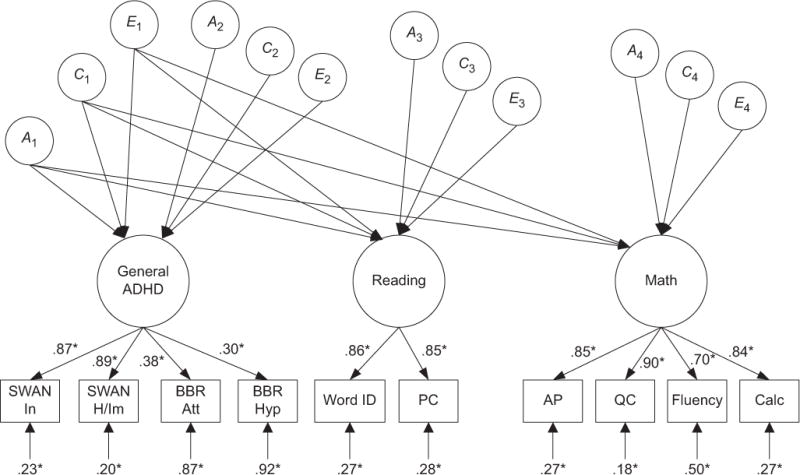
Model of the relationships among symptoms of attention-deficit/hyperactivity disorder (ADHD), reading performance, and mathematics performance. This diagram shows the full model (Model 1), in which the ADHD factor included all four measures of ADHD. The bottom half of the diagram shows the latent factor measurement model, with standardized factor loadings and residuals; the upper half shows an independent pathway model with variances and covariances among the factors decomposed into general and independent genetic (A), shared-environment (C), and nonshared-environment (E) influences. See the text for an explanation of the subscripts. ADHD was measured by the Inattention (In) and Hyperactivity/Impulsivity (H/Im) subscales of The Strength and Weaknesses of ADHD-Symptoms and Normal-Behavior scale (SWAN; Swanson et al., 2005) and by ratings of “attention to tasks” (Att) and “hyperactivity” (Hyp) on the Bayley Behavior Rating Scale (BBR; Bayley, 1993). Reading performance was measured by the Word Identification (Word ID) and Passage Comprehension (PC) subtests of the Woodcock Reading Mastery Tests (WRMT; Woodcock, 1987). Math performance was measured by the Applied Problems (AP), Quantitative Concepts (QC), Fluency, and Calculation (Calc) subtests of the Woodcock-Johnson III (WJ; Woodcock, McGraw, & Mather, 2001). Significant estimates are indicated by asterisks (*p < .05).
Specifically, Model 1 (presented in Fig. 1) defined the first factor of the measurement model as a General ADHD factor, which was composed of the SWAN Inattentiveness and Hyperactivity/Impulsiveness subscales and the two BBR items (attention to tasks and hyperactivity; factor loadings = .87, .89, .38, and .30, respectively). The second factor was Reading, which was composed of WRMT Word Identification and Passage Comprehension (factor loadings = .86 and .85, respectively). Finally, the third factor, Math, was composed of WJ Applied Problems, Quantitative Concepts, Fluency, and Calculation (factor loadings = .85, .90, .70, and .84, respectively). Model 2 defined the ADHD factor as Inattention, using the SWAN Inattention subscale and the BBR rating of attention to tasks. Model 3 defined the ADHD factor as Hyperactivity, using the SWAN Hyperactivity/Impulsivity subscale and the BBR rating of hyperactivity. The Reading and Math factors in Models 2 and 3 were identical to the corresponding factors in Model 1.
Quantitative genetic modeling
An independent pathway model was simultaneously applied to the measurement models just described (see Fig. 1 for Model 1). Quantitative genetic designs commonly focus on variance and covariance. Variance describes the individual differences on a given trait within a population, and covariance describes how the individual differences on a given trait may be associated with the individual differences on another trait. In other words, covariance is a measure of the degree to which two traits are related. Covariance is very similar to the more commonly used correlation statistic, but covariance uses an unstandardized metric, whereas correlation uses a standardized metric. Quantitative genetic methodology specifically allows for the variance and covariance among the measurement factors to be decomposed into identified components: biometric factors of genetics (the combined effect of all additive genetic effects, or A), shared environment (those environmental influences that make siblings more similar, or C), and nonshared environment (those environmental influences that make siblings unique, or E; Neale & Cardon, 1992).
The first set of biometric factors estimated in an independent pathway model (A1, C1, and E1) represented general overlapping genetic and environmental influences on the covariance among ADHD, Reading, and Math. Results from these factors were important to the fundamental question of the extent to which ADHD symptoms, reading performance, and math performance are affected by general genetic and environmental effects. The second set of biometric factors (A2, C2, and E2) estimated the genetic and environmental influences on the independent variance associated with ADHD. A3, C3, and E3 estimated the genetic and environmental effects on independent Reading-specific variance only, and A4, C4, and E4 estimated the independent variance associated with Math only. These independent pathways tested the extent to which ADHD, Reading, and Math were influenced by specific genetic and environmental factors, above and beyond those general genetic and environmental influences shared across ADHD, Reading, and Math. Genetic models were estimated using Mx with all available raw data; 95% confidence intervals were used to test for significance (Neale, Boker, Xie, & Maes, 2006). Age and sex were included as covariates in these analyses and were modeled concurrently using Mx. Tables 3 and 4 present the univariate genetic and environmental influences on each factor and the standardized path estimates (with 95% confidence intervals) for the three multivariate independent pathway models.
Table 3.
Univariate Estimates for Each Factor in the Independent Pathway Models From All Three Latent Factor Measurement Models
| Model and factor | h2 | c2 | e2 |
|---|---|---|---|
| Model 1 | |||
| General ADHD | .64 [.63–.95] | .30 [.01–.56] | .05 [.01–.11] |
| Reading | .63 [.57–.76] | .35 [.22–.47] | .03 [.00–.04] |
| Math | .18 [.10–.28] | .81 [.72–.88] | .01 [.01–.02] |
| Model 2 | |||
| Inattention | .66 [.20–.98] | .31 [.03–.65] | .03 [.01–.14] |
| Reading | .62 [.52–.74] | .35 [.23–.45] | .03 [.02–.08] |
| Math | .16 [.11–.29] | .81 [.71–.90] | .01 [.00–.01] |
| Model 3 | |||
| Hyperactivity | .74 [.43–.99] | .26 [.01–.57] | .00 [.00–.10] |
| Reading | .66 [.52–.81] | .31 [.18–.38] | .03 [.02–.07] |
| Math | .18 [.13–.24] | .81 [.73–.89] | .00 [.00–.00] |
Note: The table presents estimates for univariate heritability (h2), shared-environment (c2), and nonshared-environment (e2) influences on each latent factor. These estimates were derived from the independent pathway model presented in Table 4 and Figure 1 (95% confidence intervals are presented in brackets). Attention-Deficit/Hyperactivity Disorder (ADHD) was measured by the Inattention and Hyperactivity/Impulsivity subscales of The Strength and Weaknesses of ADHD-Symptoms and Normal-Behavior scale (SWAN; Swanson et al., 2005) and by ratings of “attention to tasks” and “hyperactivity” on the Bayley Behavior Rating Scale (BBR; Bayley, 1993). General ADHD included all four of these measures, Inattention included the SWAN Inattention subscale and BBR rating of attention to tasks, and Hyperactivity included the SWAN Hyperactivity/Impulsivity subscale and BBR rating of hyperactivity. The Reading factor included the Word Identification and Passage Comprehension subtests of the Woodcock Reading Mastery Tests (WRMT; Woodcock, 1987). The Math factor included the Applied Problems, Quantitative Concepts, Fluency, and Calculation subtests of the Woodcock-Johnson III (WJ; Woodcock, McGraw, & Mather, 2001).
Table 4.
Multivariate Independent Pathway Model Results From All Three Latent Factor Measurement Models
| Model and factor | A1 | A2 | A3 | A4 | C1 | C2 | C3 | C4 | E1 | E2 | E3 | E4 |
|---|---|---|---|---|---|---|---|---|---|---|---|---|
| Model 1 | ||||||||||||
| General ADHD |
.44 [.19–.44] |
.67 [.29–.87] |
— | — | .24 [.03–.42] |
.49 [.00–.67] |
— | — | .16 [.00–.33] |
.17 [.00–.30] |
— | — |
| Reading | .63 [.46–.87] |
— | .48 [.00–.63] |
— | .59 [.47–.67] |
— | .00 [.00–.25] |
— | .16 [.00–.23] |
— | .00 [.00–.24] |
— |
| Math | .33 [.18–.49] |
— | — | .26 [.00–.38] |
.90 [.89–.93] |
— | — | .00 [.00–.35] |
.09 [.00–.17] |
— | — | .00 [.00–.14] |
| Model 2 | ||||||||||||
| Inattention | .71 [.45–.95] |
.39 [.00–.81] |
— | — | .18 [.00–.31] |
.53 [.00–.69] |
— | — | .17 [.00–.37] |
.00 [.00–.29] |
— | — |
| Reading | .55 [.37–.83] |
— | .56 [.00–.66] |
— | .59 [.48–.69] |
— | .00 [.00–.29] |
— | .19 [.00–.31] |
— | .00 [.00–.16] |
— |
| Math | .36 [.23–.50] |
— | — | .22 [.00–.37] |
.90 [.84–.92] |
— | — | .00 [.00–.38] |
.08 [.00–.18] |
— | — | .00 [.00–.06] |
| Model 3 | ||||||||||||
| Hyperactivity | .32 [.22–.64] |
.80 [.54–.97] |
— | — | .19 [.00–.35] |
.47 [.00–.73] |
— | — | .00 [.00–.36] |
.00 [.00–.38] |
— | — |
| Reading | .73 [.45–.89] |
— | .36 [.00–.66] |
— | .56 [.43–.66] |
— | .00 [.00–.29] |
— | .16 [.00–.30] |
— | .00 [.00–.27] |
— |
| Math | .31 [.27–.43] |
— | — | .29 [.18–.29] |
.90 [.89–.92] |
— | — | .00 [.00–.20] |
.03 [.00–.08] |
— | — | .01 [.00–.04] |
Note: The table presents estimated coefficients for the genetic (A), shared-environment (C), and nonshared-environment (E) standardized pathways representing the covariance among the latent factors (with 95% confidence intervals in brackets). Attention-deficit/hyperactivity disorder (ADHD) was measured by the Inattention and Hyperactivity/Impulsivity subscales of The Strength and Weaknesses of ADHD-Symptoms and Normal-Behavior scale (SWAN; Swanson et al., 2005) and by ratings of “attention to tasks” and “hyperactivity” on the Bayley Behavior Rating Scale (BBR; Bayley, 1993). General ADHD included all four of these measures, Inattention included the SWAN Inattention subscale and BBR rating of attention to tasks, and Hyperactivity included the SWAN Hyperactivity/Impulsivity subscale and BBR rating of hyperactivity. The Reading factor included the Word Identification and Passage Comprehension subtests of the Woodcock Reading Mastery Tests (WRMT; Woodcock, 1987). The Math factor included the Applied Problems, Quantitative Concepts, Fluency, and Calculation subtests of the Woodcock-Johnson III (WJ; Woodcock, McGraw, & Mather, 2001).
We present first the results for Model 1, in which General ADHD was the first factor. The univariate genetic and environmental estimates (h2, c2, and e2) of the ADHD and Reading latent factors indicate moderate genetic effects (h2 = .64 and .63) and low shared environmental effects (c2 = .30 and .35). For the Math factor, genetic influences were low (h2 = .18), and shared environmental effects were high (c2 = .81). For all three factors, child-specific environmental effects were low.
The multivariate results from Model 1 suggested a general genetic factor underlying the ADHD, Reading, and Math factors, represented by significant path estimates from A1 (.44, .63, and .33). This result indicates that there were general genetic effects underlying the covariance among ADHD, Reading, and Math. Beyond the variance associated with the general genetic factor (A1), there were independent genetic influences on the ADHD factor (A2; .67). This path estimate suggests that 45% (.672) of the variance in the ADHD factor is associated with independent genetic effects. Furthermore, the general shared-environment factor, C1, suggests significant environmental overlap among all three factors (.24, .59, and .90). This implies that there are general environmental influences underlying the covariance among the factors, in addition to the general genetic effects. No other pathways were statistically significant, as evidenced by confidence intervals bounded by zero.
Results were similar for Model 2, in which Inattention was the first factor. We found moderate to high univariate estimates of heritability for the factors of Inattention and Reading (h2 = .66 and .62) and a low estimate for Math (h2 = .16). The univariate shared-environment estimates were low for Inattention and Reading (c2 = .31 and .35) and high for Math (c2 = .81). All univariate estimates of nonshared-environment influences were nonsignificant. The multivariate independent pathway results again suggested significant genetic covariance (A1) among all the factors (.71, .55, and .36). The C1 factor in this model indicated significant shared environmental overlap between Reading and Math only (.59 and .90). There were no latent-factor-specific significant influences in this model.
Finally, in Model 3 (Hyperactivity as the first factor), univariate estimates of genetic and environmental influences on the Hyperactivity, Reading, and Math factors were similar to the corresponding estimates in Models 1 and 2. As with the other models, the multivariate results suggested a significant general genetic factor (A1; .32, .73, and .31). Furthermore, the independent genetic pathways were significant for the Hyperactivity factor (A2; .80) and the Math factor (A4; .29). This indicates that beyond the general genetic influences (A1) underlying the covariance among the factors, 64% (.802) of the unique variance associated with the Hyperactivity factor and 8% (.292) of the unique variance associated with the Math factor can be attributed to independent genetic influences. Results for the general shared environmental factor (C1) suggest that the covariance among the factors of Reading and Math was driven by environmental effects shared within families (.56 and .90)
Discussion
This study is the first to examine ADHD symptoms, reading performance, and math performance simultaneously using a genetically sensitive design. Research on cognition has suggested that working memory deficits may underpin ADHD, as well as reading and mathematical difficulties (e.g., Rapport et al., 2008; Siegler, 1988), and these findings are consistent with our finding of overlapping genetic effects among all three constructs. Indeed, researchers have hypothesized that the association between ADHD and learning disabilities can be explained by general genetic influences (DuPaul & Volpe, 2009). Furthermore, general genetic effects are also consistent with the generalist-genes hypothesis, which posits a general genetic etiology across diverse learning disorders (e.g., Plomin & Kovas, 2005). That said, we also found significant independent genetic influences on ADHD symptoms outside of the general genetic effects, and a nonsignificant trend toward independent genetic influences on the reading and math outcomes. Our data suggest that there are unique genetic influences on ADHD symptoms that are not associated with reading or math performance, in keeping with the idea that ADHD does not co-occur consistently with learning disabilities (DuPaul & Volpe, 2009).
It is noteworthy that in addition to the general genetic etiology for ADHD symptoms, Reading, and Math, there was evidence for general shared-environmental influences among the three factors when ADHD was modeled as General ADHD. Rapport et al. (1999) hypothesized that one of the ways in which ADHD affects achievement is through a behavioral pathway. More specifically, they suggested that the behavioral pathway mediates the relationship between ADHD and academic performance through disruptive classroom behaviors. It may be the case that certain attentional and behavioral actions are required for a child to successfully learn during formal instruction. For example, sitting in a chair quietly during direct mathematics tutoring is a difficult attentional task, but is typically required for success. Indeed, research has suggested that environmental factors, such as study skills and academic engagement, are important mediators of the relationship between ADHD and achievement (Volpe et al., 2006).
Although all three models revealed very similar general genetic and environmental trends, the literature suggests that the Inattention and Hyperactivity factors should have influenced the academic outcomes differentially (Rabiner, Coie, & the Conduct Problems Prevention Research Group, 2000). For example, experimental results obtained by Massetti et al. (2008) indicated that only the inattentive symptoms of ADHD are associated with lower academic achievement. However, our results suggest that ADHD symptoms in general (i.e., not just inattention) and academic outcomes share similar influences of general genes and general shared environment. These may not be the same genetic and environmental influences, but the magnitudes of the effects are similar. Future work can more directly test this conclusion specifically.
In conclusion, this study is the first to examine the genetic and environmental etiology of the relationships among ADHD symptoms, reading performance, and math performance. Future research may begin to clarify not only the genetic processes but also the specific aspects of the shared environment that are associated with both poor academic outcomes and ADHD symptoms. A focus on causal explanations will be particularly useful. Such work can serve to inform future educationally based interventions, in that identification of these influences may be key in changing outcomes for these commonly co-occurring outcomes.
Acknowledgments
The authors wish to thank the twins and their families for making this research possible.
Funding
This work was supported by National Institute of Child Health and Human Development (NICHD) Grant HD38075 and NICHD/Department of Education Grant HD46167. The first author was supported by the Lucile and Roland Kennedy Scholarship Fund in Human Ecology from the Ohio State University, as well as the P.E.O. Scholar Award.
Footnotes
Declaration of Conflicting Interests
The authors declared that they had no conflicts of interest with respect to their authorship or the publication of this article.
References
- American Psychological Association. Diagnostic and statistical manual of mental disorders. Washington, DC; Author; 2000. (text rev.) [Google Scholar]
- Barry TD, Lyman RD, Klinger LG. Academic under-achievement and attention-deficit/hyperactivity disorder: The negative impact of symptom severity on school performance. Journal of School Psychology. 2002;40:259–283. [Google Scholar]
- Bayley N. Bayley scales of infant development: Manual. San Antonio, TX: Psychological Corp; 1993. [Google Scholar]
- Capano L, Minden D, Chen SX, Schachar RJ, Ickowicz A. Mathematical learning disorder in school-age children with attention-deficit hyperactivity disorder. Canadian Journal of Psychiatry. 2008;53:392–399. doi: 10.1177/070674370805300609. [DOI] [PubMed] [Google Scholar]
- Doyle AE, Faraone SV, DuPre EP, Biederman J. Separating attention deficit hyperactivity disorder and learning disabilities in girls: A familial risk analysis. American Journal of Psychiatry. 2001;158:1666–1672. doi: 10.1176/appi.ajp.158.10.1666. [DOI] [PubMed] [Google Scholar]
- DuPaul GJ, Stoner G. ADHD in the schools: Assessment and intervention strategies. New York, NY: Guilford Press; 2004. [Google Scholar]
- DuPaul GJ, Volpe RJ. ADHD and learning disabilities: Research findings and clinical implications. Current Attention Disorders Reports. 2009;1:152–155. [Google Scholar]
- Ebejer JL, Coventry WL, Byrne B, Willcutt EG, Olson RK, Corley R, Samuelsson S. Genetic and environmental influences on inattention, hyperactivity-impulsivity, and reading: Kindergarten to grade 2. Scientific Studies of Reading. 2010;14:293–316. doi: 10.1080/10888430903150642. [DOI] [PMC free article] [PubMed] [Google Scholar]
- Gayan J, Olson RK. Genetic and environmental influences on individual differences in printed word recognition. Journal of Experimental Child Psychology. 2003;84:97–123. doi: 10.1016/s0022-0965(02)00181-9. [DOI] [PubMed] [Google Scholar]
- Hart SA, Petrill SA, Thompson LA, Plomin R. The ABCs of math: A genetic analysis of mathematics and its links with reading ability and general cognitive ability. Journal of Educational Psychology. 2009;101:388–402. doi: 10.1037/a0015115. [DOI] [PMC free article] [PubMed] [Google Scholar]
- Kovas Y, Plomin R. Learning abilities and disabilities: Generalist genes, specialist environments. Current Directions in Psychological Science. 2007;16:284–288. doi: 10.1111/j.1467-8721.2007.00521.x. [DOI] [PMC free article] [PubMed] [Google Scholar]
- Light JG, DeFries JC. Comorbidity of reading and mathematics disabilities: Genetic and environmental etiologies. Journal of Learning Disabilities. 1995;28:96–106. doi: 10.1177/002221949502800204. [DOI] [PubMed] [Google Scholar]
- Markowitz EM, Willemsen G, Trumbetta SL, van Beijsterveldt TCEM, Boomsma DI. The etiology of mathematical and reading (dis)ability covariation in a sample of Dutch twins. Twin Research and Human Genetics. 2005;8:585–593. doi: 10.1375/183242705774860132. [DOI] [PubMed] [Google Scholar]
- Martinussen RM, Hayden JDC, Hogg-Johnson S, Tannock R. A meta-analysis of working memory impairments in children with attention-deficit/hyperactivity disorder. Journal of the American Academy of Child & Adolescent Psychiatry. 2005;44:377–384. doi: 10.1097/01.chi.0000153228.72591.73. [DOI] [PubMed] [Google Scholar]
- Massetti GM, Lahey BB, Pelham WE, Loney J, Ehrhardt A, Lee SS, Kipp H. Academic achievement over 8 years among children who met modified criteria for attention-deficit/hyperactivity disorder at 4–6 years of age. Journal of Abnormal Child Psychology. 2008;36:399–410. doi: 10.1007/s10802-007-9186-4. [DOI] [PMC free article] [PubMed] [Google Scholar]
- Monuteaux MC, Faraone SV, Herzig K, Navsaria N, Biederman J. ADHD and dyscalculia: Evidence for independent familial transmission. Journal of Learning Disabilities. 2005;38:86–93. doi: 10.1177/00222194050380010701. [DOI] [PubMed] [Google Scholar]
- Neale MC, Boker SM, Xie G, Maes HH. Mx: Statistical modeling. 7. Department of Psychiatry VCU; Box 900126, Richmond, VA 23298: 2006. Available from. [Google Scholar]
- Neale MC, Cardon LR. Methodology for genetic studies of twins and families. Dordrecht, The Netherlands: Kluwer Academic; 1992. [Google Scholar]
- Petrill SA, Deater-Deckard K, Thompson LA, Schatschneider C, DeThorne LS, Vandenbergh DJ. Longitudinal genetic analysis of early reading: The Western Reserve reading project. Reading and Writing. 2007;20:127–146. doi: 10.1007/s11145-006-9021-2. [DOI] [PMC free article] [PubMed] [Google Scholar]
- Plomin R, Kovas Y. Generalist genes and learning disabilities. Psychological Bulletin. 2005;131:592–617. doi: 10.1037/0033-2909.131.4.592. [DOI] [PubMed] [Google Scholar]
- Polderman TJC, Derks EM, Hudziak JJ, Verhulst FC, Posthuma D, Boomsma DI. Across the continuum of attention skills: A twin study of the SWAN ADHD rating scale. Journal of Child Psychology and Psychiatry. 2007;48:1080–1087. doi: 10.1111/j.1469-7610.2007.01783.x. [DOI] [PubMed] [Google Scholar]
- Rabiner D, Coie JD, the Conduct Problems Prevention Research Group Early attention problems and children’s reading achievement: A longitudinal investigation. Journal of the American Academy of Child & Adolescent Psychiatry. 2000;39:859–867. doi: 10.1097/00004583-200007000-00014. [DOI] [PMC free article] [PubMed] [Google Scholar]
- Rapport MD, Alderson RM, Kofler MJ, Sarver DE, Bolden J, Sims V. Working memory deficits in boys with attention-deficit/hyperactivity disorder (ADHD): The contribution of central executive and subsystem processes. Journal of Abnormal Child Psychology. 2008;36:825–837. doi: 10.1007/s10802-008-9215-y. [DOI] [PubMed] [Google Scholar]
- Rapport MD, Scanlan SW, Denney CB. Attention-deficit/hyperactivity disorder and scholastic achievement: A model of dual developmental pathways. The Journal of Child Psychology and Psychiatry and Allied Disciplines. 1999;40:1169–1183. [PubMed] [Google Scholar]
- Saudino KJ, Plomin R. Why are hyperactivity and academic achievement related? Child Development. 2007;78:972–986. doi: 10.1111/j.1467-8624.2007.01044.x. [DOI] [PMC free article] [PubMed] [Google Scholar]
- Shaywitz SE, Shaywitz BA, Makuch R, Fletcher JM, Escobar MD. Evidence that dyslexia may represent the lower tail of a normal distribution of reading ability. New England Journal of Medicine. 1992;326:145–150. doi: 10.1056/NEJM199201163260301. [DOI] [PubMed] [Google Scholar]
- Siegler RS. Individual differences in strategy choices: Good students, not-so-good students, and perfectionists. Child Development. 1988;59:833–851. [PubMed] [Google Scholar]
- Stevenson J, Asherson P, Hay D, Levy F, Swanson J, Thapar A, Willcutt E. Characterizing the ADHD phenotype for genetic studies. Developmental Science. 2005;8:115–121. doi: 10.1111/j.1467-7687.2005.00398.x. [DOI] [PubMed] [Google Scholar]
- Swanson J, Schuck S, Mann M, Carlson C, Hartman K, Sergeant J, et al. Categorical and dimensional definitions and evaluations of symptoms of ADHD: The SNAP and the SWAN ratings scales. 2005 Retrieved April 8, 2009, from http://www.adhd.net/SNAP_SWAN.pdf. [PMC free article] [PubMed]
- Volpe RJ, DuPaul GJ, DiPerna JC, Jitendra AK, Lutz JG, Tresco KE, Junod PV. Attention deficit hyperactivity disorder and scholastic achievement: A model of mediation via academic enablers. School Psychology Review. 2006;35:47–61. [Google Scholar]
- Willcutt E, Pennington BF, Chabildas NA, Olson RK, Hulslander JL. Neuropsychological analyses of comorbidity between RD and ADHD: In search of the common deficit. Developmental Neuropsychology. 2005;27:35–78. doi: 10.1207/s15326942dn2701_3. [DOI] [PubMed] [Google Scholar]
- Willcutt EG, Pennington BF, Duncan L, Smith SD, Keenan JM, Wadsworth S, et al. Understanding the complex etiologies of developmental disorders: Behavioral and molecular genetic approaches. Journal of Developmental & Behavioral Pediatrics. 2010;31:533–544. doi: 10.1097/DBP.0b013e3181ef42a1. [DOI] [PMC free article] [PubMed] [Google Scholar]
- Woodcock RW. Woodcock Reading Mastery Tests-Revised. Circle Pines, MN: American Guidance Service; 1987. [Google Scholar]
- Woodcock RW, McGraw KS, Mather N. Tests of achievement (Woodcock-Johnson III) Itasca, IL: Riverside; 2001. [Google Scholar]
- Zentall SS. Math performance of students with ADHD: Cognitive and behavioral contributors and interventions. In: Berch DB, Mazzocco MMM, editors. Why is math so hard for some children? Baltimore, MD: Paul H. Brookes; 2007. pp. 219–244. [Google Scholar]