Short abstract
During cryopreservation, ice forms in the extracellular space resulting in freezing-induced deformation of the tissue, which can be detrimental to the extracellular matrix (ECM) microstructure. Meanwhile, cells dehydrate through an osmotically driven process as the intracellular water is transported to the extracellular space, increasing the volume of fluid for freezing. Therefore, this study examines the effects of cellular presence on tissue deformation and investigates the significance of intracellular water transport and cell-ECM interactions in freezing-induced cell-fluid-matrix interactions. Freezing-induced deformation characteristics were examined through cell image deformetry (CID) measurements of collagenous engineered tissues embedded with different concentrations of MCF7 breast cancer cells versus microspheres as their osmotically inactive counterparts. Additionally, the development of a biophysical model relates the freezing-induced expansion of the tissue due to the cellular water transport and the extracellular freezing thermodynamics for further verification. The magnitude of the freezing-induced dilatation was found to be not affected by the cellular water transport for the cell concentrations considered; however, the deformation patterns for different cell concentrations were different suggesting that cell-matrix interactions may have an effect. It was, therefore, determined that intracellular water transport during freezing was insignificant at the current experimental cell concentrations; however, it may be significant at concentrations similar to native tissue. Finally, the cell-matrix interactions provided mechanical support on the ECM to minimize the expansion regions in the tissues during freezing.
Keywords: cryopreservation, freezing-induced deformation, cell image deformetry, cellular water transport, tissue engineering, extracellular matrix
Introduction
Cryopreservation can provide long-term storage of various biological tissues, which has significant impact on tissue engineering and regenerative medicine. For successful cryopreservation of tissues, tissue functionality including physical properties such as mechanical, optical, and transport properties, as well as cellular viability must be maintained. These functional properties are associated with the microstructure of the extracellular matrix. The ECM provides the structural architecture for tissues and plays a critical role in the tissue physiology through cell-matrix interaction and interstitial fluid transport. These functions regulate cell morphology and growth [1,2] and intercellular signaling [3]. Additionally, the cell-matrix interaction provides a source of ECM remodeling and wound healing [4,5]. Thus, the preservation of the ECM microstructure is critical to successfully cryopreserve functional tissues [6,7].
During cryopreservation, ice formation occurs in both the intracellular and extracellular spaces. This ice formation has been thought to be a cause of the damage to the cells and the original ECM microstructure post-thaw. The intracellular ice formation and its impact on cellular viability have been extensively studied as reviewed elsewhere [8–11]. Extracellular ice formation has been examined to quantify the water transport (i.e., cellular dehydration) during freezing and only recently has begun to be studied for its impact on the physiological structure [6,12–14]. Its impact on the post-thaw microstructure of tissues and the extent of structural damage have been examined using magnetic resonance imaging, multiphoton-induced autofluorescence and second harmonic generation microscopy, or histological analysis [15–18]. A few studies reported successful preservation of tissue functionality, including the structure of collagen and elastin in aortic and pulmonary valves, and electrochemical and biomechanical properties of articular cartilage [6,19]. However, there are still many other studies reporting changes of these properties [18,20–22]. Mechanistic understanding of changes in ECM structure during freezing and thawing is required to address this challenge.
Recent studies have suggested that freezing induces a spatiotemporal redistribution of interstitial fluid and subsequent ECM swelling, which contribute to changes in the microstructure of the ECM [23–25]. A theoretical model based on a poroelastic material theory was also proposed to correlate the redistribution of interstitial fluid with ECM swelling during freezing [23]. In addition, this freezing-induced deformation of tissues has been measured by a new experimental technique, cell image deformetry, using an engineered tissue construct made up of quantum dot-labeled human dermal fibroblasts in a collagen matrix [25]. In a later study, a biophysical mechanism of the cell-fluid-matrix interaction and its effect on freezing-induced deformations were proposed and further studied by changing cell density and the collagen content of the engineered tissue (ET) [24]. The results showed that an increase in cell density significantly affected the rate of deformation during freezing [24].
In the freezing-induced cell-fluid-matrix interaction, cells were thought to decrease the freezing-induced deformation by providing additional mechanical support via cell-matrix adhesion, while simultaneously increasing deformation by supplying excess water via osmotic pressure-driven cellular water transport during freezing. However, the contribution of cell-ECM adhesion or cellular water transport to the freezing-induced tissue deformation could not be delineated in the previous study [24]. This was mainly due to active fibroblast-driven ECM remodeling during the sample preparation, including ECM contraction and collagen synthesis [4,5]. These cell-matrix interactions prior to the freeze/thaw (F/T) experiments resulted in unintentionally varied ECM microstructure and properties. The present study, thus, aims to investigate the significance of these two competing mechanisms in freezing-induced cell-fluid-matrix interactions. The resulting understanding will lay a mechanistic groundwork to address cell- and tissue- specific outcomes of cryopreservation originating from the extent of cell-ECM adhesion and cellular water transport.
In this study, the effects of the presence of cell-ECM adhesion and cellular water transport on freezing-induced deformation are investigated both experimentally and theoretically. Experiments were conducted with two different types of model engineered tissues: (1) ETs with human breast cancer cells (MCF7) and (2) ETs with polystyrene beads. The MCF7 cells were selected for this study because they minimally remodel the ECM including minimal synthesis of collagen [26] and minimal contractile forces on the ECM, unlike the fibroblast examined previously. The microspheres, whose size was similar to the MCF7 cells, were selected to simulate osmotically inactive cells without cell-ECM adhesion. Therefore, it became possible to decouple the effects of cellular water transport from cell-matrix interactions. Freezing-induced deformation characteristics of both ETs were measured by the CID method during directional freezing and compared to delineate the significance of cell-ECM adhesion and cellular water transport.
For theoretical analysis, a biophysical model relating the freezing-induced expansion of the tissue due to the cellular water transport and the extracellular freezing thermodynamics was developed. First, the freezing response of MCF7 cells in suspension was observed by cryomicroscopy, and the membrane permeability parameters were estimated with similar methods used in previous studies [25,27–29]. In addition, the latent heat release of the engineered tissue was measured by differential scanning calorimetry (DSC) to estimate the rate and extent of extracellular ice formation within the ET. Finally, the cellular water transport and extracellular ice formation data were combined to estimate the freezing-induced dilatation using the biophysical model. The model was used to qualitatively verify the results of the CID experiments and to explore the effects of cellular water transport at ultrahigh cell concentrations corresponding to native tissues that were not possible to investigate experimentally.
Materials and Methods
Cell Culture and Reagents.
A human breast carcinoma cell line (MCF7) was maintained in culture medium (DMEM/F12, Invitrogen, Grand Island, NY) with 5% fetal bovine serum, 2 mM L-glutamine, 100 μg/ml penicillin/streptomycin, and 10 μg/ml insulin. The MCF7 cells were cultured in 20 ml of supplemented culture medium in 75 cm2 T-flasks at 37 °C and 5% CO2. Cells were collected by using 0.05% trypsin and 0.53 mM ethylenediaminetetraacetic acid.
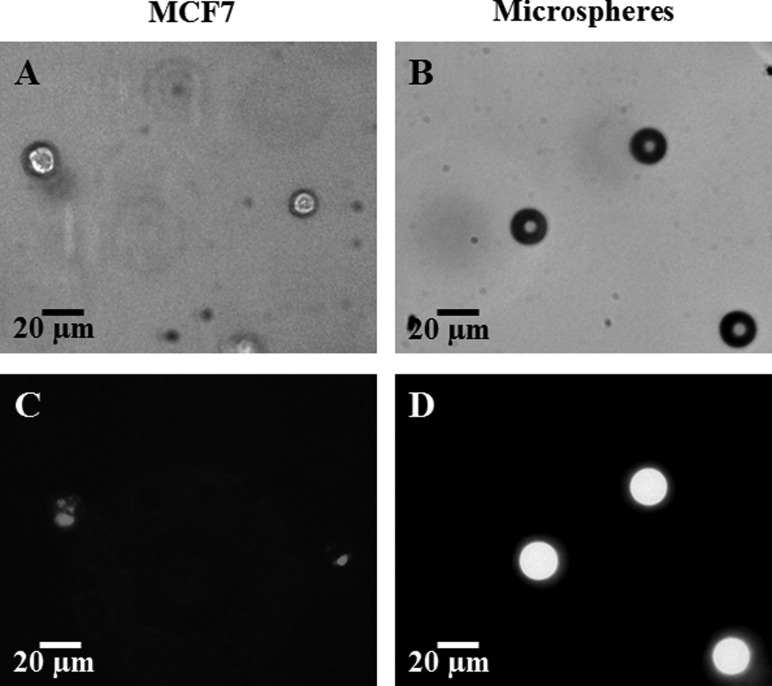
The collected cells were labeled with quantum dots (Qtracker 655, Invitrogen, Carlsbad, CA) as shown in Fig. 1 and previously described in Ref. [25] with adjustment of the cellular uptake incubation time by increasing it to 1 h at 37 °C.
Fig. 1.
MCF7 cells (left column, (a) and (c)) and Fluoresbrite® YG Microspheres (right column (b) and (d)) embedded in engineered tissues. Images (a) (MCF7 cells) and (b) (microspheres) are imaged with the bright field of a confocal microscope (Olympus IX71). Images (c) and (d) are fluorescent images, the MCF7 embedded QDs, (c), imaged with the TRITC filter and the microspheres, (d), imaged with the FITC filter.
Microspheres (Fluoresbrite® YG Microspheres, Polysciences, Inc., Warrington, PA), shown in Fig. 1, with a 20 μm diameter were used as osmotically-inactive and cell-matrix adhesionless spheres in place of the osmotically-active MCF7 cells.
Engineered Tissues.
The quantum dot-labeled cells were suspended in a 2 ml collagen solution made from high concentration type 1 rat tail collagen (BD Biosciences, Bedford, MA) such that 3 mg/ml was the final collagen concentration as described previously [25]. The collagen solution contained 10% 10X MEM, 30 mM Hepes, 10 μg/ml penicillin/streptomycin, 2 mM L-glutamine, 6% fetal bovine serum, and 2.3% 1 N sodium hydroxide with distilled water to make a final volume of 2 ml. The final cell and microsphere concentrations were such that each collagen solution contained 2 × 10⁵ cells or microspheres/ml for the normal cellular concentration. Additional cellular concentrations consisted of 4 × 10⁵ cells/ml (referred to as doubled cellular concentration) and 8 × 10⁵ cells/ml (referred to as quadrupled cellular concentration). As previously described [25], the collagen solution was placed in a chamber slide (Lab-Tex II, Nunc, Naperville, IL) and allowed to polymerize at 37 °C for 1 h. After this, 2 ml of supplemented medium was added, and the ET was incubated for 24 h before freezing.
Cell Image Deformetry During Freezing.
Tissue deformation during freezing was quantified using the cell image deformetry technique. As a brief description of the CID method, the ETs with quantum dot-labeled cells or fluorescent microspheres were frozen on a temperature-controlled stage with two separately controlled temperature reservoirs separated by a 6 mm gap. The temperature reservoirs were maintained at −20 °C and 4 °C to induce a temperature gradient across the 6 mm gap in the x-direction. During the induced freezing, successive fluorescence images were obtained using a fluorescene macro/microscope (MVX10, Olympus, Center Valley, PA) with 2× magnification. Images were obtained at an interval of 1 s with a high sensitivity CCD camera (Qimaging Retiga 2000 R). The images were then cross-correlated with a 10 s interval and divided into 32 × 32 pixel interrogation windows using DaVis 7.1 software (LaVision) to calculate the deformation rates in the x and y directions at each window in the image plane. The deformation rates were then used to calculate the dilatation as follows:
| (1) |
where u and v are the calculated deformation rates (μm/s) in the x and y directions, respectively.
Measurement of MCF7 Cellular Water Transport Using Cryomicroscopy.
The MCF7 cells in suspension were frozen by a temperature-controlled stage (Linkam, MDS 600) while being imaged by a microscope (Olympus, BX 51) equipped with a CCD camera (Retiga 2000 R). Cell concentrations in this study ranged from 2 × 10⁵ to 1 × 10⁶ cells/ml, such that cell-to-cell separation distances were large (cytocrit < 0.003), and cell concentration was not expected to have an effect on water transport [30]. In order to facilitate ice formation within the whole temperature range of interest, the sample was initially cooled to −2 °C, and ice was seeded by touching the edge of the sample with a liquid nitrogen-cooled needle. Afterwards, the temperature was raised by 0.9–1.2 °C and kept constant at just below the phase change temperature for 3–5 min to obtain small, round ice crystals in equilibrium with the extracellular medium. In the next step, the temperature was decreased at a controlled rate down to −40 °C. The cooling rates employed in this study were 5, 10, and 30 °C/min, which were similar or slightly higher than the cooling rates observed in the CID experiments (2–8 °C/min). For analysis, the projected cell area Ap was quantified using image processing software (NIH, ImageJ) at selected temperatures. Then the cell volume V was estimated by assuming spherical geometry and using the relation: . For each cooling rate, 28–81 cells were analyzed. The osmotically inactive volume of MCF7 was estimated through an equilibrium cooling procedure, in which the sample was cooled at a slow rate, i.e., 2 °C/min, to −40 °C while holding at intermediate temperatures: −5, −10, −15, −20, −30 °C for 5 min.
Estimation of Membrane Permeability Parameters.
The analysis of MCF7 cellular water transport follows previous studies, e.g., [28,29,31], that are based on the osmotic water transport model of Mazur [32] with some modifications by Levin et al. [33]. Briefly, the rate of change of the cell volume is given by
| (2) |
where the cell membrane permeability to water was assumed to depend on temperature only, and the temperature dependence was modeled by the Arrhenius equation as follows:
| (3) |
The membrane permeability parameters investigated in this study were , the membrane permeability at the reference temperature, and , the activation energy for osmotic water transport across the membrane. The definitions of the other symbols used in Eqs. (2) and (3) are provided in Table 1.
Table 1.
Definitions of the symbols used in osmotic water transport equations
| Symbol | Definition | Value | Unit |
|---|---|---|---|
| Cell volume | Variable | μm3 | |
| Initial cell volume | 2978 ± 127 | μm3 | |
| Osmotically inactive cell volume | (0.31 ± 0.02) | μm3 | |
| Cell surface area | Variable | μm2 | |
| Temperature | Variable | K | |
| Reference temperature | 273.15 | K | |
| Latent heat of fusion | 335 | kJ/kg | |
| Universal gas constant | 8.314 | J/mol/K | |
| Cooling rate | Variable | °C/min | |
| Partial molar volume of water | 1.8 × 10¹³ | μm3/mol | |
| Dissociation constant of salt | 2 | — | |
| Number of moles of salt in the cell | 3.031 × 10⁻¹³ | mol | |
| Membrane permeability for water | Variable | μm3/N/s | |
| Membrane permeability for water at | Estimated Parameter | μm3/N/s | |
| Activation energy for membrane water transport | Estimated Parameter | kJ/kg |
In order to estimate the membrane permeability parameters, the prediction of the model was fitted to the experimental data by nonlinear least-squares curve fitting. As a result, an optimal pair of parameters was obtained by minimizing the squared sum of the difference between the experimental data and the model prediction. A matlab ® routine based on the Levenberg–Marquardt algorithm [34] was used for this purpose.
Measurement of Latent Heat Release by Differential Scanning Calorimetry.
The rate of latent heat release by the engineered tissue was determined as a function of temperature using a differential scanning calorimeter (DSC Q200, TA Instruments, New Castle, DE). Engineered tissues were prepared as described before. Then, gel sections with a diameter of approximately 2 mm were extracted by a biopsy punch and transferred to DSC pans. The sample pans were sealed hermetically to avoid any leakage of volatile components. The resulting sample masses were 5–6 mg. The sample was initially cooled to −30 °C to nucleate and warmed close to the phase change temperature. Then, the sample was thermally equilibrated to have only a small amount of ice crystals. This step ensured the presence of ice growth sites in the sample prior to freezing and prevented the spontaneous ice nucleation that would otherwise invalidate the measurements. The sample was then slowly cooled to −30 °C with a cooling rate of 1 °C/min, which was considered to be reasonably slow enough to avoid supercooling and approximate thermodynamic equilibrium conditions. The rate of latent heat release was recorded as ice formed gradually in the sample. Three (n = 3) repetitions were performed. To account for sensible heat effects and equipment flaws, a linear baseline was constructed using the data points at temperatures −20 °C and −25 °C, and extrapolated to the temperature range of interest. The rate of latent heat release was obtained by subtracting the baseline from the overall DSC signal.
Theoretical Analysis
Determination of the Rate and Extent of Extracellular Freezing.
In order to quantify the extent of extracellular ice formation, the frozen fraction F was defined as the ratio of the volume of extracellular fluid that has formed ice to the total volume of the extracellular fluid
| (4) |
For slow cooling rates, the freezing proceeds close to thermodynamic equilibrium and both the rate of latent heat release and the frozen fraction can be considered as functions of temperature only, i.e., and , respectively. Then the temperature rate of change of the frozen fraction is related to the latent heat release as follows:
| (5) |
Here, is the time rate of latent heat release measured by the DSC, and is the total amount of latent heat release calculated by integrating with respect to time. B is the cooling rate imposed by the DSC on the sample. F was obtained by integrating Eq. (5) with respect to temperature accordingly. It should be noted that the analysis was performed by normalizing the DSC measurements with the value of latent heat of fusion (276.4 ± 1.4 kJ/kg) so that the results are independent of the value of latent heat.
Analysis for the Estimation of the Freezing-Induced Dilatation.
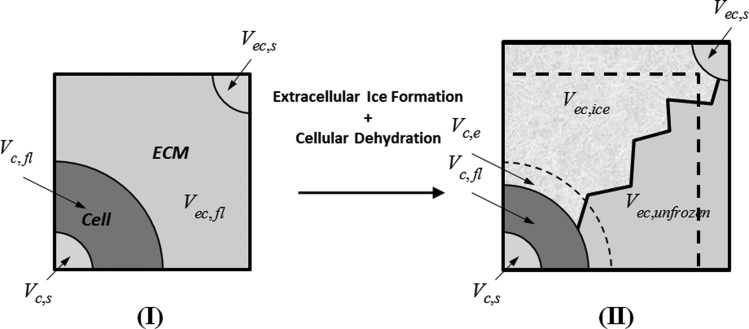
This section presents a representative elementary volume (REV) analysis to describe the freezing- induced dilatation as a function of extracellular ice formation and cellular dehydration dynamics. Figure 2 shows a schematic illustration of the REV, which stands for a small volume representing the whole of the engineered tissue. States (I) and (II) correspond to times before and during extracellular freezing, respectively. The ET is composed of cellular and extracellular compartments, as indicated by subscripts (c) and (ec) in Fig. 2. Each compartment is associated with a solid (s) part that corresponds to all intracellular solutes, structures, and organelles in the cell and extracellular solutes and collagen fibrous network in the extracellular space. Each compartment also has a fluid (fl) part standing for the intracellular and interstitial water surrounding the solid parts. The engineered tissue is assumed to be fully saturated with the interstitial fluid.
Fig. 2.
Schematic illustration of the representative elementary volume of an engineered tissue. States (I) and (II) correspond to before and during extracellular freezing. The ET is composed of cellular (c) and extracellular (ec) compartments. Each compartment has both solid (s) and fluid (fl) components. As ice forms in the extracellular space, cells dehydrate and make more water available for extracellular freezing. In the meantime, the extracellular space expands increasing the volume of the REV.
The modeling of the freezing process follows from the following reasoning: as ice forms in the extracellular space, cells dehydrate and make more water available for extracellular freezing. Meanwhile, the extracellular space expands increasing the volume of the REV. Here the effects of intracellular ice formation are not taken into account. Furthermore, the REV is assumed to be a material volume such that no mass flux occurs through its boundaries. Thus, the dilatation is caused by thermodynamic expansion only, and the redistribution of interstitial fluid due to interstitial pressure gradients across the ET is neglected in the analysis. Those assumptions are in accordance with the main purpose of this model, which is to study the significance of cellular water transport rather than simulating the spatiotemporal deformation of the ET.
The frozen fraction can also be expressed in terms of the variables in Fig. 2 as follows:
| (6) |
where is the volume of interstitial fluid that undergoes freezing, is the volume of ice that forms during this process, and and stand for the densities of ice and interstitial fluid (water), respectively. Furthermore, some portion of the cellular water becomes available for freezing, as it is excluded to the extracellular space by cellular dehydration. The volume of this excess water is represented by in Fig. 2.
Using Eq. (6), the volume of the REV at an arbitrary time during freezing can be written in terms of the initial (unfrozen) volume, frozen fraction, and excess water as follows:
| (7) |
where is the relative density difference between the fluid and ice. Here, it was assumed that the volumes of the solid parts remain the same during freezing. The superscript (II) over was dropped for brevity. Thus, the freezing-induced dilatation of the ET can be determined as follows:
| (8) |
where is the initial (unfrozen) porosity, is the initial cell concentration, and is the amount of water excluded per cell. As a result, the freezing-induced dilatation is expressed by Eq. (8) as a function of the tissue properties—initial porosity and cell concentration—as well as the freezing conditions—frozen fraction, the rate of ice formation, the amount of water excluded to the extracellular space from cells, and the rate of this water exclusion [35].
Statistical Analysis.
Single factor analysis of variance (ANOVA) was performed for testing for differences in means of different experimental groups. Multiple comparisons were performed by the Tukey range test, and the differences were considered significant for p < 0.05. All experimental data are presented in the form: mean ± standard error of the mean.
Results
Deformation of ETs With Osmotically Active Cells and Osmotically Inactive Microspheres.
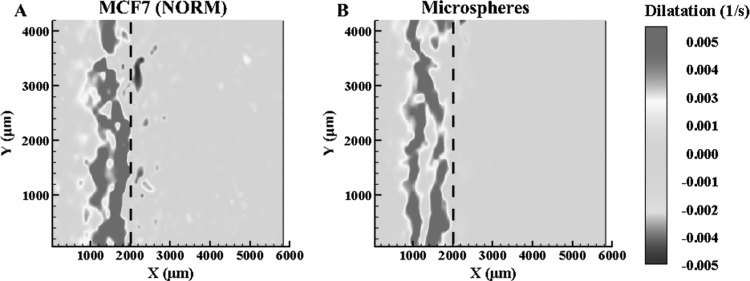
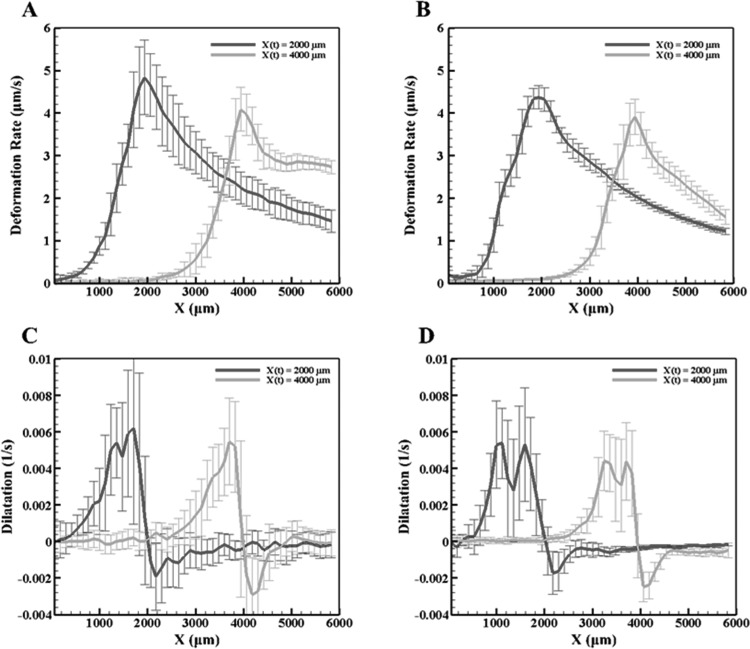
Figure 3 depicts the dilatation rates of the normal concentration MCF7 (2 × 10⁵ cells/ml) and microsphere ETs when the freezing interface reaches location X(t) = 2000 μm from the −20 °C platform. As previously observed [24], there is expansion behind and compression prior to the frozen interface due to ice formation. The y-averaged deformation rates, in Fig. 4, for both the MCF7 and the microsphere ETs reach a maximum rate at the interface. Further comparing the dilatation, Fig. 4, when X(t) = 2000 μm and X(t) = 4000 μm, the MCF7 cellular ET had a maximum dilatation of approximately 0.006 s−1 and minimum of approximately −0.002 s−1. As for the microsphere ETs, the maximum dilatation was approximately 0.005 s−1 and a minimum of −0.002 s−1 with the freezing front at the same locations. The dilatation rates for the MCF7 cells and microspheres are thus similar for both expansion as well as compression, differing by approximately 0.001 s−1. However, the dilatation has two well-defined expansion peaks for the microsphere ET compared to normal concentration MCF7, which contains one maximum peak with the presence of a smaller peak closer to the maximum peak.
Fig. 3.
Dilatation (n ≥ 3) of normal MCF7 concentration (a) and microsphere ETs (b) at X(t) = 2000 μm
Fig. 4.
The y-averaged deformation (top row) and dilatation rates (bottom row) at X(t) = 2000 μm and 4000 μm for (a) and (c) the normal MCF7 cell concentration and (b) and (d) the microspheres
Deformation of ETs With Osmotically Active Cells at Higher Cellular Concentrations.
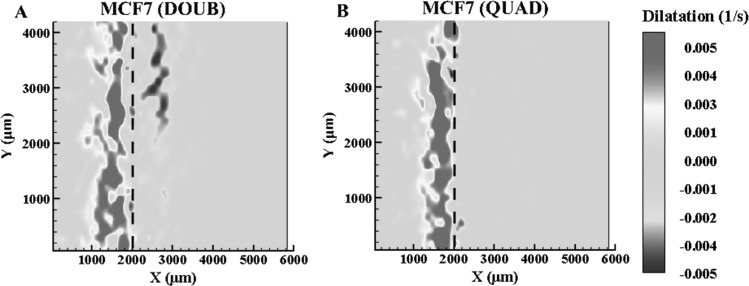
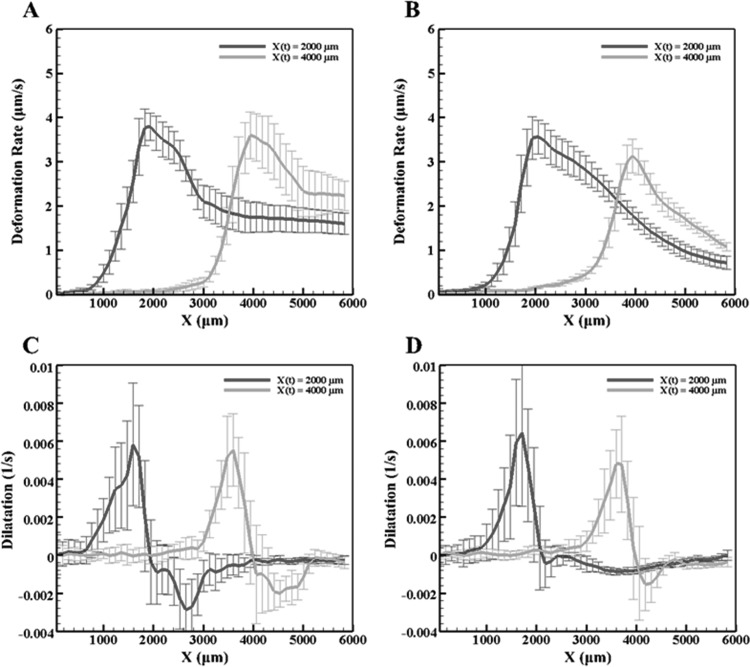
In order to further understand the effects of cellular presence within the ET, the cellular concentrations were increased to double and quadruple the normal cellular concentration. The dilatations when X(t) = 2000 μm are shown in Fig. 5 for both cases. Again, the maximum deformation rate occurs at the interface, while the dilatation shows expansion behind the interface due to ice formation and a slight compression before the interface. Figure 6 plots the y-averaged deformation rates and dilatation for both the doubled and quadrupled concentrations. For X(t) = 2000 μm, the maximum dilatation rate is approximately 0.006 s−1 for both higher cellular concentrations. This is similar to both the normal concentration and the microspheres, indicating that ET deformation during freezing in all four cases is the same. Comparing the MCF7 ETs, as the concentration increased, the overall maximum deformation rate, shown in Figs. 4 and 6, decreases. There are also differences in the shape of the overall dilatation patterns. First, as the cellular concentration increased, a noticeable change in the y-averaged dilatation slopes occurred, as shown Figs. 4 and 6. As the concentration increased, the y-averaged slopes became higher indicating a thinner region of dilatation. Further, examining Figs. 4 and 6, there is a loss of the double expansion peak, shown in both the normal concentration of MCF7 cells and microspheres, as the cell concentration increased. Additionally, there is a reduction in the magnitude of compression in front of the interface at the highest MCF7 concentration.
Fig. 5.
Dilatation (n ≥ 3) of doubled MCF7 concentration (a) and quadrupled MCF7 concentration ETs (b) at X(t) = 2000 μm
Fig. 6.
The deformation (top row) and dilatation rates (bottom row) at X(t) = 2000 μm and 4000 μm averaged along the y-axis for (a) and (c) the doubled MCF7 cell concentration and (b) and (d) the quadrupled MCF7 cell concentration
MCF7 Cellular Water Transport During Freezing.
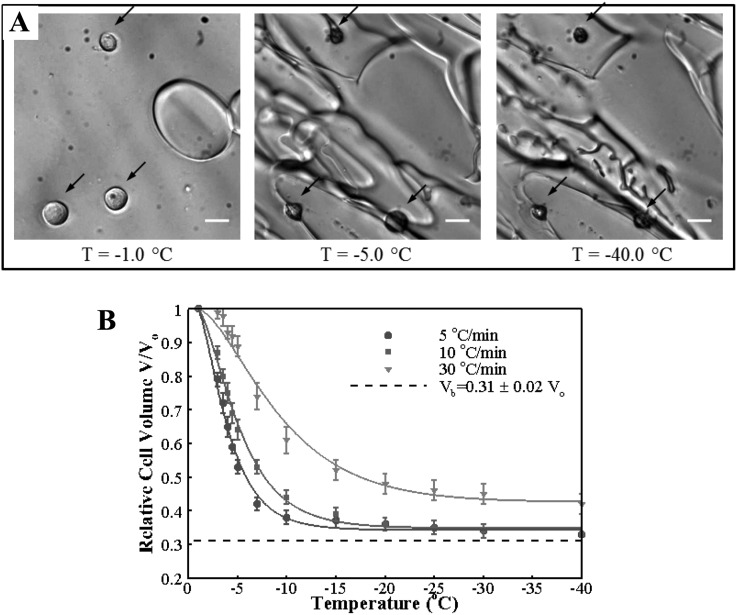
Cellular dehydration of MCF7 caused by freezing-induced water transport is presented in Fig. 7. Representative cryomicroscopy images are shown in Fig. 7(a). The MCF7 cells are initially at osmotic equilibrium with the extracellular solution, which contains only a few small round ice crystals. As the sample is cooled, the ice crystals rapidly grow, and the cells dehydrate significantly to reestablish osmotic equilibrium. The dehydration continues but at a slower pace as the sample is cooled further to −40 °C. Predictions and measurements of the change of cell volume with respect to the isotonic volume with decreasing temperature are shown in Fig. 7(b). The MCF7 dehydrates significantly for slow cooling rates: 5 °C/min and 10 °C/min and attains a volume close to the osmotically inactive cell volume, which was determined to be by equilibrium cooling experiments. This value is similar to ones reported for other cell lines [28,36]. For the 30 °C/min cooling rate, about 10% of the freezable water was trapped in the cell. The differences in the end volumes observed for different cooling rates suggest that the resistance to cellular water transport, which can be considered to originate from the plasma membrane as well as the cytoplasm, depends on temperature and/or the cooling rate. Similar results were obtained in previous studies [28,37].
Fig. 7.
Cellular water transport during freezing. (a) Representative cryomicroscopy images of MCF7 cells dehydrating during freezing with the cooling rate of 10 °C/min. The locations of cells are indicated by dark arrows. Scale bar is 20 μm (b) change of cell volume with decreasing temperature for the three cooling rates. The error bars stand for the standard error of the mean. Solid lines are model predictions with the optimal membrane permeability parameters.
Extracellular Freezing Thermodynamics of Engineered Tissues.
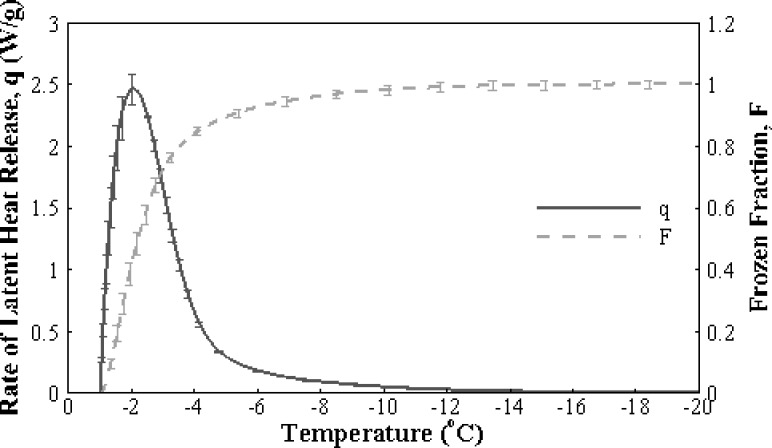
The freezing thermogram showing the rate of latent heat release with decreasing temperature is provided in Fig. 8. As explained in Eqs. (4) and (5), when normalized by the total latent heat release and integrated with respect to time, this signal gives the frozen fraction as shown in the same figure. Since the rate and extent of extracellular ice formation were similar for all groups (p > 0.05), only the case with microspheres is presented here for convenience. It can be observed that ice formation is rapid with more than 80% of the ice forming before the temperature reaches −5 °C. This observation is consistent with the cryomicroscopy results showing that a significant portion of the dehydration occurs within that temperature range.
Fig. 8.
Extracellular freezing thermodynamics of engineered tissues. Rate of latent heat release (solid line) and the frozen fraction calculated by cumulative integration of the rate of latent heat release with respect to time (dashed line).
Theoretical Analysis of Freezing Dilatation of Engineered Tissues.
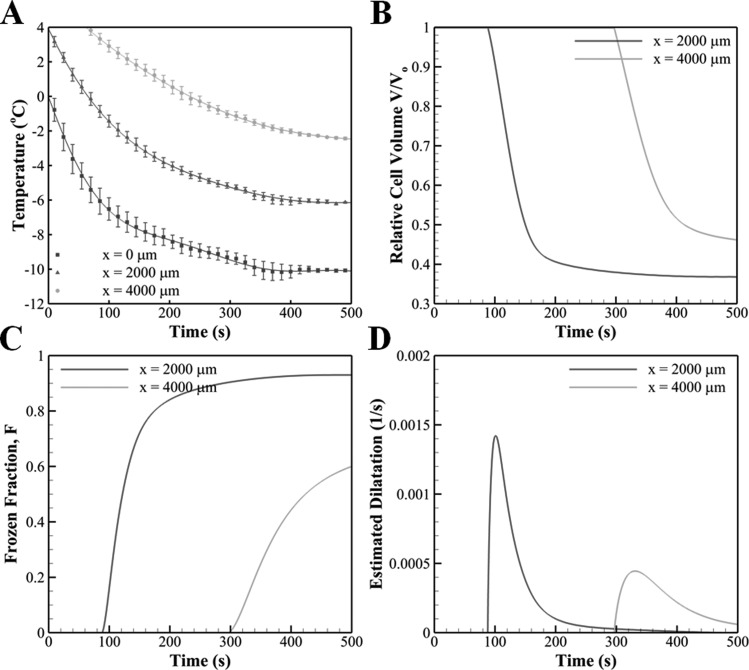
The directional freezing of engineered tissues results in a slow freezing process with peak cooling rates less than 6 °C/min near the cold base (x = 0 mm), as shown in Fig. 9. Based on the temperature profiles, the change in the amount of water in the cell and the frozen fraction of the extracellular medium with time were computed for two axial locations, x = 2000 and 4000 μm, and are shown in Fig. 9. The extent of water transport, Fig. 9(b), is greater for x = 2000 μm since that region is exposed to freezing temperatures for a longer period of time than for x = 4000 μm. The ice formation also occurs faster at x = 2000 μm as can be seen from the slope of the frozen fraction, Fig. 9(c). This is mostly due to higher cooling rates observed at this location when compared to x = 4000 μm, which is farther away from the cold terminal. This trend also appears in the estimation of freezing-induced dilatation that is shown in Fig. 9(d). As the local temperature is below the phase change temperature, an expansion is predicted with a rate that increases rapidly, attains a peak, and decreases gradually. Since both cellular water transport and extracellular ice formation are favored at locations close to the cold terminal, the engineered tissue undergoes a more rapid expansion at x = 2000 μm than at x = 4000 μm. This result agrees well with the experimental result shown in Figs. 3–6, in which the maximum dilatation is observed right after the freezing interface. However, the magnitudes of the estimated maximum, 0.0015 s−1 at x = 2000 μm and 0.0005 s−1 at x = 4000 μm, are significantly smaller than that of the measured ones, i.e., 0.006 s−1. The estimated dilatation trends for microspheres, and normal, doubled, and quadrupled cell concentrations were found to be indistinguishable at the scale of Fig. 9(d). This result is consistent with the observations of the experiments that none of the groups was significantly different from the others in terms of the maximum dilatation that occurs behind the freezing interface.
Fig. 9.
(a) Temperature measurements obtained at different axial distances from the cold terminal. The underlying lines are polynomial curve fits that were used in the analysis for the estimation of freezing-induced dilatation (Pearson coefficient of correlation R2 > 0.99 for each case). The temporal trends of (b) cellular water transport, (c) extracellular ice formation, and (d) estimated freezing-induced dilatation at two axial locations, x = 2000 μm and x = 4000 μm.
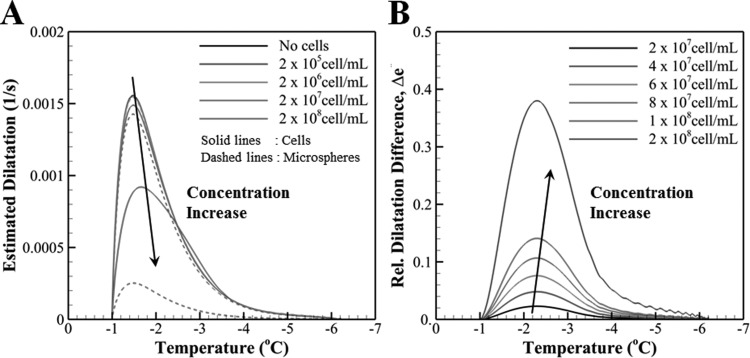
Figure 10(a) shows the effects of the concentration of cells and microspheres on estimated freezing-induced dilatation. It is readily seen that the magnitude of freezing-induced dilatation remains approximately the same for concentrations less than but starts to decrease appreciably with further increase in the concentrations of both cells and microspheres. The amount of decrease in dilatation with increasing concentrations is different for the two groups. This distinction, which is solely due to cellular water transport, was quantified by defining a relative difference between the dilatation of the cell and microsphere groups as follows:
Fig. 10.
(a) The variation of estimated freezing-induced dilatation with decreasing temperature for different concentrations of cells and microspheres. Solid lines correspond to ETs with cells while dashed lines correspond to ETs with microspheres. (b) The variation of relative difference of freezing-induced dilatation between the cells versus microsphere ETs with decreasing temperature. Unlike the actual experimental settings, this analysis assumes the sphere diameter to be the same as the diameter of the MCF7 cells in order to isolate the effects of cellular water transport from differential size effects.
| (9) |
where stands for the maximum dilatation observed for the cell group and for a given concentration. Figure 10(b) shows the variation of with temperature at various cell concentrations. It is noted that the relative contribution of cellular dehydration to the dilatation becomes larger with increasing concentration, and it can account for nearly half of the deformation for tissues densely packed with cells.
Discussion
Deformation of ETs With Osmotically Active Cells and Osmotically Inactive Microspheres.
Since fibroblasts, employed in the previous studies [24,25], significantly remodel both the ECM microstructure and macroscopic appearance of the ETs during the incubation, it is difficult to isolate the two phenomena. While examining the dilatation measurements shown in Figs. 4 and 6, it was noticed that the maximum dilatation remained approximately the same regardless of the experimental group. This indicates that the different groups experience similar deformations during induced freezing. The similar deformations in turn suggest that ice formation induced similar strains on the ETs. However, upon further examination of the dilatation characteristics (Figs. 3 and 5), the overall pattern of dilatation within the temperature gradient was different for each group. It has been reported [24] that the magnitude of freezing-induced deformation increased as the cell concentration increased in engineered dermal equivalents. Based on the present results, this increase is thought to be mainly caused by remodeled ECM by fibroblasts. Using the MCF7 cell line provides a cellular model that limits any cell-driven matrix remodeling [38] while providing a membrane that permits water transport through osmosis. The pattern, not the magnitude, of the dilatation changed with the MCF7 concentration or the presence of the osmotically inactive microspheres, suggesting that at these concentrations, water transport from the intracellular to the extracellular matrix is not significant due to only a deformation rate decrease of approximately 1 μm/s, as shown in Fig. 4. However, the pattern changes as the cellular interaction increases from no interaction with the microspheres to the highest cellular interaction due to the highest MCF7 cell concentration. In particular, the width of the expansion region decreases leading to a thin, single peak with the disappearance of the double peak in the dilatation rate as cell concentration is increased. Two different expansions may be represented by the double peak, the formation of ice, as well as water transport that occurs within the mushy zone [39] of the frozen zone during the cooling process. The reduction of the second peak may be explained by the cell-matrix interaction present between the MCF7 cells and ECM, which although limited, may play a role in confining this expansion as the cellular concentration quadruples. As the cellular concentration increases, the number of cell-matrix adhesions and intracellular water available for transport increases accordingly. Additionally, the increase in cell-matrix interaction could provide additional support through crosslinks and matrix remodeling, which may result in the minimization of the second peak as cell concentration increased. However, as shown by the theoretical analysis, the cellular concentration used experimentally does not significantly alter tissue deformation, resulting in the possibility that the cell-matrix adhesions, although limited, play a role during tissue deformation, either by altering the ECM microstructure or by the presence of the higher quantities of MCF7 cells.
The present model is developed to estimate the amount of excess water by cellular dehydration, which may contribute to the additional dilatation of the ECM in the frozen region. The results suggest that the amount of excess water is very small, and subsequent additional ECM expansion is also expected to be negligible at the cell concentrations studied. Moreover, the estimated freezing-induced dilatation was found to be smaller than the experimentally measured values. A possible reason for the underprediction is that the analysis took into account only the thermodynamic and biophysical factors: extracellular freezing and cellular water transport, which are thought to be significantly smaller than the freezing-induced extracellular water transport [25]. The contribution of this interstitial fluid transport to the tissue deformation is thought to be dominant at the cell concentrations studied. Such effects of the spatial water transport on freezing-induced deformation of ETs has been investigated using a biphasic model recently [40].
In the present work, the contribution of cellular water transport is taken into account in freezing-induced tissue mechanics. The tissue mechanics have been analyzed by elastic [41], viscoelastic [42], and poroelastic (or multiphasic) [23,40] models. These previous models involve a coupled set of governing equations correlating macroscopic thermal and mechanical variables without considering the cellular water transport. The model presented here can be used in conjunction with these governing equations to introduce the effect of water transport into those models. This framework can be further extended in designing cryopreservation protocols by determining freezing conditions and their subsequent freezing-induced tissue deformation.
For example, the present model used the temperature variation and frozen fraction based on experimental measurements. These variables during a given cryopreservation protocol can also be obtained by solving the energy conservation equation for the extracellular fluid
| (10) |
where enthalpy h is defined with respect to a reference state at as
| (11) |
is the density, is the specific heat, is the thermal conductivity, and is the mean velocity of the extracellular fluid. Equation (11) provides the enthalpy as a function of temperature and frozen fraction. When the frozen fraction is also explicitly available as a function of temperature [43], Eqs. (10) and (11) can be solved simultaneously to obtain the temperature field. Enthalpy methods that are either uncoupled [44,45] or coupled to biophysical models of water transport and intracellular ice formation [36] are available to solve this problem. The temperature field enables predictions of F and Ve as functions of time, which then can be used together with our model, Eq. (8), to estimate the deformation.
Since the present model neglected the movement of extracellular water across the porous ECM, its prediction could have a margin of error for engineered tissues as mentioned above. However, this error is expected to be significantly less for native tissues that have considerably less hydraulic conductivity than engineered tissues. Therefore, the model can provide a first approximation for deformation in native tissues and can be useful for investigating cryopreservation outcomes.
Another inherent assumption in the analysis was that the osmotic response of MCF7 in the ET was assumed to be similar to that of MCF7 in suspension. While it has been shown recently that the freezing response of certain types of adherent cells like fibroblasts can be affected by their attachment state [46], such findings may not generalize to MCF7, which has a relative weak attachment to the surrounding matrix. In that case, the behavior of MCF7 in ET may be represented by that of MCF7 in suspension with reasonably good accuracy, possibly with slight overestimation.
The membrane permeability parameters for MCF7 that were obtained from the optimal model predictions are summarized in Table 2. To the best of the authors’ knowledge, this is the first report of the water transport parameters of MCF7. The magnitude of the membrane permeability at the reference temperature was found to be similar to those of many other cell lines including human dermal fibroblasts [47], LNCaP prostate tumor cells [48], and oocytes [49,50]. It was also an order of magnitude smaller than the membrane permeability of rat hepatocytes that are known to have unusually high membrane permeabilities in accordance with their metabolic function in liver [31,51]. The activation energy was found to decrease significantly with increasing cooling rate. The cooling rate dependence of activation energy suggests that, in addition to the change in temperature, some mechanistic elements such as the presence and deformation of the cytoskeleton might also contribute to the changes in the resistance to cellular water transport during freezing.
Table 2.
Membrane permeability parameters estimated by the model
| Cooling rate (°C/min) | Lpg (1013 m3/N·s) | ELp (kJ/mol) |
|---|---|---|
| 5 | 0.430 | 239 |
| 10 | 0.472 | 184 |
| 30 | 0.306 | 103 |
| Mean | 0.403 ± 0.050 | 175 ± 39 |
Effect of Cell Concentration and Cellular Water Transport on the Freezing-Induced Tissue Deformation.
Both the experiments and the analysis revealed that neither the concentration of the cells in the ET nor their osmotic activity produced an important effect on the magnitude of dilatation across the ET. However, this may be significant in native tissues, which have significantly higher cellular density and a more complex spatial organization compared to ETs. As an example, the chondrocyte concentration in the articular cartilage ranges between , which is more than an order of magnitude greater than that of typical engineered tissues [52,53]. The myocyte content of heart tissue is even higher with [54]. Therefore, the effects of the presence and the osmotic activity of the cells should be considered for native tissues as well. As the cell (and microsphere) concentration is increased, although the amount of cellular water transport increases, the freezing-induced deformation can become smaller. This can be explained by the fact that, for higher concentrations, the cells occupy more space in the tissue, which decreases the porosity and the relative amount of interstitial fluid. The reduction in the water content that is available for extracellular freezing results in a decrease in the freezing-induced deformation. The differences between the cell and microsphere groups indicate that the amount of cellular water excluded to the extracellular space becomes appreciable at high cell concentrations, e.g., . As a result, the cellular water transport is expected to play a significant role in the freezing-induced deformation of biological tissues.
Relevance to Tissue Cryopreservation.
Cooling rate is one of the key parameters that determine the outcomes of cryopreservation protocols. Our model provides insight into how cooling rate affects the tissue deformation depending on the composition and biophysical characteristics of the tissue. Examination of Eq. (8) reveals that tissue deformation rate is directly proportional to the rate of ice formation in the extracellular space . In addition, the magnitude of is related to the cooling rate B as follows:
| (12) |
where is a function of temperature that has been determined experimentally in our study. Alternatively a functional relationship for based on a binary phase diagram of physiological solutions can be found in the literature [43]. Secondly, tissue porosity and cell concentration are the two main tissue characteristics that appear in Eq. (8), and they are also expected to be important to the deformation of the tissue.
For the sake of discussion, let us consider two limiting cases where (i) , representing a tissue with low cell content, and (ii) , representing a tissue densely packed with cells. The former is an idealization of engineered tissues considered in this study ( and ) and the latter is a case that is well approximated with native tissues. An example of case (ii) is mammalian liver tissue where and [35].
For case (i), it can be shown that the first term on the right hand side of Eq. (8) becomes much greater than the second term. Therefore, the dilatation rate can be approximated by
| (13) |
where the coefficient of becomes a monotonically decreasing function of time during freezing. Considering Eqs. (12) and (13) together, it is seen that deformation rate is expected to increase with increasing cooling rate. As a result, a slow cooling rate is desirable to minimize the freezing-induced deformation of engineered tissues during cryopreservation.
In case (ii), Eq. (8) becomes,
| (14) |
Dilatation rate is limited by the rate of water exclusion from the cells multiplied by the frozen fraction. Therefore, competing effects of cooling rate on both extracellular ice formation and cellular water transport dynamics are equally important in determining tissue deformation. In fact, hindrance of water transport by increased cooling rate can be significant enough to counteract the effects of increasing cooling rate on extracellular ice formation. Therefore, for the case of cells with high cell content, it might be possible that there exists an optimal cooling rate that minimizes deformation of the tissue during cryopreservation. This optimal cooling rate depends on the composition of the tissue and cellular water transport parameters of the cells within.
Conclusion
The present study provides a quantitative and mechanistic understanding of the role of cells in the freezing-induced cell-fluid-matrix interactions. Previous studies [23–25] showed the presence of freezing-induced cell-fluid-matrix interaction but could not delineate the role of cells since the cells can either suppress the freezing-induced deformation by strengthening the matrix via cell-matrix adhesion, or augment it by providing excess water via dehydration. Based on the experimental and modeling results of the present study, it was found that cells increase the strength of the matrix via cell-matrix adhesion at the cell concentrations relevant to engineered tissues, but the effects of cellular water transport become significant as the concentration approaches that of native tissues. These findings will be useful to tissue-type, specifically design, and modify cryopreservation protocols for various types of tissues.
Acknowledgment
This research was supported by grants from the National Institutes of Health/National Institute of Biomedical Imaging and Bioengineering, R01 EB008388, and the National Science Foundation, CBET-1009465.
Contributor Information
Altug Ozcelikkale, School of Mechanical Engineering, Purdue University, West Lafayette, IN 47907.
Craig Dutton, Department of Aerospace Engineering, University of Illinois at Urbana-Champaign, Urbana, IL 61801.
Bumsoo Han, School of Mechanical Engineering, Purdue University, West Lafayette, IN 47907; Weldon School of Biomedical Engineering, Purdue University, West Lafayette, IN 47907, e-mail: bumsoo@purdue.edu.
References
- [1]. Berthiaume, F. , Moghe, P. V. , Toner, M. , and Yarmush, M. L. , 1996, “Effect of Extracellular Matrix Topology on Cell Structure, Function, and Physiological Responsiveness: Hepatocytes Cultured in a Sandwich Configuration,” FASEB J., 10, pp. 1471–1484. Available at: http://www.fasebj.org/content/10/13/1471.full.pdf [DOI] [PubMed] [Google Scholar]
- [2]. Borene, M. L. , Barocas, V. H. , and Hubel, A. , 2004, “Mechanical and Cellular Changes During Compaction of a Collagen-Sponge-Based Corneal Stromal Equivalent,” Ann. Biomed. Eng., 32(2), pp. 274–283. 10.1023/B:ABME.0000012747.97620.3a [DOI] [PubMed] [Google Scholar]
- [3]. Meredith, J. E. , Fazeli, B. , and Schwartz, M. A. , 1993, “The Extracellular Matrix as a Cell Survival Factor,” Mol. Biol. Cell, 4, pp. 953–961. [DOI] [PMC free article] [PubMed] [Google Scholar]
- [4]. Grinnell, F. , 1994, “Fibroblasts, Myofibroblasts, and Wound Contraction,” J. Cell Biol., 124, pp. 401–404. 10.1083/jcb.124.4.401 [DOI] [PMC free article] [PubMed] [Google Scholar]
- [5]. Petroll, W. M. , and Ma, L. , 2003, “Direct, Dynamic Assessment of Cell-Matrix Interactions Inside Fibrillar Collagen Lattices,” Cell Motil. Cytoskeleton, 55, pp. 254–264. 10.1002/cm.10126 [DOI] [PubMed] [Google Scholar]
- [6]. Gerson, C. J. , Goldstein, S. , and Heacox, A. E. , 2009, “Retained Structural Integrity of Collagen and Elastin Within Cryopreserved Human Heart Valve Tissue as Detected by Two-Photon Laser Scanning Confocal Microscopy,” Cryobiology, 59(2), pp. 171–179. 10.1016/j.cryobiol.2009.06.012 [DOI] [PubMed] [Google Scholar]
- [7]. Schenke-Layland, K. , Xie, J. , Heydarkhan-Hagvall, S. , Hamm-Alvarez, S. F. , Stock, U. A. , Brockbank, K. G. , and MacLellan, W. R. , 2007, “Optimized Preservation of Extracellular Matrix in Cardiac Tissue: Implications for Long-Term Graft Durability,” Ann. Thorac. Surg., 83, pp. 1641–1650. 10.1016/j.athoracsur.2006.12.005 [DOI] [PubMed] [Google Scholar]
- [8]. Karlsson, J. O. , 2010, “Effects of Solution Composition on the Theoretical Prediction of Ice Nucleation Kinetics and Thermodynamics,” Cryobiology, 60(1), pp. 43–51. 10.1016/j.cryobiol.2009.07.004 [DOI] [PubMed] [Google Scholar]
- [9]. Mazur, P. , 1984, “Freezing of Living Cells: Mechanisms and Implications,” Am. J. Physiol., 247(3 Pt 1), pp. C125–142. [DOI] [PubMed] [Google Scholar]
- [10]. Toner, M. , Cravalho, E. G. , and Karel, M. , 1990, “Thermodynamics and Kinetics of Intracellular Ice Formation During Freezing of Biological Cells,” J. Appl. Phys., 67(3), pp. 1582–1593. 10.1063/1.345670 [DOI] [Google Scholar]
- [11]. Zhurova, M. , Woods, E. J. , and Acker, J. P. , 2010, “Intracellular Ice Formation in Confluent Monolayers of Human Dental Stem Cells and Membrane Damage,” Cryobiology, 61(1), pp. 133–141. 10.1016/j.cryobiol.2010.06.007 [DOI] [PMC free article] [PubMed] [Google Scholar]
- [12]. Bischof, J. C. , Hunt, C. J. , Rubinsky, B. , Burgess, A. , and Pegg, D. E. , 1990, “Effects of Cooling Rate and Glycerol Concentration on the Structure of the Frozen Kidney: Assessment by Cryoscanning Electron Microscopy,” Cryobiology, 27, pp. 301–310. 10.1016/0011-2240(90)90029-4 [DOI] [PubMed] [Google Scholar]
- [13]. Hong, J. S. , and Rubinsky, B. , 1994, “Patterns of Ice Formation in Normal and Malignant Breast Tissue,” Cryobiology, 31(2), pp. 109–120. 10.1006/cryo.1994.1015 [DOI] [PubMed] [Google Scholar]
- [14]. Pazhayannur, P. V. , and Bischof, J. C. , 1997, “Measurement and Simulation of Water Transport During Freezing in Mammalian Liver Tissue,” ASME J. Biomech. Eng., 119, pp. 269–277. 10.1115/1.2796091 [DOI] [PubMed] [Google Scholar]
- [15]. Brockbank, K. G. , MacLellan, W. R. , Xie, J. , Hamm-Alvarez, S. F. , Chen, Z. Z. , and Schenke-Layland, K. , 2008, “Quantitative Second Harmonic Generation Imaging of Cartilage Damage,” Cell Tissue Bank., 9(4), pp. 299–307. 10.1007/s10561-008-9070-7 [DOI] [PubMed] [Google Scholar]
- [16]. Laouar, L. , Fishbein, K. , McGann, L. E. , Horton, W. E. , Spencer, R. G. , and Jomha, N. M. , 2007, “Cryopreservation of Porcine Articular Cartilage: MRI and Biochemical Results After Different Freezing Protocols,” Cryobiology, 54(1), pp. 36–43. 10.1016/j.cryobiol.2006.10.193 [DOI] [PubMed] [Google Scholar]
- [17]. Oskam, I. C. , Lund, T. , and Santos, R. R. , 2011, “Irreversible Damage in Ovine Ovarian Tissue After Cryopreservation in Propanediol: Analyses After In Vitro Culture and Xenotransplantation,” Reprod. Domest. Anim., 46(5), pp. 793–799. 10.1111/j.1439-0531.2010.01743.x [DOI] [PubMed] [Google Scholar]
- [18]. Venkatasubramanian, R. T. , Wolkers, W. F. , Shenoi, M. M. , Barocas, V. H. , Lafontaine, D. , Soule, C. L. , Iaizzo, P. A. , and Bischof, J. C. , 2010, “Freeze-Thaw Induced Biomechanical Changes in Arteries: Role of Collagen Matrix and Smooth Muscle Cells,” Ann. Biomed. Eng., 38(3), pp. 694–706. 10.1007/s10439-010-9921-9 [DOI] [PubMed] [Google Scholar]
- [19]. Changoor, A. , Fereydoonzad, L. , Yaroshinsky, A. , and Buschmann, M. D. , 2010, “Effects of Refrigeration and Freezing on the Electromechanical and Biomechanical Properties of Articular Cartilage,” ASME J. Biomech. Eng., 132(6), p. 064502. 10.1115/1.4000991 [DOI] [PubMed] [Google Scholar]
- [20]. Baicu, S. , Taylor, M. J. , Chen, Z. , and Rabin, Y. , 2006, “Vitrification of Carotid Artery Segments: An Integrated Study of Thermophysical Events and Functional Recovery Toward Scale-Up for Clinical Applications,” Cell Preserv. Technol., 4(4), pp. 236–244. 10.1089/cpt.2006.9994 [DOI] [PMC free article] [PubMed] [Google Scholar]
- [21]. Dainese, L. , Barili, F. , Topkara, V. K. , Cheema, F. H. , Formato, M. , Aljaber, E. , Fusari, M. , Micheli, B. , Guarino, A. , Biglioli, P. , and Polvani, G. , 2006, “Effect of Cryopreservation Techniques on Aortic Valve Glycosaminoglycans,” Artif. Organs, 30(4), pp. 259–264. 10.1111/j.1525-1594.2006.00213.x [DOI] [PubMed] [Google Scholar]
- [22]. Gustavo, M. , Andrade, M. G. , Sa, C. N. , Marchionni, A. M. , dos Santos Calmon de Bittencourt, T. C. , and Sadigursky, M. , 2008, “Effects of Freezing on Bone Histological Morphology,” Cell Tissue Bank., 9(4), pp. 279–287. 10.1007/s10561-008-9065-4 [DOI] [PubMed] [Google Scholar]
- [23]. Han, B. , Miller, J. D. , and Jung, J. K. , 2009, “Freezing-Induced Fluid-Matrix Interaction in Poroelastic Material,” ASME J. Biomech. Eng., 131(2), p. 021002. 10.1115/1.3005170 [DOI] [PMC free article] [PubMed] [Google Scholar]
- [24]. Teo, K. Y. , DeHoyos, T. O. , Dutton, J. C. , Grinnell, F. , and Han, B. , 2011, “Effects of Freezing-Induced Cell-Fluid-Matrix Interactions on the Cells and Extracellular Matrix of Engineered Tissues,” Biomaterials, 32(23), pp. 5380–5390. 10.1016/j.biomaterials.2011.04.008 [DOI] [PMC free article] [PubMed] [Google Scholar]
- [25]. Teo, K. Y. , Dutton, J. C. , and Han, B. , 2010, “Spatiotemporal Measurement of Freezing-Induced Deformation of Engineered Tissues,” ASME J. Biomech. Eng., 132(3), p. 031003. 10.1115/1.4000875 [DOI] [PMC free article] [PubMed] [Google Scholar]
- [26]. Noel, A. , Munaut, C. , Boulvain, A. , Calberg-Bacq, C. M. , Lambert, C. A. , Nusgens, B. , Lapiere, C. M. , and Foidart, J. M. , 1992, “Modulation of Collagen and Fibronectin Synthesis in Fibroblasts by Normal and Malignant Cells,” J. Cell. Biochem., 48, pp. 150–161. 10.1002/jcb.240480207 [DOI] [PubMed] [Google Scholar]
- [27]. Devireddy, R. V. , Swanlund, D. J. , Roberts, K. P. , and Bischof, J. C. , 1999, “Subzero Water Permeability Parameters of Mouse Spermatozoa in the Presence of Extracellular Ice and Cryoprotective Agents,” Biol. Reprod., 61(3), pp. 764–775. 10.1095/biolreprod61.3.764 [DOI] [PubMed] [Google Scholar]
- [28]. Balasubramanian, S. K. , Bischof, J. C. , and Hubel, A. , 2006, “Water Transport and IIF Parameters for a Connective Tissue Equivalent,” Cryobiology, 52(1), pp. 62–73. 10.1016/j.cryobiol.2005.09.009 [DOI] [PubMed] [Google Scholar]
- [29]. Akhoondi, M. , Oldenhof, H. , Stoll, C. , Sieme, H. , and Wolkers, W. F. , 2011, “Membrane Hydraulic Permeability Changes During Cooling of Mammalian Cells,” Biochim. Biophys. Acta, 1808(3), pp. 642–648. 10.1016/j.bbamem.2010.11.021 [DOI] [PubMed] [Google Scholar]
- [30]. Devireddy, R. V. , Raha, D. , and Bischof, J. C. , 1998, “Measurement of Water Transport During Freezing in Cell Suspensions Using a Differential Scanning Calorimeter,” Cryobiology, 36(2), pp. 124–155. 10.1006/cryo.1997.2071 [DOI] [PubMed] [Google Scholar]
- [31]. Toner, M. , Tompkins, R. G. , Cravalho, E. G. , and Yarmush, M. L. , 1992, “Transport Phenomena During Freezing of Isolated Hepatocytes,” AIChE J., 38(10), pp. 1512–1522. 10.1002/aic.690381004 [DOI] [Google Scholar]
- [32]. Mazur, P. , 1963, “Kinetics of Water Loss From Cells at Subzero Temperatures and Likelihood of Intracellular Freezing,” J. Gen. Physiol., 47, pp. 347–369. 10.1085/jgp.47.2.347 [DOI] [PMC free article] [PubMed] [Google Scholar]
- [33]. Levin, R. L. , Cravalho, E. G. , and Huggins, C. E. , 1976, “A Membrane Model Describing the Effect of Temperature on the Water Conductivity of Erythrocyte Membranes at Subzero Temperatures,” Cryobiology, 13(4), pp. 415–429. 10.1016/0011-2240(76)90097-3 [DOI] [PubMed] [Google Scholar]
- [34]. Levenberg, K. , 1944, “A Method for the Solution of Certain Non-Linear Problems in Least Squares,” Q. Appl. Math., 2, pp. 164–168. [Google Scholar]
- [35]. Pazhayannur, P. V. , and Bischof, J. C. , 1997, “Measurement and Simulation of Water Transport During Freezing in Mammalian Liver Tissue,” ASME J. Biomech. Eng., 119(3), pp. 269–277. 10.1115/1.2796091 [DOI] [PubMed] [Google Scholar]
- [36]. Devireddy, R. V. , Smith, D. J. , and Bischof, J. C. , 2002, “Effect of Microscale Mass Transport and Phase Change on Numerical Prediction of Freezing in Biological Tissues,” ASME J. Heat Transfer, 124(2), pp. 365–374. 10.1115/1.1445134 [DOI] [Google Scholar]
- [37]. Devireddy, R. V. , Thirumala, S. , and Gimble, J. M. , 2005, “Cellular Response of Adipose Derived Passage-4 Adult Stem Cells to Freezing Stress,” ASME J. Biomech. Eng., 127(7), pp. 1081–1086. 10.1115/1.2073673 [DOI] [PubMed] [Google Scholar]
- [38]. Ivascu, A. , and Kubbies, M. , 2007, “Diversity of Cell-Mediated Adhesions in Breast Cancer Spheroids,” Int. J. Oncol., 31, pp. 1403–1413. [PubMed] [Google Scholar]
- [39]. Viskanta, R. , Bianchi, M. V. A. , Critser, J. K. , and Gao, D. , 1997, “Solidification Processes of Solutions,” Cryobiology, 34(4), pp. 348–362. 10.1006/cryo.1997.2015 [DOI] [PubMed] [Google Scholar]
- [40]. Wright, J. , Han, B. , and Chuong, C. J. , 2012, “Biphasic Investigation of Tissue Mechanical Response During Freezing Front Propagation,” ASME J. Biomech. Eng., 134(6), p. 061005. 10.1115/1.4006682 [DOI] [PMC free article] [PubMed] [Google Scholar]
- [41]. He, X. , and Bischof, J. C. , 2005, “Analysis of Thermal Stress in Cryosurgery of Kidneys,” ASME J. Biomech. Eng., 127(4), pp. 656–661. 10.1115/1.1934021 [DOI] [PubMed] [Google Scholar]
- [42]. Shi, X. , Datta, A. K. , and Mukherjee, Y. , 1998, “Thermal Stresses From Large Volumetric Expansion During Freezing of Biomaterials,” ASME J. Biomech. Eng., 120(6), pp. 720–726. 10.1115/1.2834885 [DOI] [PubMed] [Google Scholar]
- [43]. Pitt, R. E. , 1990, “Cryobiological Implications of Different Methods of Calculating the Chemical-Potential of Water in Partially Frozen Suspending Media,” CryoLetters, 11(3), pp. 227–240. [Google Scholar]
- [44]. Swaminathan, C. R. , and Voller, V. R. , 1992, “A General Enthalpy Method for Modeling Solidification Processes,” Metall. Trans. B, 23(5), pp. 651–664. 10.1007/BF02649725 [DOI] [Google Scholar]
- [45]. Ahmadikia, H. , and Moradi, A. , 2012, “Non-Fourier Phase Change Heat Transfer in Biological Tissues During Solidification,” Heat Mass Transfer, 48(9), pp. 1559–1568. 10.1007/s00231-012-1002-1 [DOI] [Google Scholar]
- [46]. Choi, J. , and Bischof, J. C. , 2011, “Cooling Rate Dependent Biophysical and Viability Response Shift With Attachment State in Human Dermal Fibroblast Cells,” Cryobiology, 63(3), pp. 285–291. 10.1016/j.cryobiol.2011.09.142 [DOI] [PubMed] [Google Scholar]
- [47]. Balasubramanian, S. K. , Wolkers, W. F. , and Bischof, J. C. , 2009, “Membrane Hydration Correlates to Cellular Biophysics During Freezing in Mammalian Cells,” Biochim. Biophys. Acta, 1788(5), pp. 945–953. 10.1016/j.bbamem.2009.02.009 [DOI] [PubMed] [Google Scholar]
- [48]. Wolkers, W. F. , Balasubramanian, S. K. , Ongstad, E. L. , Zec, H. C. , and Bischof, J. C. , 2007, “Effects of Freezing on Membranes and Proteins in LNCaP Prostate Tumor Cells,” Biochim. Biophys. Acta, 1768(3), pp. 728–736. 10.1016/j.bbamem.2006.12.007 [DOI] [PMC free article] [PubMed] [Google Scholar]
- [49]. Kleinhans, F. W. , and Mazur, P. , 2009, “Determination of the Water Permeability (Lp) of Mouse Oocytes at −25 Degrees C and its Activation Energy at Subzero Temperatures,” Cryobiology, 58(2), pp. 215–224. 10.1016/j.cryobiol.2008.12.008 [DOI] [PMC free article] [PubMed] [Google Scholar]
- [50]. Yang, G. , Veres, M. , Szalai, G. , Zhang, A. L. , Xu, L. X. , and He, X. M. , 2011, “Biotransport Phenomena in Freezing Mammalian Oocytes,” Ann. Biomed. Eng., 39(1), pp. 580–591. 10.1007/s10439-010-0158-4 [DOI] [PubMed] [Google Scholar]
- [51]. Smith, D. J. , Schulte, M. , and Bischof, J. C. , 1998, “The Effect of Dimethylsulfoxide on the Water Transport Response of Rat Hepatocytes During Freezing,” ASME J. Biomech. Eng., 120(5), pp. 549–558. 10.1115/1.2834744 [DOI] [PubMed] [Google Scholar]
- [52]. Quinn, T. M. , Hunziker, E. B. , and Hauselmann, H. J. , 2005, “Variation of Cell and Matrix Morphologies in Articular Cartilage Among Locations in the Adult Human Knee,” Osteoarthritis Cartilage, 13(8), pp. 672–678. 10.1016/j.joca.2005.04.011 [DOI] [PubMed] [Google Scholar]
- [53]. Sander, E. A. , and Barocas, V. H. , 2008, “Biomimetic Collagen Tissues: Collagenous Tissue Engineering and Other Applications,” Collagen, Fratzl P., ed., Springer, New York, pp. 475–504. [Google Scholar]
- [54]. Vunjak-Novakovic, G. , Tandon, N. , Godier, A. , Maidhof, R. , Marsano, A. , Martens, T. P. , and Radisic, M. , 2010, “Challenges in Cardiac Tissue Engineering,” Tissue Eng. Part B, Rev., 16(2), pp. 169–187. 10.1089/ten.teb.2009.0352 [DOI] [PMC free article] [PubMed] [Google Scholar]


