An inducible activation approach is used to interrogate the positive feedback circuit underlying self-amplification of PI3K signals in fibroblasts. The results show that local positive feedback between PI3K and HRas drives asymmetric membrane extension and cell migration.
Abstract
Self-amplification of phosphoinositide 3-kinase (PI3K) signaling is believed to regulate asymmetric membrane extension and cell migration, but the molecular organization of the underlying feedback circuit is elusive. Here we use an inducible approach to synthetically activate PI3K and interrogate the feedback circuitry governing self-enhancement of 3′-phosphoinositide (3-PI) signals in NIH3T3 fibroblasts. Synthetic activation of PI3K initially leads to uniform production of 3-PIs at the plasma membrane, followed by the appearance of asymmetric and highly amplified 3-PI signals. A detailed spatiotemporal analysis shows that local self-amplifying 3-PI signals drive rapid membrane extension with remarkable directional persistence and initiate a robust migratory response. This positive feedback loop is critically dependent on the small GTPase HRas. Silencing of HRas abrogates local amplification of 3-PI signals upon synthetic PI3K activation and results in short-lived protrusion events that do not support cell migration. Finally, our data indicate that this feedback circuit is likely to operate during platelet-derived growth factor–induced random cell migration. We conclude that positive feedback between PI3K and HRas is essential for fibroblasts to spontaneously self-organize and generate a productive migratory response in the absence of spatial cues.
INTRODUCTION
Migration of eukaryotic cells is an integrated process that is central to wound healing, immune surveillance, embryonic development, and tumor metastasis. Motile cells are endowed with the ability to polarize and migrate spontaneously in the absence of spatial cues (i.e., chemoattractant gradients). This type of movement is often referred to as a persistent random walk and involves bouts of migration along fairly straight paths interspersed with random changes in direction. Random migration in response to spatially uniform stimuli reflects the remarkable ability of cells to self-organize and form a persistent protruding edge. Recent studies suggest that self-polarization may also be relevant for directed cell migration or chemotaxis (Devreotes and Janetopoulos, 2003). One chemotaxis model proposes that directional sensing operates by making subtle steering adjustments on a preexisting leading edge (Arrieumerlou and Meyer, 2005), which may form independently of the spatial cue, in a cell-autonomous manner. How self-organization is encoded within intracellular signaling networks has remained a major question in the field for the past 40 years.
Several models for self-polarization are based on internal positive feedback circuits that amplify local stochastic fluctuations in the activity of intracellular signaling proteins (Gierer and Meinhardt, 1972; Altschuler et al., 2008). Studies in Dictyostelium, leukocytes, and fibroblasts indicate that signal amplification probably occurs downstream of surface receptors but upstream of 3′-phosphorylated phosphoinositide (3-PI) lipids (Haugh et al., 2000; Weiner et al., 2002; Sasaki et al., 2007), which are generated by the phosphoinositide 3-kinase (PI3K) lipid kinase (Cantley, 2002). 3-PIs (which here refer to phosphatidylinositol (3,4,5)-trisphosphate [PI(3,4,5)P3] and phosphatidylinositol 3,4-biphosphate [PI(4,5)P2]) are lipid second messengers that regulate actin cytoskeleton dynamics by recruiting a variety of effector molecules, including nucleotide exchange factors for Rho GTPases (Saarikangas et al., 2010). Data from different types of migratory cells show that local 3-PI signals, triggered by chemotactic gradients or arising spontaneously, are strongly amplified, eventually leading to steep internal 3-PI gradients (Haugh et al., 2000; Weiner et al., 2002; Inoue and Meyer, 2008). Local PI3K signaling is one of the earliest and best-described symmetry-breaking events that can be observed in migratory cells. Despite the overwhelming evidence implicating PI3K in actin dynamics and membrane elongation (Haugh et al., 2000; Funamoto et al., 2002; Iijima and Devreotes, 2002; Xu et al., 2003; Weiger et al., 2009; Yoo et al., 2010), the precise role(s) of PI3K in cell migration remain(s) controversial. Ablation of all PI3K isoforms in Dictyostelium did not affect the ability of these cells to chemotax, although it severely impaired the speed at which these cells randomly migrated in the absence of a chemoattractant source (Hoeller and Kay, 2007). These data indicate that local PI3K signaling is not required for efficient chemotaxis in Dictyostelium, suggesting the presence of PI3K-independent signaling systems for directional sensing (Kamimura et al., 2008).
Nevertheless, the robust internal amplification of PI3K signaling and the tight functional coupling between local 3-PI signals and membrane elongation make this system a valuable model to interrogate the circuitry underlying PI3K-driven positive feedback loops in migratory cells. Rapid feedback circuits operating in the range of seconds to minutes, such as these involved in cell movement, are difficult to study, in part due to the lack of tools to selectively perturb intracellular signaling molecules with sufficient temporal resolution. Despite intense research, the molecular organization of this PI3K feedback circuit is unclear and highly debated. Amplification of PI3K signaling has been proposed to require Rho GTPases and in particular Rac activity (Weiner et al., 2002; Srinivasan et al., 2003). In support of this, overexpression of a constitutively active form of Rac leads to elevated 3-PI levels (Srinivasan et al., 2003). Rapid activation of Rac, however, using a chemically inducible dimerization approach failed to activate PI3K or induce cell polarization, suggesting that Rac alone does not feed back to PI3K, at least not on a time scale relevant for cell motility (Inoue and Meyer, 2008; Kunida et al., 2012). A recent study reported that simultaneous activation of several Rho GTPases (Rac1, Cdc42, and RhoG) leads to increase in PI3K activity (Yang et al., 2012). Whether cooperative feedback from Rho GTPases to PI3K is sufficient to trigger cell polarization/migration was not addressed.
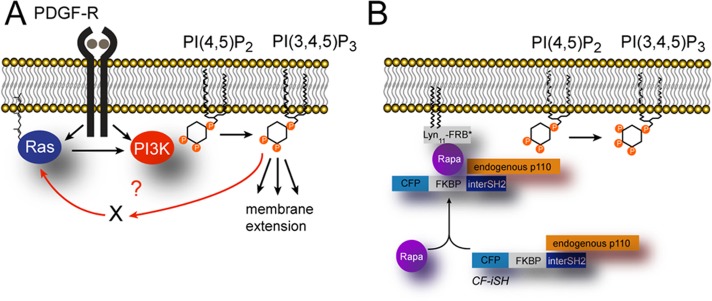
Another plausible mediator of PI3K self-amplification is the small GTPase Ras. In fibroblasts, both Ras and PI3K are immediate downstream effectors of the platelet-derived growth factor (PDGF) receptor (Figure 1A) and are rapidly activated at the leading edge upon PDGF stimulation (Gupta et al., 2007). PI3K activity can be further enhanced by activated (GTP-bound) Ras through direct allosteric interaction (Rodriguez-Viciana et al., 1994). Ras-mediated activation of PI3K is key for optimal PI3K function both in vivo and in vitro (Gupta et al., 2007), although the extent to which Ras modulates PI3K activity (relative to inputs coming directly from tyrosine kinase receptors) is variable and context dependent. For instance, Ras does not seem to influence PDGF-induced PI3K activation, whereas it is required for optimal PI3K stimulation in response to EGF or FGF-2 (Gupta et al., 2007). Furthermore, Ras by itself is unable to drive membrane translocation of PI3K, a necessity for PI3K activation (Suire et al., 2006), suggesting that enhancement of PI3K activity by Ras requires tonic inputs from tyrosine kinase receptors.
FIGURE 1:
Design of the inducible PI3K activation probe. (A) Working model for positive feedback between Ras and PI3K downstream of the PDGF receptor. (B) Cartoon showing the heterodimerization strategy to inducibly activate PI3K.
We and others recently proposed that Ras activity may also be under the control of PI3K, based on data showing rapid reduction of Ras activity upon pharmacological inhibition of PI3K in Dictyostelium (Sasaki et al., 2007), fibroblasts (Fivaz et al., 2008; Wang et al., 2009), and neurons (Fivaz et al., 2008). PI3K-dependent Ras activation would provide the basis for a positive feedback loop between Ras and PI3K. Whether such a circuit shapes local 3-PI signals and underlies asymmetric membrane extension during cell migration is unknown (Figure 1A). Here we use a chemically inducible dimerization approach to rapidly activate endogenous PI3K in NIH3T3 fibroblasts and interrogate the feedback circuit responsible for self-amplification of 3-PI signals. Our data point to a central role of the small GTPase HRas in this process and suggest that positive feedback between Ras and PI3K is essential and sufficient to elicit robust symmetry breaking and drive cell migration.
RESULTS
Synthetic activation of PI3K leads to local amplification of 3-PI signaling and asymmetric membrane protrusion
We previously reported a method for rapid activation of PI3K (Fivaz et al., 2008; Inoue and Meyer, 2008) based on chemically inducible heterodimerization of FK506-binding protein (FKBP) and FKBP-and-rapamycin–binding protein (FRB). FKBP is fused to a truncated form of p85, the regulatory subunit of PI3K, and flanked with cyan fluorescent protein (CFP; CF-iSH), whereas FRB is targeted to the plasma membrane by a lipid modification (Lyn-FRB; Figure 1B). Addition of rapamycin (Rapa) to cells coexpressing CF-iSH and Lyn-FRB leads to translocation of CF-iSH and recruitment of the endogenous PI3K catalytic subunit to the plasma membrane, which rapidly converts its substrate PI(4,5)P2 to PI(3,4,5)P3 (Figure 1B).
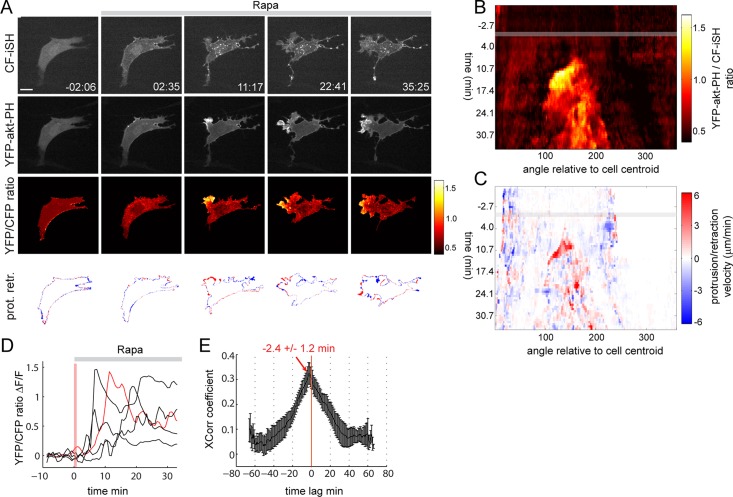
The initial site of PI3K activation is dictated by the lipid modification of the Lyn kinase, which localizes reporter proteins (in this case FRB) uniformly across the plasma membrane. A fraction of Lyn-FRB also localizes to endomembranes, as revealed by Rapa-induced translocation of CF-iSH to intracellular vesicles (Figure 2A). PI3K activity was monitored by translocation of the 3-PI–specific probe yellow fluorescent protein (YFP)–akt-PH to the plasma membrane (Kontos et al., 1998). To obtain an accurate measure of 3-PI signals independent of local changes in the surface to volume ratio of the cell, we computed the YFP-akt-PH to CF-iSH ratio image. This ratio is expected to be uniform across the cell once both fluorescent probes reach to plasma membrane, provided that PI3K activation is exclusively driven by Rapa-induced CF-iSH translocation. If, however, PI3K activity is further amplified by a (CF-iSH–independent) local feedback loop, this ratio is predicted to increase locally. To minimize basal activation of PI3K and prelocalization of YFP-akt-PH to the plasma membrane before Rapa addition, we serum starved NIH3T3 cells for a minimum of 6 h before imaging.
FIGURE 2:
Synthetic activation of PI3K triggers local amplification of PI3K and asymmetric membrane extension. (A) Time series of Rapa-induced PI3K activation in NIH3T3 cells. Rapa (100 nM) is added at time t = 0. Time is in minutes and seconds. The YFP-akt-PH to CF-iSH ratio monitors PI3K activity. Bottom, areas that protruded (red) or retracted (blue) in the last 40 s preceding the indicated time stamp. (B) PI3K activity map derived from the time series shown in A. The gray bar indicates the time (0 min) at which Rapa is added. Note the local and persistent increase in 3-PI signals occurring ∼10 min after Rapa addition. (C) PR map derived from A. (D) Kinetics of 3-PI amplification in five individual cells. An average 3-PI signal was measured as a function of time from the three adjacent angular bins displaying the highest 3-PI polarity index (see Materials and Methods). The red trace corresponds to the cell shown in A. The vertical pink bar indicates the time required (∼1 min) for PI3K activation after Rapa addition at t = 0. (E) Time-lagged cross-correlation analysis of protrusion and 3-PI activity maps (n = 10 cells). Scale bar, 10 μm.
This ratiometric approach revealed an initially uniform production of 3-PIs after synthetic activation of PI3K (Figure 2A, frame 2, and Supplemental Movies S1 and S2). This was followed, however, by a highly asymmetric increase in 3-PIs and formation of a distinct protruding edge (Figure 2A, frames 3–5, and Supplemental Movies S2 and S3). PI3K activation and membrane extension were not observed after Rapa addition to cells expressing a control CFP-FKBP (CF) construct lacking the p85 moiety (Supplemental Figure S1). 3-PI “hot spots” at the leading edge had ratios up to threefold higher than those measured elsewhere in the cell or before local amplification occurred (Figure 2A). Persistent membrane extension at the leading edge was accompanied by retraction at the back, which led to a net displacement of the cell's centroid (Figure 2A).
To analyze the relationship between 3-PI signals and membrane extension in more detail, we generated spatiotemporal maps based on methods recently described (Kunida et al., 2012; Welf et al., 2012). We mapped 3-PI signals and protrusion/retraction (PR) velocity as a function of time and angular position relative to the cell's centroid (see Materials and Methods and Supplemental Figure S2). The 3-PIs maps are derived from the YFP-akt-PH to CF-iSH ratio values and thus monitor amplification (rather than activation) of PI3K signaling. The 3-PI map corresponding to the time series displayed in Figure 2A shows a local and directionally persistent increase in 3-PI signals (Figure 2B), which appears ∼10 min after Rapa addition. Local 3-PI signals are associated with a persistent increase in protrusion velocity, as shown in the PR map (Figure 2C). Delayed amplification of PI3K signaling is a robust feature of PI3K dynamics in this system, with time lags ranging from ∼5 to ∼15 min after Rapa addition (Figure 2D), and presumably reflects the kinetics of this PI3K positive feedback circuit. Intriguingly, a cross-correlation analysis of 3-PI and PR maps showed that membrane extension precedes 3-PI elevation by ∼2–3 min (Figure 2E). This temporal relationship between membrane protrusion and 3-PI signals was previously observed (Welf et al., 2012) and is consistent with earlier reports implicating actin and membrane dynamics in PI3K self-activation (Weiner et al., 2002; Sasaki et al., 2007; Welf et al., 2012; Yang et al., 2012). Together these data support the existence of a local self-amplifying PI3K circuit in NIH3T3 that converts spatially uniform PI3K activation into highly localized 3-PI signals and triggers persistent membrane extension.
Local PI3K amplification and persistent membrane extension is regulated by the small GTPase HRas
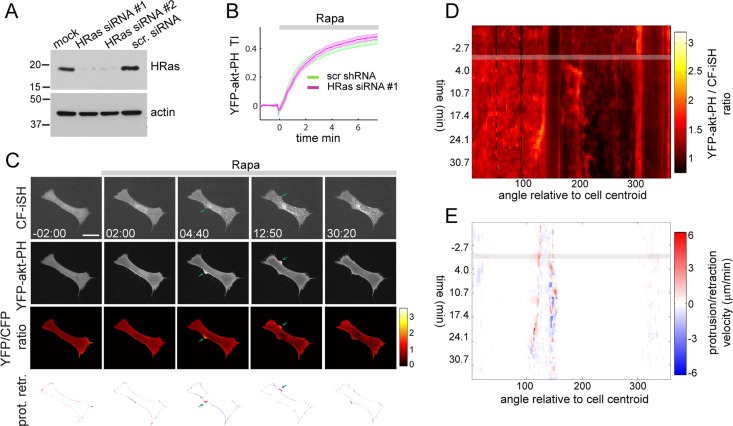
To elucidate the mechanism underlying PI3K feedback signaling, we took advantage of the robust 3-PI self-enhancing response we observed upon synthetic activation of PI3K. We reasoned that if this feedback circuit operates through Ras, interruption of this circuit by Ras silencing should abolish local amplification of 3-PI signals but not global inducible activation of PI3K. Three ubiquitous Ras isoforms (HRas, NRas, and KRas) are expressed in mammalian cells, all of which can interact with and activate PI3K (Yang et al., 2012). We thus decided to individually silence HRas, NRas, and KRas using two independent small interfering RNAs (siRNAs) for each isoform (Figure 3A and Supplemental Figure S3, A and E). HRas, NRas, and KRas silencing had no detectable effect on global 3-PIs production measured by YFP-akt-PH translocation to the plasma membrane (Figure 3B and Supplemental Figure S3, B and F). HRas knockdown, however, strongly inhibited polarized 3-PI production and asymmetric membrane extension elicited by synthetic activation of PI3K (Figure 3, C–E, and Supplemental Movies S4–S6), despite robust global production of 3-PIs, as revealed by YFP-akt-PH translocation to the plasma membrane (Figure 3C and Supplemental Movie S4). The absence of locally amplified and persistent 3-PI signals throughout the time series is best illustrated in the 3-PI map (Figure 3D). The corresponding PR map (Figure 3E) shows short-lived extension events with reduced protrusion velocity appearing after Rapa addition on opposing sides of the cell (see also Figure 3C). Similar results were observed with the second HRas siRNA targeting sequence (not shown, but see Figure 4, A and C). Silencing of NRas did not significantly affect polarized 3-PI and membrane dynamics (Supplemental Figure S3, C and D), whereas KRas knockdown had a moderate inhibitory effect (Supplemental Figure S3, G and H).
FIGURE 3:
HRas is required for local self-enhancement of PI3K activity. (A) Immunoblot showing efficient knockdown of HRas in NIH3T3 fibroblasts with two independent siRNA sequences. (B) Kinetics of 3-PI production after synthetic activation of PI3K in cells transfected with scramble or HRas siRNA #1. (C) Time series of Rapa-induced activation of PI3K in HRas-silenced cells. Arrows show protrusion events. Scale bar, 10 μm. (D,E) 3-PI and PR activity maps corresponding to the time series shown in A.
FIGURE 4:
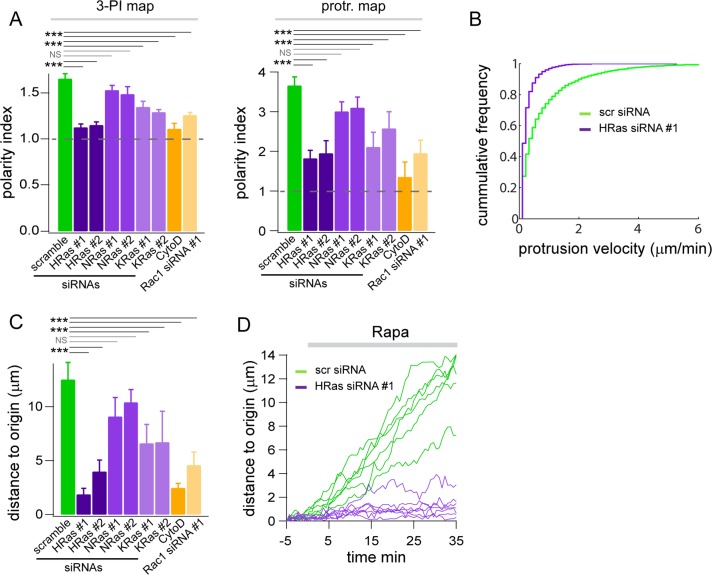
Comparison of cellular responses in control or HRas-silenced cells after synthetic activation of PI3K. (A) Average polarity indexes for the 3-PI and protrusion maps in cells transfected with scramble, HRas, NRas, KRas, or Rac1 siRNAs or treated with cytochalasin D (1 μM). For each condition 15 < n < 20. ***p < 0.001. NS: nonsignificant. (B) Cumulative frequency of protrusion velocities in control or HRas-silenced cells. (C) Average distance traveled by cells transfected with scramble, HRas, NRas, KRas, or Rac1 siRNAs or treated with cytochalasin D (1 μM) 30 min after synthetic activation of PI3K. (D) Velocity plots of individual cells transfected with control or HRas siRNA #1.
To further quantify the difference in cellular outcome between control and Ras-silenced fibroblasts, we used data from spatiotemporal maps to compute a polarity index, which reflects both the local and persistent nature of 3-PI signals or protrusion velocity (see Materials and Methods and Supplemental Figure S2). A polarity index of 1 signifies a uniform (angular) distribution of 3-PI or protrusion velocity, whereas values >1 indicate local heterogeneity. The average polarity index for 3-PI signals was significantly higher for control cells (scramble siRNA) than for cells in which HRas was silenced using two independent siRNAs (Figure 4A). Of interest, the 3-PI polarity index value for HRas-silenced cells is close to 1, which is the value predicted for CF-iSH–mediated activation of PI3K in the absence of local amplification. Similarly, the average polarity index for protrusion velocity was significantly reduced in HRas-silenced cells (Figure 4A). A cumulative frequency analysis shows a clear decrease in protrusion velocity for HRas-silenced cells (Figure 4B). Finally, displacement of the cell's centroid in response to PI3K activation was strongly suppressed by both siRNAs against HRas (Figure 4, C and D). Polarity indexes for both 3-PI and protrusion velocity, as well as initiation of a migratory response, were not significantly affected in NRas-silenced cells (Figure 4, A and C). A moderate but significant inhibition of polarized 3-PI production, membrane protrusion, and initiation of migration was observed in KRas-knockdown cells. Prompted by the results of our cross-correlation analysis (Figure 2E), we also assessed the role of actin dynamics in this feedback circuit. Cytochalasin D, a potent inhibitor of actin polymerization, disrupted local PI3K amplification and abrogated polarized membrane extension and migration (Figure 4, A and C). Similar results were obtained by silencing Rac1, a critical regulator of actin rearrangements (Figure 4, A and C, and Supplemental Figure S5A).
Collectively these results demonstrate that Ras is required for local amplification of PI3K signaling, persistent membrane protrusion, and initiation of a migratory response after synthetic activation of PI3K. HRas seems to be the predominant Ras isoform operating in this feedback circuit in NIH3T3 cells. Our data thus suggest that PI3K locally feeds back to Ras, which in turn activates PI3K, resulting in highly amplified 3-PI signals. Self-amplification also depends on Rac1 and actin dynamics, consistent with earlier observations (Weiner et al., 2002; Sasaki et al., 2007; Welf et al., 2012; Yang et al., 2012).
Synthetic activation of PI3K triggers local activation of Ras in protruding membranes
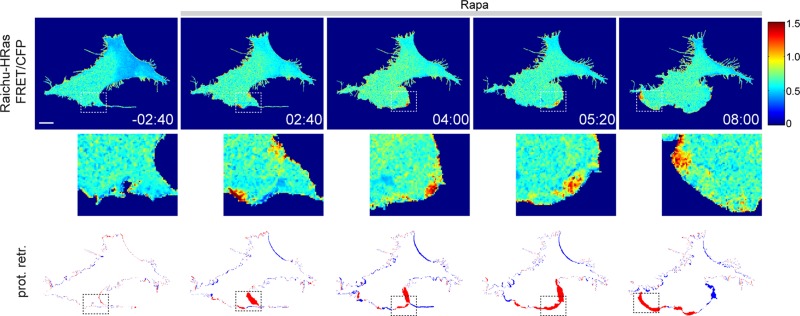
To determine whether PI3K can activate Ras, we monitored HRas activity in live cells, using a fluorescence resonance energy transfer (FRET) probe (Raichu-HRas) developed by Matsuda's group (Mochizuki et al., 2001). Because this FRET sensor is based on energy transfer from CFP to YFP, we used an mCherry-based PI3K activation probe. Synthetic activation of PI3K triggered Ras activation in confined domains that mapped to membrane extension events (Figure 5 and Supplemental Movie S7). Local Ras activation was asymmetrically distributed with a clear bias toward the emerging leading edge. HRas hot spots did not occur before synthetic activation of PI3K (Figure 5). We confirmed these results using a different (intermolecular) FRET approach, based on energy transfer between CFP-HRas and YFP-RBD (Fivaz et al., 2008). Spatially confined loci of HRas activity, which correlated with membrane elongation events, were observed after synthetic activation of PI3K (Supplemental Figure S4). Consistent with local Ras activation, we failed to observe global translocation of the YFP-RBD from the cytoplasm to the plasma membrane (Supplemental Figure S4). Together these data demonstrate that synthetic activation of PI3K triggers local Ras activation in protruding membrane domains and suggest that Ras activation downstream of PI3K is tightly linked to actin and/or membrane dynamics.
FIGURE 5:
Synthetic activation of PI3K triggers local Ras activation in protruding membranes. NIH3T3 fibroblasts were transfected with Raichu-HRas, Lyn-FKBP, and mCherry-FRB-iSH and exposed to 100 nM Rapa. FRET is displayed as the FRET/CFP ratio. Translocation of mCherry-FRB-iSH to the plasma membrane (i.e., PI3K activation) was confirmed at the end of each time series (not shown). Bottom, areas that protruded (red) or retracted (blue) in the last 40 s preceding the indicated time stamp. The white/black boxes indicate protruding regions with high Ras activity and are magnified in the middle row. Scale bar, 10 μm.
HRas is required for PDGF-induced local PI3K signaling and random cell migration
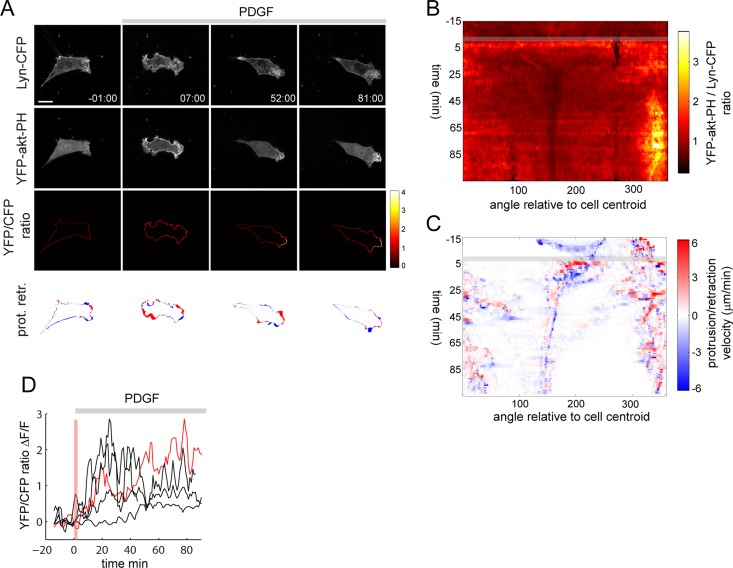
To probe the role of this feedback circuit in PDGF-induced cell motility, we first monitored 3-PI signaling in response to uniform PDGF stimulation. In contrast to CFiSH-induced PI3K activation, PDGF induced a robust but transient translocation of YFP-akt-PH to the plasma membrane (Figure 6A and Supplemental Movie S8). To quantify local 3-PI signals, we ratioed YFP-akt-PH to Lyn-CFP, a reference plasma membrane marker (Fivaz and Meyer, 2005). This ratio was measured at the cell periphery to exclude contaminating YFP-akt-PH signals in the cytoplasm. PDGF triggered a global and reversible production of 3-PIs, which was followed by a local and persistent increase in PI3K activity at the leading edge, even after the bulk of YFP-akt-PH dissociated from the plasma membrane (Figure 6A and Supplemental Movies S9 and S10). Local PI3K activity was associated with robust membrane extension (Figure 6A, bottom row, and Supplemental Movie S10) and initiation of a migratory response. The 3-PI map shows uniform PI3K activation immediately after PDGF stimulation, followed by reduction in global PI3K activity and concomitant increase in local and directionally persistent 3-PIs (Figure 6B). Of interest, local amplification of PI3K activity at the leading edge is accompanied by pronounced reduction of 3-PIs at the trailing edge (Figure 4, B and C, around 160 deg), suggesting the presence of a PI3K inhibitory mechanism at the back of the cell. The corresponding protrusion map indicates a clear spatial and temporal correlation between protrusion velocity and 3-PI signals (Figure 6C). An analysis of the kinetics of 3-PI signals revealed that PI3K amplification occurs in average ∼20 min after PDGF addition (Figure 6D).
FIGURE 6:
Local amplification of PI3K signaling in response to uniform PDGF stimulation. (A) Time-lapse imaging of cells transfected with YFP-akt-PH and Lyn-CFP and stimulated with PDGF (10 nM). Local PI3K activity is monitored by YFP-akt-PH to Lyn-CFP ratio imaging at the plasma membrane. Bottom, areas that protruded (red) or retracted (blue) in the last 60 s preceding the indicated time stamp. (B,C) 3-PI and PR maps corresponding to the time series shown in A. (D) Kinetics of 3-PI amplification in five individual cells. An average 3-PI signal was measured as a function of time from the three adjacent angular bins displaying the highest 3-PI polarity index (see Materials and Methods). The red trace corresponds to the cell shown in A. The vertical pink bar indicates the time required (∼3 min) for PI3K activation after PDGF addition at t = 0. Scale bar, 10 μm.
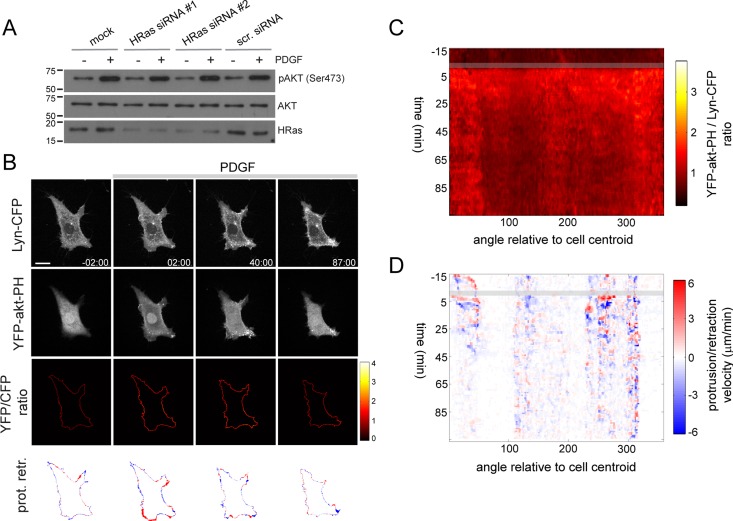
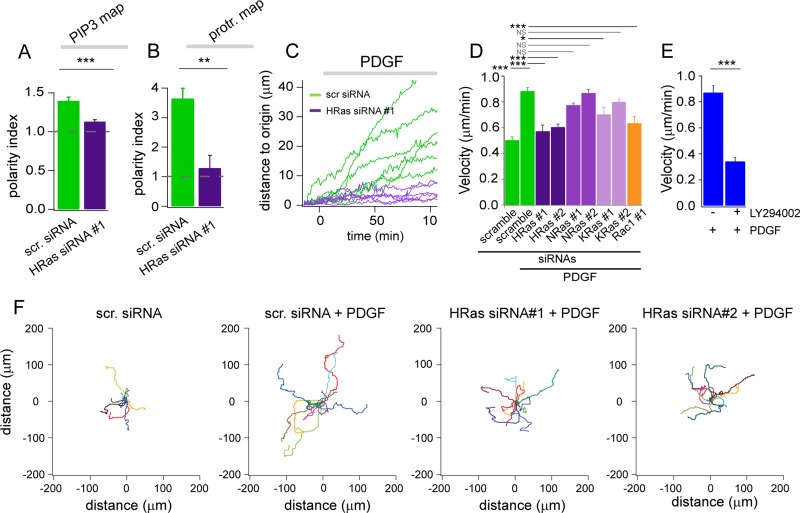
To determine whether this local PI3K response is HRas dependent, we silenced HRas by RNA interference. HRas knockdown had no detectable effect on PDGF-induced global activation of PI3K (Figure 7, A–C) in agreement with an earlier report (Gupta et al., 2007). HRas silencing, however, inhibited local 3-PI production and asymmetric membrane extension in response to PDGF (Figure 7, B–D, and Supplemental Movies S11–S13). Measurement of average polarity indexes from individual 3-PI and protrusion maps revealed a clear disruption of asymmetric PI3K and protrusion activity in HRas-silenced cells (Figure 8, A and B). Furthermore, silencing of HRas efficiently impaired PDGF-induced random cell migration (Figure 8, C, D, and F). This inhibitory effect on random migration is similar to that observed in Rac1-silenced cells (Figure 8D) and milder than that obtained by pharmacological inhibition of PI3K (Figure 8E). Knockdown of NRas and KRas, in contrast, did not substantially affect PDGF-induced cell migration (Figure 8D). Silencing of Ras isoforms or Rac1 had no significant effect on basal migration (Supplemental Figure S5B). Collectively these data show that HRas shapes local (but not global) PI3K signaling and regulates random cell migration in response to PDGF. The 3-PIs profile is strikingly similar that observed after synthetic activation of PI3K and suggests that local positive feedback between PI3K and HRas underlies cell symmetry breaking and random migration in response to uniform PDGF stimulation.
FIGURE 7:
HRas regulates local PI3K signaling in response to uniform PDGF stimulation. (A) Immunoblot showing phosphorylation of Akt in mock, scramble, and HRas siRNA–transfected cells exposed to 2 nM PDGF for 10 min. (B) Time series showing PDGF-induced PI3K activation and protrusion/retraction activity in HRas-silenced cells. (C, D) 3-PI and PR maps corresponding to the time series shown in B.
FIGURE 8:
Comparison of PDGF-induced cellular outcomes in control and HRas-silenced fibroblasts. (A, B) Average 3-PIs and protrusion polarity indexes measured in cells transfected with scramble (n = 12) and HRas #1 (n = 13) siRNAs. (C) Velocity plots of individual cells transfected with control or HRas #1 siRNAs. (D, E) Average velocity of cells transfected with scramble, HRas, NRas, KRas, or Rac1 siRNAs (85 < n < 90 for each condition) or treated with dimethyl sulfoxide (n = 30) and 50 μM LY294002 (n = 30) and randomly migrating for 4 h after PDGF (10 nM) stimulation. ***p < 0.001, **p < 0.01, *p < 0.05. NS: nonsignificant (F) Trajectories of individual cells recorded for 4 h after mock or PDGF stimulation. Cells were transfected with scramble or HRas siRNAs.
DISCUSSION
Positive feedback coupled to lateral inhibition was originally proposed by Gierer and Meinhardt (1972) as a mechanism for developmental patterning and self-organization of biological systems. Their model consists of a self-amplifying activator that regulates the production of its own diffusible long-range antagonist. Multiple lines of evidence indicate that PI3K activity may be under the control of a similar regulatory network in migrating cells. 3-PIs signals are locally amplified at the leading edge (Haugh et al., 2000; Weiner et al., 2002; Inoue and Meyer, 2008) and, in some cases, further restricted by lateral inhibition through the PtdIns(3,4,5)P3 phosphatase PTEN (Funamoto et al., 2002; Ma et al., 2004). Unclear are 1) the mechanism underlying PI3K self-amplification and 2) the functional relevance of such as feedback circuit for cell motility. In this article, we address these two important questions using an inducible approach to rapidly activate PI3K while bypassing receptor activation at the plasma membrane.
Our data demonstrate that the small GTPase Ras, and in particular the HRas isoform, is required for local amplification of PI3K activity in fibroblasts after synthetic activation of PI3K. It is possible that the stronger contribution of HRas (relative to NRas and KRas) to this feedback simply reflects higher expression of this isoform in these cells. Alternatively, there might be isoform-specific differences in localization and/or coupling efficiency to PI3K (both upstream and downstream), which may influence this amplification circuit. These results suggest that PI3K feeds back on HRas, which in turn provides stimulatory inputs to PI3K. Several lines of evidence indicate that increased PI3K activity does indeed involve feedback signaling as opposed to unidirectional inputs from HRas to PI3K. First, these experiments were carried out in cells that were serum starved for several hours, with presumably no or little basal Ras activity before PI3K activation. Second, amplification does not occur immediately after PI3K translocation, as one would predict if it was exclusively driven by HRas inputs to PI3K, but instead takes place after a delay of at least ∼10 min, which presumably reflects the time constant of this feedback circuit. Third, we showed that synthetic activation of PI3K results in Ras activation, showing direct evidence for feedback from PI3K to Ras. Ras activation downstream of PI3K is also consistent with earlier reports showing decreased Ras activity after pharmacological inhibition of PI3K (Sasaki et al., 2007; Fivaz et al., 2008; Wang et al., 2009).
Different kinetics of PI3K amplification were observed in response to chemical heterodimerization or PDGF (Figures 2D and 6D). This could reflect the fact that these two approaches are inherently different. Synthetic activation of PI3K bypasses receptor stimulation and is essentially irreversible. PDGF-induced PI3K activation, on the other hand, is to a large extent reversible (Figure 6, A and B) and probably under the control of more regulatory inputs. Self-enhancement of PI3K is local and directionally persistent (Figures 2B and 6B). How is feedback signaling spatially constrained? One possibility is that PI3K is laterally inhibited as proposed in the original Meinhardt and Gierer postulate. We find, however, no evidence for lateral inhibition of PI3K in our inducible PI3K activation studies. Local amplification of 3-PIs in the protruding edge is not accompanied by an obvious reduction of PI3K activity laterally or at the back of the cell (Figure 2, A and B). This suggests that lateral inhibition is not required for local PI3K signaling and persistent membrane extension. The absence of a long-range inhibitory mechanism could, however, reflect the artificial and irreversible activation of PI3K in our inducible system. Indeed, local amplification of 3-PI signals in response to a physiological stimulus (PDGF) is associated with a clear decrease of PI3K at the back of the cell (Figure 6, A–C) arguing for a long-range inhibitory mechanism in fibroblasts. Whether lateral inhibition is mediated by PTEN remains to be addressed. The local nature of amplified 3-PI signals in PDGF-stimulated fibroblasts (Figure 6, A and B) could explain why there was no detectable reduction of global pAkt in HRas-silenced cells (Figure 7A). On the basis of our cross-correlation analysis (Figure 2E) and the involvement of Rac1 and actin dynamics in this amplification circuit (Figure 4, A and C), we propose that random, short-lived membrane protrusions sets off the PI3K/Ras feedback circuit locally, which in turn provides the driving force for asymmetric membrane extension and cell migration. This local PI3K activation pattern can be further refined by a lateral inhibition mechanism, but inhibition is not necessarily required for robust symmetry breaking to occur.
How does PI3K activate Ras? The time constant of this feedback circuit (∼10 min in the case of synthetic PI3K activation) suggests that PI3K-mediated Ras activation is indirect and involves intermediate components. Our FRET studies show that in response to synthetic PI3K activation HRas is selectively activated in membrane-protruding domains (Figure 5), suggesting that Ras activation may occur downstream of actin and/or membrane rearrangements. This model is consistent with an earlier report in Dictyostelium showing that PI3K-mediated Ras activation is actin dependent (Sasaki et al., 2007) and provides an attractive mechanism for spatial confinement of this feedback circuit. The sensing mechanism that couples actin/membrane dynamics to Ras activation is not known and will be the object of future investigation.
Directional persistence in fibroblasts typically lasts ∼30 min on average (Ware et al., 1998) before the cell eventually changes direction. This suggests that self-perpetuating PI3K signals must be down-regulated or at least reoriented for a change in direction to occur. Recent data indicate that reorientation can occur through the development of a new branch from the leading edge, a process that is stabilized by PI3K activity (Welf et al., 2012). In light of these data, it is possible that local perturbations within the leading edge lead to preferential amplification of PI3K signals in one branch and a subsequent change in direction. Although formulated for the case of spontaneous cell polarization and random migration, our model may also be applicable to chemotaxis, where spatial bias of this Ras-PI3K feedback by increased local receptor occupancy could promote membrane extension toward the chemoattractant cue.
MATERIALS AND METHODS
DNA constructs and other reagents
The CF-iSH, Lyn-FRB, and Lyn-FKBP constructs were previously described (Inoue et al., 2005; Inoue and Meyer, 2008; Suh et al., 2006). YFP-akt-PH (Kontos et al., 1998) and CFP-HRas constructs were gifts from Tobias Meyer (Department of Chemical and Systems Biology, Stanford University, Stanford, CA). mCherry-FRB-iSH was cloned from CFP-FRB-iSH (Lin et al., 2013). Raichu-HRas was a gift from M. Matsuda (Department of Bioimaging and Cell Signaling, Kyoto University, Kyoto, Japan). Rapamycin was from Calbiochem (La Jolla, CA). LY294002 was purchased from Tocris (Ellisville, MO). siRNAs against mouse H-, N-, K-Ras, and Rac1 were from Dharmacon (Lafayette, CO). PDGF-BB mouse was from Sigma-Aldrich (St. Louis, MO). The sequences of siRNAs used in this work are as follows: HRas siRNA #1, GGACCUUGCUCGCAGCUAU; HRas siRNA #2, CGAGUAUGAUCCCACUAUA; NRas siRNA #1, GCUCAACAGCAGUGACGAU; NRas siRNA #2, GAACAGUUAUCUCGGUUAA; KRas siRNA #1, GGUUGGAGCUGGUGGCGUA; KRas siRNA #2, GGUGUACAGUUAUGUGAAU; Rac1 siRNA #1, AGACGGAGCUGUUGGUAAA; and Rac1 siRNA #2, GCGUUGAGUCCAUAUUUAA.
Tissue culture and transfection
NIH3T3 fibroblasts were grown in DMEM (Life Technologies, Carlsbad, CA) supplemented with 10% fetal bovine serum. Cells were transfected with Lipofectamine 2000 (Invitrogen, Carlsbad, CA) according to the manufacturer's instructions. Cells were starved at least 6 h before imaging in DMEM supplemented with 0.5% bovine serum albumin and l-glutamine.
Live-cell confocal imaging
Time-lapse confocal microscopy was performed on an inverted Eclipse TE2000-E microscope (Nikon, Melville, NY) equipped with a spinning-disk confocal scan head (CSU-10; Yokogawa, Tokyo, Japan), an autofocusing system (PFS; Nikon), and a temperature/CO2–controlled automated stage. Images were acquired with a Cool SNAP HQ2 charge-coupled device camera (Photometrics, Tucson, AZ) driven by MetaMorph 7.6 (Molecular Devices, Sunnyvale, CA). For short-term imaging (up to 40 min) cells were imaged in Tyrode's buffer (150 mM NaCl, 5 mM KCl, 1 mM CaCl2, 1 mM MgCl2, 6 mM glucose, 25 mM 4-(2-hydroxyethyl)-1-piperazineethanesulfonic acid, pH 7.4) at 36.5°C. For long-term imaging (several hours) cells were imaged in cell culture medium in 5% CO2 at 36.5°C.
Image analysis
All image analysis was done with MATLAB. MetaMorph time series (stacks) were read in MATLAB using the tiffread function written by the Nedelec lab (www.cytosim.org/other/). MATLAB scripts are available upon request.
3-PIs measurements.
Global production of 3-PIs at the plasma membrane was measured by depletion of YFP-akt-PH from the cytoplasm (reflecting translocation to the plasma membrane) as described in Fivaz et al. (2008). The translocation index is defined as (Fo − Ft)/Fo, where F represents the fluorescence intensity in a cytoplasmic region of interest. Local 3-PI signals were quantified by dual-color ratio imaging of YFP-akt-PH and CF-iSH or Lyn-CFP as a reference. Ratio imaging was performed on 2 × 2 low-pass filtered images to remove high-frequency noise. The YFP-to-CFP image ratio was multiplied by an arbitrary constant and cleaned up by taking the minimum between the ratio image and a binary image derived from the CFP channel. Relative ratio values are displayed in a color bar for each image or stack. In some cases, ratio values were selectively measured at the cell periphery (to avoid contaminating signals from the cytoplasm). For this, a “plasma membrane (PM)” mask was computed by subtracting an eroded binary image to the primary binary image. Ratio values were then only measured within the PM mask by taking the minimum between the primary ratio image and the PM mask.
Membrane protrusion/retraction.
Protruded and retracted areas were measured for each time interval from binarized image stacks. Protruded areas (colored in red) correspond to pixels present at time t but not t − 1. Conversely, retracted areas (colored in blue) correspond to pixels present at time t − 1 but not at time t. The time interval is 40 and 60 s for CF-iSH– and PDGF-induced activation of PI3K, respectively.
Spatiotemporal maps.
Spatiotemporal maps were generated according to a method described by Welf et al. (2012). For protrusion/retraction maps, the angle of each protruded or retracted pixel relative to the cell's centroid was measured (and rounded to the nearest whole angle) for each frame of the time series (Supplemental Figure S2). The cell's centroid was recalculated for each frame. Protrusion and retraction velocities were calculated as the change in the number of protruded and retracted pixels along a given angle between two adjacent frames and are expressed in micrometers/minute. Protrusion/retraction velocities are then plotted for each angle and as a function of time. A similar approach was used to generate 3-PI maps. In this case the average YFP-to-CFP ratio was calculated for all pixels along a given angle and within the cell. To compare these maps across different cells, we computed a polarity index for both 3-PI and protrusion maps. 3-PI maps of individual cells were divided in 20 angular bins, and the sum of 3-PI signals (YFP-to-CFP ratio) was measured for each bin after Rapa addition to the end of the time series. The 3-PI values for the three adjacent bins with the highest PI3K activity were then added and divided by the sum of PI3K activities in all 20 bins and normalized to the value predicted for uniform PI3K activity (3/20 = 0.15). This ratio was then used as our polarity index for PI3K activity. The same three bins in the protrusion map were then used to define the polarity index for protrusion velocities. The computation of these maps and polarity ratios are further illustrated in Supplemental Figure S2. To determine the kinetics of PI3K amplification, the average YFP-to-CFP ratio for the three adjacent bins with the highest PI3K activity is plotted as a function of time after addition of Rapa.
Cross-correlation analysis.
Time-lagged cross-correlations between the protrusion velocity and 3-PI maps were calculated using the MATLAB function corr2.
FRET measurements.
Intramolecular (Raichu-HRas) and intermolecular (CFP-HRas/YFP-RBD) FRET measurements were performed as previously described (Fivaz et al., 2008). FRET is displayed as the intensity in the FRET channel (corrected for bleed through) divided by the donor (CFP) intensity. For measurements involving mCherry-FRB-iSH, we verified that there was no contribution of mCherry to the FRET channel.
Cell migration.
Trajectories of migrating cells were measured using the track point algorithm in MetaMorph.
Statistical analysis
The p values are derived from unpaired t tests.
Supplementary Material
Acknowledgments
We thank Pat Casey, Chris Counter, and Mathijs Voorhoeve for critical reading of the manuscript. This work was supported by the Singapore Ministry of Education Academic Research Fund (MOE Tier 2, T208B3101) and the Duke-NUS Signature Research Program funded by the Agency for Science, Technology and Research, Singapore, and the Ministry of Health, Singapore. This study was also partly supported by National Institutes of Health Grant GM092930 to T.I.
Abbreviations used:
- CFiSH
CFP-FKBP fused to a truncated form of p85
- CFKBP
CFP-FKBP
- FKBP
FK506-binding protein
- FRB
FKBP-and-rapamycin–binding protein
- FRET
Forster resonance energy transfer
- PDGF
platelet-derived growth factor
- PI3K
phosphoinositide 3-kinase
- 3-PI
3′-phosphoinositide
- PTEN
phosphatase and tensin homologue
- Rapa
rapamycin
- RBD
Ras-binding domain
Footnotes
This article was published online ahead of print in MBoC in Press (http://www.molbiolcell.org/cgi/doi/10.1091/mbc.E12-12-0905) on May 15, 2013.
REFERENCES
- Altschuler SJ, Angenent SB, Wang Y, Wu LF. On the spontaneous emergence of cell polarity. Nature. 2008;454:886–889. doi: 10.1038/nature07119. [DOI] [PMC free article] [PubMed] [Google Scholar]
- Arrieumerlou C, Meyer T. A local coupling model and compass parameter for eukaryotic chemotaxis. Dev Cell. 2005;8:215–227. doi: 10.1016/j.devcel.2004.12.007. [DOI] [PubMed] [Google Scholar]
- Cantley LC. The phosphoinositide 3-kinase pathway. Science. 2002;296:1655–1657. doi: 10.1126/science.296.5573.1655. [DOI] [PubMed] [Google Scholar]
- Devreotes P, Janetopoulos C. Eukaryotic chemotaxis: distinctions between directional sensing and polarization. J Biol Chem. 2003;278:20445–20448. doi: 10.1074/jbc.R300010200. [DOI] [PubMed] [Google Scholar]
- Fivaz M, Bandara S, Inoue T, Meyer T. Robust neuronal symmetry breaking by Ras-triggered local positive feedback. Curr Biol. 2008;18:44–50. doi: 10.1016/j.cub.2007.11.051. [DOI] [PubMed] [Google Scholar]
- Fivaz M, Meyer T. Reversible intracellular translocation of KRas but not HRas in hippocampal neurons regulated by Ca2+/calmodulin. J Cell Biol. 2005;170:429–441. doi: 10.1083/jcb.200409157. [DOI] [PMC free article] [PubMed] [Google Scholar]
- Funamoto S, Meili R, Lee S, Parry L, Firtel RA. Spatial and temporal regulation of 3-phosphoinositides by PI 3-kinase and PTEN mediates chemotaxis. Cell. 2002;109:611–623. doi: 10.1016/s0092-8674(02)00755-9. [DOI] [PubMed] [Google Scholar]
- Gierer A, Meinhardt H. A theory of biological pattern formation. Kybernetik. 1972;12:30–39. doi: 10.1007/BF00289234. [DOI] [PubMed] [Google Scholar]
- Gupta S, Ramjaun AR, Haiko P, Wang Y, Warne PH, Nicke B, Nye E, Stamp G, Alitalo K, Downward J. Binding of ras to phosphoinositide 3-kinase p110alpha is required for ras-driven tumorigenesis in mice. Cell. 2007;129:957–968. doi: 10.1016/j.cell.2007.03.051. [DOI] [PubMed] [Google Scholar]
- Haugh JM, Codazzi F, Teruel M, Meyer T. Spatial sensing in fibroblasts mediated by 3′ phosphoinositides. J Cell Biol. 2000;151:1269–1280. doi: 10.1083/jcb.151.6.1269. [DOI] [PMC free article] [PubMed] [Google Scholar]
- Hoeller O, Kay RR. Chemotaxis in the absence of PIP3 gradients. Curr Biol. 2007;17:813–817. doi: 10.1016/j.cub.2007.04.004. [DOI] [PubMed] [Google Scholar]
- Iijima M, Devreotes P. Tumor suppressor PTEN mediates sensing of chemoattractant gradients. Cell. 2002;109:599–610. doi: 10.1016/s0092-8674(02)00745-6. [DOI] [PubMed] [Google Scholar]
- Inoue T, Heo WD, Grimley JS, Wandless TJ, Meyer T. An inducible translocation strategy to rapidly activate and inhibit small GTPase signaling pathways. Nat Methods. 2005;2:415–418. doi: 10.1038/nmeth763. [DOI] [PMC free article] [PubMed] [Google Scholar]
- Inoue T, Meyer T. Synthetic activation of endogenous PI3K and Rac identifies an AND-gate switch for cell polarization and migration. PLoS One. 2008;3:e3068. doi: 10.1371/journal.pone.0003068. [DOI] [PMC free article] [PubMed] [Google Scholar]
- Kamimura Y, Xiong Y, Iglesias PA, Hoeller O, Bolourani P, Devreotes PN. PIP3-independent activation of TorC2 and PKB at the cell's leading edge mediates chemotaxis. Curr Biol. 2008;18:1034–1043. doi: 10.1016/j.cub.2008.06.068. [DOI] [PMC free article] [PubMed] [Google Scholar]
- Kontos CD, Stauffer TP, Yang WP, York JD, Huang L, Blanar MA, Meyer T, Peters KG. Tyrosine 1101 of Tie2 is the major site of association of p85 and is required for activation of phosphatidylinositol 3-kinase and Akt. Mol Cell Biol. 1998;18:4131–4140. doi: 10.1128/mcb.18.7.4131. [DOI] [PMC free article] [PubMed] [Google Scholar]
- Kunida K, Matsuda M, Aoki K. FRET imaging and statistical signal processing reveal positive and negative feedback loops regulating the morphology of randomly migrating HT-1080 cells. J Cell Sci. 2012;125:2381–2392. doi: 10.1242/jcs.096859. [DOI] [PubMed] [Google Scholar]
- Lin YC, Nihongaki Y, Liu TY, Razavi S, Sato M, Inoue T. Rapidly reversible manipulation of molecular activity with dual chemical dimerizers. Angew Chem Int Ed Engl. doi: 10.1002/anie.201301219. doi: 10.1002/anie.201301219. [DOI] [PMC free article] [PubMed] [Google Scholar]
- Ma L, Janetopoulos C, Yang L, Devreotes PN, Iglesias PA. Two complementary, local excitation, global inhibition mechanisms acting in parallel can explain the chemoattractant-induced regulation of PI(3,4,5)P3 response in dictyostelium cells. Biophys J. 2004;87:3764–3774. doi: 10.1529/biophysj.104.045484. [DOI] [PMC free article] [PubMed] [Google Scholar]
- Mochizuki N, Yamashita S, Kurokawa K, Ohba Y, Nagai T, Miyawaki A, Matsuda M. Spatio-temporal images of growth-factor-induced activation of Ras and Rap1. Nature. 2001;411:1065–1068. doi: 10.1038/35082594. [DOI] [PubMed] [Google Scholar]
- Rodriguez-Viciana P, Warne PH, Dhand R, Vanhaesebroeck B, Gout I, Fry MJ, Waterfield MD, Downward J. Phosphatidylinositol-3-OH kinase as a direct target of Ras. Nature. 1994;370:527–532. doi: 10.1038/370527a0. [DOI] [PubMed] [Google Scholar]
- Saarikangas J, Zhao H, Lappalainen P. Regulation of the actin cytoskeleton-plasma membrane interplay by phosphoinositides. Physiol Rev. 2010;90:259–289. doi: 10.1152/physrev.00036.2009. [DOI] [PubMed] [Google Scholar]
- Sasaki AT, Janetopoulos C, Lee S, Charest PG, Takeda K, Sundheimer LW, Meili R, Devreotes PN, Firtel RA. G protein-independent Ras/PI3K/F-actin circuit regulates basic cell motility. J Cell Biol. 2007;178:185–191. doi: 10.1083/jcb.200611138. [DOI] [PMC free article] [PubMed] [Google Scholar]
- Srinivasan S, Wang F, Glavas S, Ott A, Hofmann F, Aktories K, Kalman D, Bourne HR. Rac and Cdc42 play distinct roles in regulating PI(3,4,5)P3 and polarity during neutrophil chemotaxis. J Cell Biol. 2003;160:375–385. doi: 10.1083/jcb.200208179. [DOI] [PMC free article] [PubMed] [Google Scholar]
- Suh BC, Inoue T, Meyer T, Hille B. Rapid chemically induced changes of PtdIns(4,5)P2 gate KCNQ ion channels. Science. 2006;314:1454–1457. doi: 10.1126/science.1131163. [DOI] [PMC free article] [PubMed] [Google Scholar]
- Suire S, et al. Gbetagammas and the Ras binding domain of p110 gamma are both important regulators of PI(3)K gamma signalling in neutrophils. Nat Cell Biol. 2006;8:1303–1309. doi: 10.1038/ncb1494. [DOI] [PubMed] [Google Scholar]
- Wang CC, Cirit M, Haugh JM. PI3K-dependent cross-talk interactions converge with Ras as quantifiable inputs integrated by Erk. Mol Syst Biol. 2009;5:246. doi: 10.1038/msb.2009.4. [DOI] [PMC free article] [PubMed] [Google Scholar]
- Ware MF, Wells A, Lauffenburger DA. Epidermal growth factor alters fibroblast migration speed and directional persistence reciprocally and in a matrix-dependent manner. J Cell Sci. 1998;111:2423–2432. doi: 10.1242/jcs.111.16.2423. [DOI] [PubMed] [Google Scholar]
- Weiger MC, Wang CC, Krajcovic M, Melvin AT, Rhoden JJ, Haugh JM. Spontaneous phosphoinositide 3-kinase signaling dynamics drive spreading and random migration of fibroblasts. J Cell Sci. 2009;122:313–323. doi: 10.1242/jcs.037564. [DOI] [PMC free article] [PubMed] [Google Scholar]
- Weiner OD, Neilsen PO, Prestwich GD, Kirschner MW, Cantley LC, Bourne HR. A PtdInsP(3)- and Rho GTPase-mediated positive feedback loop regulates neutrophil polarity. Nat Cell Biol. 2002;4:509–513. doi: 10.1038/ncb811. [DOI] [PMC free article] [PubMed] [Google Scholar]
- Welf ES, Ahmed S, Johnson HE, Melvin AT, Haugh JM. Migrating fibroblasts reorient directionality by a metastable, PI3K-dependent mechanism. J Cell Biol. 2012;197:105–114. doi: 10.1083/jcb.201108152. [DOI] [PMC free article] [PubMed] [Google Scholar]
- Xu J, Wang F, Van Keymeulen A, Herzmark P, Straight A, Kelly K, Takuwa Y, Sugimoto N, Mitchison T, Bourne HR. Divergent signals and cytoskeletal assemblies regulate self-organizing polarity in neutrophils. Cell. 2003;114:201–214. doi: 10.1016/s0092-8674(03)00555-5. [DOI] [PubMed] [Google Scholar]
- Yang HW, Shin MG, Lee S, Kim JR, Park WS, Cho KH, Meyer T, Do Heo W. Cooperative activation of PI3K by Ras and Rho family small GTPases. Mol Cell. 2012;47:281–290. doi: 10.1016/j.molcel.2012.05.007. [DOI] [PMC free article] [PubMed] [Google Scholar]
- Yoo SK, Deng Q, Cavnar PJ, Wu YI, Hahn KM, Huttenlocher A. Differential regulation of protrusion and polarity by PI3K during neutrophil motility in live zebrafish. Dev Cell. 2010;18:226–236. doi: 10.1016/j.devcel.2009.11.015. [DOI] [PMC free article] [PubMed] [Google Scholar]
Associated Data
This section collects any data citations, data availability statements, or supplementary materials included in this article.


