Abstract
Conventional point-by-point imaging schemes for laser scanning microscopy limit acquisition speeds, particularly when imaging three-dimensional volumes. We report a novel approach that achieves parallelization of multiple fields of view through the use of spectral encoding. By focusing two or more beams of different wavelengths at different positions within a suitable tissue, fluorescence or second/third harmonic generation emissions from these regions can be uniquely separated. We demonstrate that this approach can allow simultaneous in vivo imaging of fluorescence in two planes within the living rodent cortex, and of second harmonic generation in fresh tissue.
Two-photon microscopy has revolutionized in vivo imaging of the intact brain [1–3], yet capturing volumetric data at high speeds has been a major barrier to studies of complex brain networks. Recent approaches to fast volumetric microscopy have included random access sampling of three-dimensional (3-D) volumes using acousto-optic deflectors to sequentially direct a focused spot to a range of predetermined 3-D locations within the sample [4], and spiraling mirror movements to coarsely sample a 3-D volume [5,6]. Besides hardware complexities, the main disadvantage of these approaches is that speed is increased by sampling only a subset of regions of the tissue. This requires a priori knowledge about the location of cells or regions to be monitored, which not only limits the potential for discovery, but can make measurements highly sensitive to movement artifacts in vivo and provide data that is difficult to interpret and visualize. Multipoint scanning, in which grids of identical points are scanned together [7], or spatiotemporally patterned excitation [8] can significantly improve acquisition speed; however, these strategies require wide-field detection, limiting the ability to image beyond a few hundred micrometers into tissue.
Since two-photon fluorescence is a nonlinear process, fluorescence is almost exclusively generated at the focus of the excitation beam [9]. This property allows simplified detection optics compared with confocal microscopy, since for a single excitation beam, all fluorescence emission light can be collected and assumed to originate from the single illuminated spot. To build up an image, the beam is scanned to visit each point of interest. In order to use two (or more) excitation spots without impairing resolution, the emerging light must be encoded in some way. In this Letter, we demonstrate spectral encoding and linear spectral unmixing to separate signals originating from two simultaneously scanned, independent locations.
To spectrally encode, we use two excitation beams at two different wavelengths. While a single fluorophore will produce the same emission spectrum for different excitation wavelengths, a fixed ratio mixture of two or more fluorophores can produce uniquely different emissions for different excitations. By focusing each interrogation beam at a different location in the tissue (such as at two different depths) signal from two (or more) regions can be acquired exactly simultaneously.
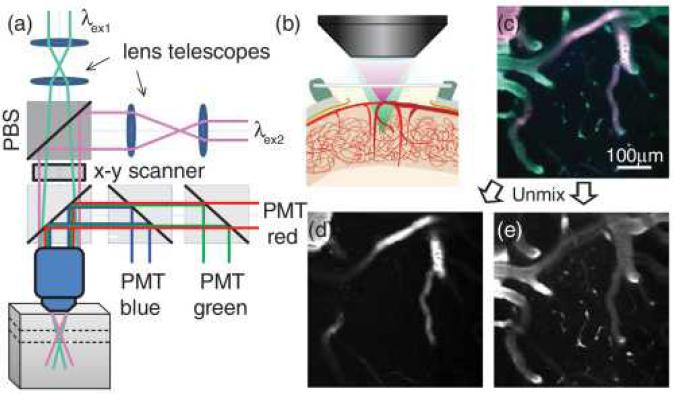
Figure 1 shows the experimental setup for dual plane spectral encoding as well as an example of dual plane unmixed fluorescence images acquired using our custom built in vivo two-photon microscope. Two Ti:sapphire lasers (MaiTai XF and MaiTai HP, both Spectra Physics) were used for dual-beam excitation. The two beams were configured to have perpendicular polarizations and were combined using a polarizing beam splitter cube before galvanometric scanning mirrors. Once both beams were aligned through the objective, the collimation of each beam's lens telescope was adjusted so that each laser would focus at a different point along the axial dimension [Figs. 1(a) and 1(b)]. Generated fluorescence was simultaneously collected by three spectrally resolved photomultiplier detectors (blue: 350–505 nm, green: 505–560 nm, and red: 560–650 nm emission ranges, R3896 Hamamatsu). The remaining system components are described elsewhere [10]. Average power at the sample was 50–100 mW, dependent on wavelength.
Fig. 1. (a) Optical layout for dual-beam, dual plane, two-photon imaging.
PBS, polarizing beam splitter; PMT, photomultiplier tube. Multimedia supplement shows alternative configuration for independent scanning of each beam (Media 1). The axial shift and resolution achieved at different lens telescope separations is characterized in Media 2. (b) In vivo brain imaging configuration where one beam is focused in the plane of larger surface vessels while the second is focused in the plane of deeper diving vessels and capillaries; (c) raw red-green-blue emission image seen when both planes are imaged simultaneously using two excitation wavelengths; (d), (e) images after unmixing show that the fluorescence signal from the two planes can be separated using linear unmixing. Further demonstration and validation of the unmixing process is included as Media 3.
Figure 1(c) shows a raw image acquired when both lasers are illuminating the living exposed cortex of a rat injected with an intravenous mixture of Texas red dextran (TRD) and dextran conjugated fluorescein (FITC-dex) (experimental details below). The pink regions of the image correspond to the TRD-dominated emission resulting from illumination with a superficially focused excitation beam tuned to 840 nm. The green regions are the FITC-dominated emissions from the more deeply focused excitation beam tuned to 780 nm. To properly separate this image into isolated images of each plane, spectral unmixing was performed as described by Eq. (1) [10,11]. This approach assumes that each laser excites a unique emission spectrum (Fλex1B,G,R or Fλex2B,G,R) captured in the red, green, and blue emission channels of our microscope and that all pixels in the combined image MB,G,R(rλex1+rλex2) are a linear combination of these two basis spectra. The coefficients k(rλex1,2) depict the relative presence of each basis spectrum in each pixel of the combined image, and therefore the regions excited by each beam in the two separate planes. A more detailed illustration of this method, including residual analysis, is provided as supplemental Media 3. Images of k [as in Figs. 1(d) and 1(e)] were extracted using a nonnegative least squares fit solution to Eq. (1) for every data point using MATLAB:
| (1) |
It should be noted that adjusting the axial position of the focus by varying the collimation of the beams entering the objective will ultimately affect the two-photon excitation efficiency and axial resolution of the system [6]. In our case, the maximum achievable axial separation of the two imaging planes was around 75 μm, with a corresponding variation in axial point spread function of 43%. These measurements are provided as Media 2. We note that beam integrity could be better preserved using remote focusing via a second objective [12,13] or by using adaptive optics.
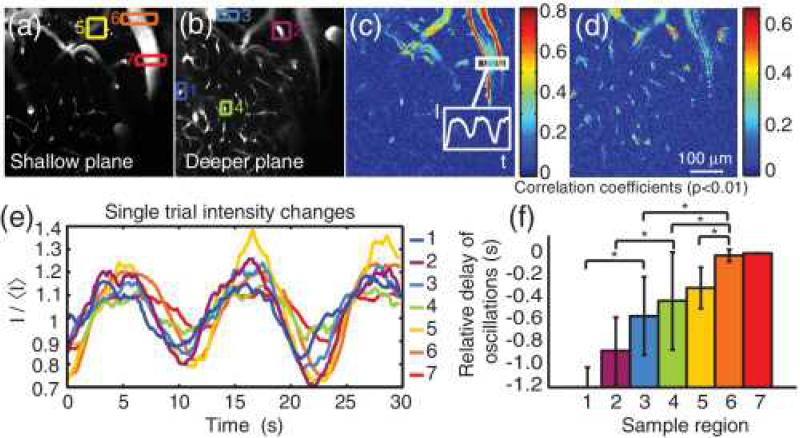
Our approach provides the ability to acquire dynamic images in two planes exactly simultaneously. Recent work by Tian et al. [14] determined the direction of propagation of dilation in diving cortical arterioles in the brain during somatosensory stimulation but needed to use multiple repeated stimuli while scanning at different depths to discern the relative timing of responses in different planes. Resting state fluctuations in brain blood flow are currently of significant interest, since they are thought to infer connectivity between similarly varying regions throughout the brain and are exploited in functional connectivity magnetic resonance imaging (FC-MRI) [15]. To explore depth-resolved vasomotor dynamics of spontaneous fluctuations in blood flow, the relative timing of vascular modulations at different depths cannot be assessed using sequential scanning. Figure 2 shows the results of dynamic, dual plane imaging of the living rat cortex during spontaneous fluctuations in blood flow. Dynamic data were acquired as 250×250 pixel images at 6.4 frames/s for 20–30 s. Images of the two measured planes were also acquired, with each of the excitation lasers to provide the spectral basis (Fλex1,2,B,G,R) for unmixing using Eq (1). Dynamic data sets were spectrally unmixed to generate separate movies of the two simultaneously imaged planes [Figs. 2(a) and 2(b)]. Since both full planes were imaged, cross-correlation analysis can be used to identify vessel segments with temporally similar patterns, as well as the relative phase delays of their fluctuations. Figures 2(c) and 2(d) show phase-independent correlation coefficients that guided selection of seven regions of interest in Figs. 2(a) and 2(b). Intensity fluctuations within these seven regions [Fig. 2(e)] were analyzed to extract the relative delay of changes in each vessel branch [Fig. 2(f)]. Similar analysis was performed in three rats (Sprague Dawley, 208–348 g) under intravenous (IV) alpha-chloralose anesthesia (40 mg kg–1 h–1). Over 38 trials, changes in tone in deeper vessels preceded changes at the surface in all cases, p<7×10⁻⁷, suggesting deep-to-shallow propagation of a vasomodulatory signal. Animals were prepared as described in [16]. Images were acquired through a glass cranial window formed over the somatosensory cortex after removal of overlying skull and dura. Around 0.3 ml of a 2:5 dye combination of dextran-conjugated fluorescein (FD2000S, Sigma-Aldrich, 0.025 mM in saline) and dextran Texas Red (D1830, Invitrogen, 0.18 mM in saline) was injected via an IV femoral cannula to provide vascular contrast. The animal's head was affixed in a stereotaxic frame throughout cranial surgery and imaging. Excitation wavelengths used were 840 and 780 nm for shallow and deeper planes, respectively.
Fig. 2. Multiregion timing analysis highlights advantages of imaging two planes in parallel.
(a), (b) Unmixed images of two simultaneously acquired planes. Colored and numbered boxes indicate the regions analyzed, chosen based on strong correlation coefficients on maps in (c) (shallow) and (d) (deep) calculated with respect to the intensity time course extracted from the region indicated in (c). Only significant correlation coefficients (p<0.01) are displayed. (e) Intensity values over time of the seven regions shown in (c) and (d); (f) temporal delays with respect to region 7, calculated from cross-correlation analysis (such that region 1 was the earliest to change). Values shown are the mean of 10 trials, with error bars showing one standard deviation above and below the mean. Region 7 has no error because for each trial, the delay to itself was necessarily zero. Groups with significantly different means (p<0.05) are indicated by an asterisk.
For fluorescence imaging, parallelization via spectral encoding is limited by the need for dye combinations that produce unique emission spectra at different excitation wavelengths. However, with a stable mixture of at least two fluorophores, increased numbers of regions or planes could be acquired by increasing the number of spectrally resolved excitation beams and detection channels.
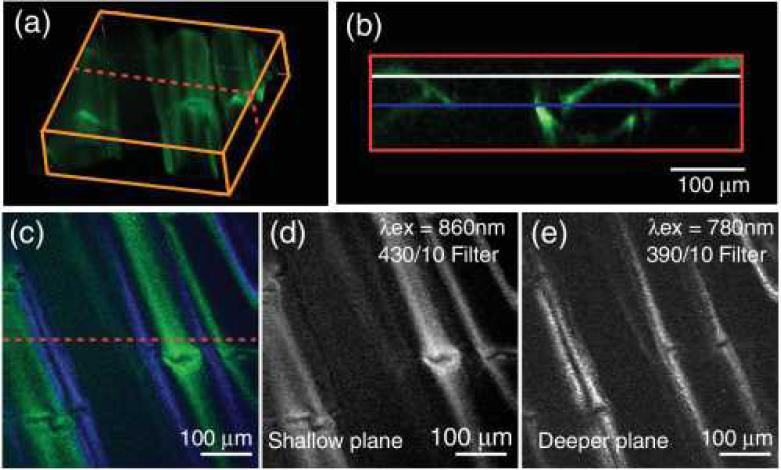
We also consider the value of this approach for second or third harmonic generation (S/THG) nonlinear contrast instead of fluorescence. In the case of S/THG, each excitation beam will generate its own unique emission at 1/2 or 1/3rd of the excitation wavelengths [17]. Therefore, in samples with S/THG contrast, by acquiring two or more spectrally resolved emission channels, we can spectrally isolate and cleanly delineate emissions coming from one excitation beam versus the other without relying on spectral unmixing. This is demonstrated in Fig. 3, which exploits SHG contrast in the tail of a small fish (postmortem). Here, two planes were simultaneously imaged by simply using narrow-band filters centered at half the excitation wavelengths on our detectors and required no spectral unmixing. The rendering in Fig. 3(a) is from a single-laser stack using 2 μm z increments and is made up of 65 400×400 pixel frames. For S/THG imaging, almost unlimited spectrally narrow harmonics could be generated and easily separated. Spectrometer-based detection could even be combined with spatiospectrally patterned broadband illumination, such as from a supercontinuum laser allowing very high speed volumetric imaging of SHG/THG contrast.
Fig. 3. Dual plane SHG imaging.
(a) 3-D rendering (using ImageJ) of a postmortem small fish tail, imaged using 860 nm excitation with a 430/10 nm filter for detection; (b) cross section of volume [at dotted line in (a) and (c)] shows the imaging planes of the two beams, positioned ~36 μm apart; (c) raw 400×400 pixel RGB image recorded with both lasers. Excitation wavelengths were 860 and 780 nm for the upper and lower planes, respectively; 390/10 and 430/10 nm emissions are color coded blue and green, respectively; (d) isolated SHG signal from upper level (z=–30 μm) and (e) from lower level (z=–66 μm).
Spectral encoding can feasibly be combined with temporal encoding to further improve parallelization. Temporal encoding splits the excitation beam into beamlets and applies either different temporal delays or modulation frequencies to each, which can be separated using high-speed time-resolved detectors. This recently demonstrated approach requires significant excitation and emission hardware modifications and is limited by the number of fluorescence lifetimes that can be repeated within the source laser's repetition rate [12,18].
This Letter demonstrated a simple method to parallelize laser scanning microscopy using spectral encoding, which overcomes the disadvantages of conventional multibeam and wide-field approaches to high-speed imaging. Encoding in this way is compatible with most dual beam two-photon and S/THG microscopes, as well as confocal setups. While dual plane imaging was demonstrated here, extensions could include imaging laterally displaced regions, multiple regions with differently sized fields of view (such as a single cell, and its network), or multiple regions imaged at different speeds.
Supplementary Material
Acknowledgments
Supported by the Human Frontier Science Program (HFSP), National Institutes of Health (NIH) grants R01NS076628 and R01NS063226, National Science Foundation (NSF) CAREER 0954796, Instrument Development for Biological Research (IDBR) 1063315, and NSF Graduate Research Fellowship Program (GRFP) fellowships to L. E. Grosberg and B. R. Chen.
References
- 1.Helmchen F, Denk W. Nat. Meth. 2005;2:932. doi: 10.1038/nmeth818. [DOI] [PubMed] [Google Scholar]
- 2.McCaslin AFH, Chen BR, Radosevich AJ, Cauli B, Hillman EMC. J. Cereb. Blood Flow Metab. 2011;31:795. doi: 10.1038/jcbfm.2010.204. [DOI] [PMC free article] [PubMed] [Google Scholar]
- 3.Ohki K, Chung S, Ch'ng YH, Kara P, Reid RC. Nature. 2005;433:597. doi: 10.1038/nature03274. [DOI] [PubMed] [Google Scholar]
- 4.Duemani Reddy G, Kelleher K, Fink R, Saggau P. Nat. Neurosci. 2008;11:713. doi: 10.1038/nn.2116. [DOI] [PMC free article] [PubMed] [Google Scholar]
- 5.Gobel W, Kampa BM, Helmchen F. Nat. Meth. 2007;4:73. doi: 10.1038/nmeth989. [DOI] [PubMed] [Google Scholar]
- 6.Grewe BF, Voigt FF, van't Hoff M, Helmchen F. Biomed. Opt. Express. 2011;2:2035. doi: 10.1364/BOE.2.002035. [DOI] [PMC free article] [PubMed] [Google Scholar]
- 7.Bewersdorf J, Pick R, Hell SW. Opt. Lett. 1998;23:655. doi: 10.1364/ol.23.000655. [DOI] [PubMed] [Google Scholar]
- 8.Papagiakoumou E, de Sars V, Oron D, Emiliani V. Opt. Express. 2008;16:22039. doi: 10.1364/oe.16.022039. [DOI] [PubMed] [Google Scholar]
- 9.Denk W, Strickler JH, Webb WW. Science. 1990;248:73. doi: 10.1126/science.2321027. [DOI] [PubMed] [Google Scholar]
- 10.Radosevich AJ, Bouchard MB, Burgess SA, Chen BR, Hillman EM. Opt. Lett. 2008;33:2164. doi: 10.1364/ol.33.002164. [DOI] [PMC free article] [PubMed] [Google Scholar]
- 11.Grosberg LE, Radosevich AJ, Asfaha S, Wang TC, Hillman EM. PLoS One. 2011;6:e19925. doi: 10.1371/journal.pone.0019925. [DOI] [PMC free article] [PubMed] [Google Scholar]
- 12.Hoover EE, Young MD, Chandler EV, Luo A, Field JJ, Sheetz KE, Sylvester AW, Squier JA. Biomed. Opt. Express. 2011;2:113. doi: 10.1364/BOE.1.000113. [DOI] [PMC free article] [PubMed] [Google Scholar]
- 13.Salter PS, Carbone G, Botcherby EJ, Wilson T, Elston SJ, Raynes EP. Phys. Rev. Lett. 2009;103:257803. doi: 10.1103/PhysRevLett.103.257803. [DOI] [PubMed] [Google Scholar]
- 14.Tian P, Teng IC, May LD, Kurz R, Lu K, Scadeng M, Hillman EM, De Crespigny AJ, D'Arceuil HE, Mandeville JB, Marota JJ, Rosen BR, Liu TT, Boas DA, Buxton RB, Dale AM, Devor A. Proc. Natl. Acad. Sci. U.S.A. 2010;107:15246. doi: 10.1073/pnas.1006735107. [DOI] [PMC free article] [PubMed] [Google Scholar]
- 15.Fox MD, Raichle ME. Nat. Rev. Neurosci. 2007;8:700. doi: 10.1038/nrn2201. [DOI] [PubMed] [Google Scholar]
- 16.Olivier N, Luengo-Oroz MA, Duloquin L, Faure E, Savy T, Veilleux I, Solinas X, Debarre D, Bourgine P, Santos A, Peyrieras N, Beaurepaire E. Science. 2010;329:967. doi: 10.1126/science.1189428. [DOI] [PubMed] [Google Scholar]
- 17.Chen BR, Bouchard MB, McCaslin AFH, Burgess SA, Hillman EMC. Neuroimage. 2011;54:1021. doi: 10.1016/j.neuroimage.2010.09.036. [DOI] [PMC free article] [PubMed] [Google Scholar]
- 18.Cheng A, Goncalves JT, Golshani P, Arisaka K, Portera-Cailliau C. Nat. Meth. 2011;8:139. doi: 10.1038/nmeth.1552. [DOI] [PMC free article] [PubMed] [Google Scholar]
Associated Data
This section collects any data citations, data availability statements, or supplementary materials included in this article.


