Abstract
Crigler-Najjar syndrome (CNS) type I and type II are usually inherited as autosomal recessive conditions that result from mutations in the UGT1A1 gene. The main objective of the present review is to summarize results of all available evidence on the accuracy of SNP-based pathogenicity detection tools compared to published clinical result for the prediction of in nsSNPs that leads to disease using prediction performance method. A comprehensive search was performed to find all mutations related to CNS. Database searches included dbSNP, SNPdbe, HGMD, Swissvar, ensemble, and OMIM. All the mutation related to CNS was extracted. The pathogenicity prediction was done using SNP-based pathogenicity detection tools include SIFT, PHD-SNP, PolyPhen2, fathmm, Provean, and Mutpred. Overall, 59 different SNPs related to missense mutations in the UGT1A1 gene, were reviewed. Comparing the diagnostic OR, PolyPhen2 and Mutpred have the highest detection 4.983 (95% CI: 1.24 – 20.02) in both, following by SIFT (diagnostic OR: 3.25, 95% CI: 1.07 – 9.83). The highest MCC of SNP-based pathogenicity detection tools, was belong to SIFT (34.19%) followed by Provean, PolyPhen2, and Mutpred (29.99%, 29.89%, and 29.89%, respectively). Hence the highest SNP-based pathogenicity detection tools ACC, was fit to SIFT (62.71%) followed by PolyPhen2, and Mutpred (61.02%, in both). Our results suggest that some of the well-established SNP-based pathogenicity detection tools can appropriately reflect the role of a disease-associated SNP in both local and global structures.
Keywords: Crigler-Najjar syndrome (CNS), UGT1A1 gene, SIFT, PHD-SNP, PolyPhen2, fathmm, Provean, Mutpred
Introduction
Crigler-Najjar syndrome (CNS) (MIM# 218800, 606785) type I and type II are usually inherited as autosomal recessive conditions that result from mutations in the UGT1A1 gene (UGT1A1; MIM# 191740) [2-5]. Type I CNS, is characterized by almost complete absence of UGT1A1 enzyme activity and these patients are refractory to phenobarbital treatment, while type II, is a less severe form of deficiency [6,7]. Patients with CNS are at permanent risk of developing severe neurologic complications such as hearing problems, mental retardation and choreoathetosis due to severe unconjugated hyper-bilirubinemia [8]. The high performance liquid chromatography (HPLC) analysis of liver enzyme assay is the conclusive diagnosis of this syndrome [9]. The UGT1A1 gene comprises five consecutive exons located at the 3’ end of the UGT1A locus on chromosome 2q37, in which genetic lesions within any one of can inactivate the enzyme completely or partially, causing CNS. Single nucleotides polymorphism (SNP), is a single variations in Deoxyribonucleic Acid (DNA) base pairs that codes for the production of protein, which lead to changes in amino acids have the potential to effect protein structure and function. There are different such SNPs in DNA including, missense mutations, nonsense, silent mutations, and splice-site mutations. The majority of missense mutations lead to appreciable change in protein structure and function, causing the disease symptoms. A large amount of data about non-synonymous single nucleotide polymorphisms (nsSNPs) now exists in public repositories such as SWISSPROT [10], dbSNP [11], and HGVBASE [12]. The main objective of the present review and meta-analysis wasto summarize results of all available evidence on the accuracy of SNP-based pathogenicity detection tools compared topublished clinical result for the prediction of in nsSNPs that leads to disease using prediction performance method.
Materials and methods
SNP data sources and collection
A comprehensive searchwas performed to find all mutations related to CNS. Database searches included dbSNP, SNPdbe, HGMD, Swissvar, ensemble, and OMIM. All the mutation related to CNS was extracted and tabulated (Table 1). All duplicated queries were removed.
Table 1.
Prediction results of SNP-based pathogenicity detection tools compared with the published results
| 0 | SNP-ID | Variant | SIFT | PhD-SNP | PolyPhen-2 | fathmm | Provean | MutPred | References |
|---|---|---|---|---|---|---|---|---|---|
| 1. | rs74720349 | V3G | Disease | 0 | 0 | 0 | 0 | Disease | 0 |
| 2. | rs201984525 | L11P | 0 | Disease | 0 | 0 | 0 | Disease | 0 |
| 3. | rs111033541 | L15R | Disease | Disease | Disease | 0 | Disease | Disease | 1 |
| 4. | rs72551339 | H39D | Disease | Disease | Disease | Disease | Disease | Disease | 1 |
| 5. | rs140365717 | E56A | Disease | 0 | Disease | Disease | Disease | Disease | 0 |
| 6. | rs4148323 | G71R | 0 | Disease | Disease | Disease | 0 | 0 | Disease |
| 7. | rs72551340 | F83I | 0 | Disease | 0 | Disease | Disease | 0 | Disease |
| 8. | rs144217005 | V109A | 0 | Disease | 0 | Disease | 0 | 0 | 0 |
| 9. | rs140867457 | I116K | 0 | 0 | 0 | Disease | Disease | 0 | 0 |
| 10. | rs200734586 | K118N | 0 | 0 | 0 | Disease | 0 | Disease | 0 |
| 11. | rs72551341 | L175Q | Disease | 0 | Disease | Disease | Disease | Disease | Disease |
| 12. | rs72551342 | C177R | 0 | 0 | Disease | Disease | Disease | Disease | Disease |
| 13. | rs201093245 | Y192C | Disease | 0 | Disease | Disease | Disease | Disease | 0 |
| 14. | rs72551343 | R209W | Disease | 0 | Disease | Disease | Disease | Disease | Disease |
| 15. | rs144398951 | I215V | 0 | 0 | 0 | Disease | 0 | 0 | 0 |
| 16. | rs144721642 | V225M | 0 | 0 | 0 | Disease | 0 | 0 | 0 |
| 17. | rs35003977 | V225G | 0 | 0 | 0 | Disease | Disease | Disease | Disease |
| 18. | rs35350960 | P229Q | 0 | Disease | Disease | Disease | 0 | Disease | Disease |
| 19. | rs147640261 | T232N | 0 | 0 | 0 | Disease | 0 | Disease | 0 |
| 20. | rs57307513 | S250P | 0 | Disease | 0 | Disease | 0 | Disease | 0 |
| 21. | rs141950052 | P267R | Disease | Disease | Disease | Disease | Disease | Disease | 0 |
| 22. | rs143072292 | V273F | Disease | Disease | 0 | Disease | Disease | Disease | 0 |
| 23. | rs72551345 | G276R | Disease | Disease | Disease | Disease | Disease | Disease | Disease |
| 24. | rs72551347 | I294T | Disease | 0 | Disease | Disease | Disease | Disease | Disease |
| 25. | rs62625011 | G308E | Disease | Disease | Disease | Disease | Disease | Disease | Disease |
| 26. | rs114000345 | K317E | 0 | Disease | 0 | 0 | 0 | 0 | 0 |
| 27. | rs200903749 | I322V | Disease | 0 | Disease | Disease | 0 | Disease | Disease |
| 28. | rs17851756 | I322T | Disease | Disease | Disease | Disease | Disease | Disease | 0 |
| 29. | rs202035422 | I329T | Disease | 0 | Disease | Disease | Disease | Disease | Disease |
| 30. | rs72551348 | Q331R | Disease | Disease | Disease | Disease | Disease | Disease | Disease |
| 31. | rs139607673 | R336W | Disease | Disease | Disease | Disease | Disease | Disease | Disease |
| 32. | rs144978321 | S343L | 0 | Disease | Disease | Disease | Disease | Disease | 0 |
| 33. | rs149750520 | N344K | Disease | 0 | Disease | Disease | Disease | 0 | 0 |
| 34. | rs201372184 | A346V | Disease | Disease | Disease | Disease | 0 | Disease | Disease |
| 35. | rs72551351 | Q357R | Disease | Disease | Disease | Disease | Disease | Disease | Disease |
| 36. | rs34946978 | P364L | 0 | 0 | Disease | Disease | Disease | 0 | 0 |
| 37. | rs55750087 | R367G | Disease | 0 | Disease | Disease | Disease | Disease | Disease |
| 38. | rs72551352 | A368T | Disease | 0 | Disease | Disease | Disease | Disease | Disease |
| 39. | rs72551353 | S375F | Disease | 0 | Disease | Disease | Disease | Disease | Disease |
| 40. | rs72551354 | S381R | Disease | Disease | 0 | Disease | 0 | Disease | Disease |
| 41. | rs143573365 | V386I | 0 | 0 | Disease | Disease | 0 | 0 | 0 |
| 42. | rs28934877 | N400H | Disease | Disease | Disease | Disease | Disease | Disease | Disease |
| 43. | rs72551355 | A401P | 0 | Disease | Disease | Disease | Disease | Disease | Disease |
| 44. | rs140613392 | R403H | 0 | 0 | Disease | Disease | Disease | Disease | 0 |
| 45. | rs36076514 | V411L | 0 | 0 | 0 | Disease | 0 | Disease | 0 |
| 46. | rs72551356 | K428E | 0 | 0 | Disease | Disease | Disease | Disease | Disease |
| 47. | rs202172337 | M441T | 0 | 0 | 0 | Disease | 0 | 0 | 0 |
| 48. | rs143033456 | R442C | Disease | Disease | Disease | Disease | Disease | 0 | 0 |
| 49. | rs201427749 | R450C | Disease | 0 | Disease | Disease | Disease | 0 | 0 |
| 50. | rs200370335 | R450H | Disease | 0 | Disease | Disease | Disease | Disease | 0 |
| 51. | rs114982090 | P451L | Disease | Disease | Disease | Disease | Disease | Disease | 0 |
| 52. | rs115410088 | F460L | Disease | 0 | Disease | Disease | Disease | Disease | 0 |
| 53. | rs72551358 | E463A | Disease | Disease | Disease | Disease | Disease | Disease | 0 |
| 54. | rs115944950 | E463D | 0 | Disease | Disease | Disease | 0 | Disease | 0 |
| 55. | rs72551359 | L474M | Disease | Disease | Disease | Disease | 0 | 0 | 0 |
| 56. | rs150687296 | R475H | Disease | 0 | Disease | Disease | Disease | Disease | 0 |
| 57. | rs34993780 | S488C | 0 | Disease | Disease | Disease | Disease | Disease | 0 |
| 58. | rs72551360 | V499M | Disease | 0 | Disease | Disease | 0 | 0 | Disease |
| 59. | rs199723856 | A511P | 0 | Disease | Disease | Disease | 0 | Disease | 0 |
Neutral, 0; References, OMIM, PMID, SNPdbe, HGMD, and Swissvar results.
Inclusion criteria
Only missense mutations on UTG1A1 gene were included.
Exclusion criteria
Those mutations that presents in other genes such as UTG1A10 and other type of mutations such as synonymous or nonsense, were excluded.
Data extraction
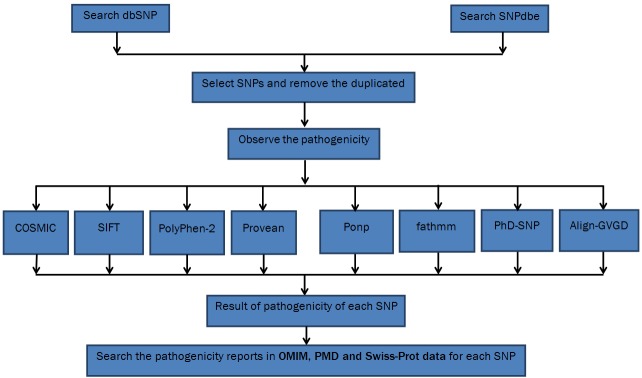
Two researchers individually reviewed all mutations retrieved and excluded irrelevant mutations according to exclusion criteria. The pathogenicity prediction was done using SNP-based pathogenicity detection tools include SIFT [1], PHD-SNP [13], PolyPhen2 [14], fathmm [15], Provean [16], and Mutpred [17] (Figure 1). For each SNP-based pathogenicity detection tool, we extracted a 2×2 table including positive prediction of the disease (True Positive, TP), negative prediction as neutral (True Negative, TN), positive prediction in non-diseased (False Positive, FP) and negative prediction in disease (False Negative, FN). When data were available a 2×2 table was created for each SNP-based pathogenicity detection tool. The results of SNP-based pathogenicity detection tool were compared to those results from SWISSPROT [10], dbSNP [11], and HGVBASE [12]. Then we calculated the Diagnostic Odds Ratio (diagnostic OR), which is a single indicator of test performance, varies between 0 and infinity [18].
Figure 1.

Flowchart of searching for SNPs.
Statistical analysis
All the analyses were done by SPSS 16.0. Each SNP-based pathogenicity detection tool was compered by the reference values using logistic regression. The sensitivity (Sn), specificity (Sp), accuracy (ACC), diagnostic OR, and Matthew’s correlation coefficient (MCC), were calculated using following formula:
Sensitivity (Sn) = TP/TP+FN
Specificity (Sp) = TN/TN+FP
Accuracy = (TP+TN)/(TP+FP+TN+FN)
Diagnostic OR = (Sn/1-Sn)/(1-Sp/Sp)
MCC = (TP×TN) – (FP×FN)/√(TP+FP) (TP+FN) (TN+FN) (TN+FP)
The Meta-Disk was used to calculate individual and pooled diagnostic OR, sensitivity, specificity, negative likelihood ratio, positive likelihood ratio [19]. We also compared the AUC (area under curve); which is a popular index of the overall performance of a test, using the summary receiver operating characteristic (SROC) curve [20].
Results
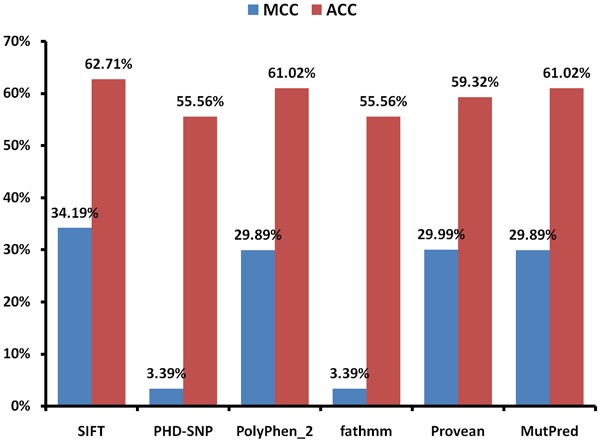
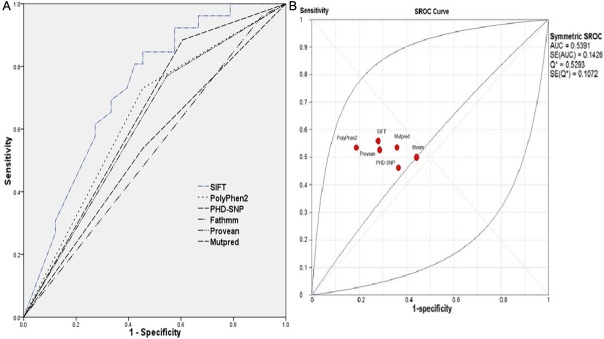
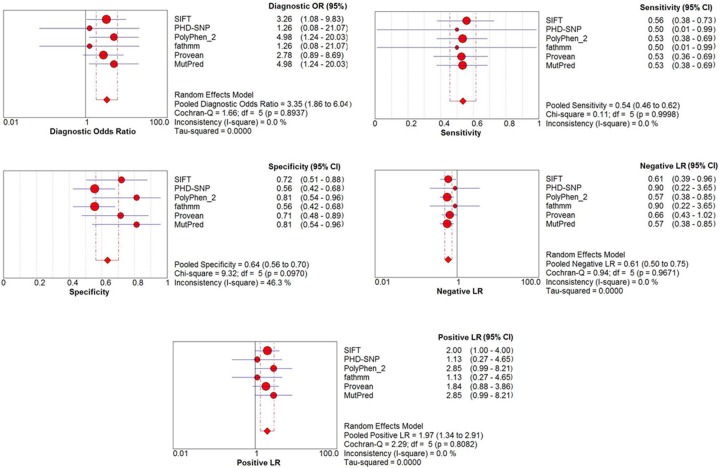
Overall, 59 different SNPs related to missense mutations in the UGT1A1 gene, were reviewed. These mutations were tested by six different and most accreted SNP-based pathogenicity detection tools (Table 1). Comparing the diagnostic OR, PolyPhen2 and Mutpred have the highest detection 4.983 (95% CI: 1.24 – 20.02) in both, following by SIFT (diagnostic OR: 3.25, 95% CI: 1.07 – 9.83) (Figure 2). The highest MCC of SNP-based pathogenicity detection tools, was belong to SIFT (34.19%) followed by Provean, PolyPhen2, and Mutpred (29.99%, 29.89%, and 29.89%, respectively) (Figure 3). Hence the highest SNP-based pathogenicity detection tools ACC, was fit to SIFT (62.71%) followed by PolyPhen2, and Mutpred (61.02%, in both) (Figure 4). The SROC curves reflected an acceptable but not good overall diagnostic performance for the SNP-based pathogenicity detection tools (Figure 4). The AUC analysis showed a significance overall performance of SIFT as aSNP-based pathogenicity detection tool (Table 2).
Figure 2.
The individual and pooled diagnostic OR, sensitivity, specificity, negative likelihood ratio, positive likelihood ratio.
Figure 3.

Calculated Matthew’s correlation coefficient (MCC) and accuracy (ACC) of the selected SNP-based pathogenicity detection tools.
Figure 4.

The receiver operating characteristic (ROC) curve (A), and summary receiver operating characteristic (SROC) curve (B) of the selected SNP-based pathogenicity detection tools.
Table 2.
Area under curve for all the selected SNP-based pathogenicity detection tools
| Tools | Area | Std. Error | P-value | 95% CI |
|---|---|---|---|---|
| SIFT | .728 | .065 | .003* | 0.600 – 0.856 |
| PolyPhen2 | .638 | .073 | .070 | 0.495 – 0.781 |
| PHD-SNP | .542 | .076 | .583 | 0.393 – 0.691 |
| Provean | .639 | .072 | .068 | 0.498 – 0.780 |
| fathmm | .612 | .074 | .143 | 0.467 – 0.756 |
| Mutpred | .639 | .072 | .068 | 0.498 – 0.780 |
Significant, p<0.05.
Discussion
We attempted to identify variables predictive diagnostic accuracy of different available SNP-based pathogenicity detection tools compared to the actual result from the patient’s data as reference. We have analyzed the effect of a set of disease-causing missense mutations arising from SNP, and a set of newly determined SNPs from the general population. The susceptibility of human inherited disease is most frequently associated with SNPs, hence the mechanisms by which this occurs are still poorly known. From a biological standpoint, the mutual restraint of residues is important for the proper functioning of a suitable protein structure [21]. Sensitivity was not reduced, while higher sensitivity was observed with PolyPhen2 and Mutpred followed by SIFT. We compared several well-established SNP-based pathogenicity detection tools, which the satisfactory performance of SIFT and PolyPhen2 indicates the importance of a mutation position in the context of the entire protein. It is therefore reasonable to believe that analyzing the results of some SNP-based pathogenicity detection tools such as, SIFT and PolyPhen2 in a protein thought is both feasible and promising, but not very excellent.
Ng and Henikoff provided an overview of amino acid substitution (AAS) prediction methods called “SIFT”, which use sequence and/or structure to predict the effect of amissense mutation on protein function. They compared the detection accuracy to other available tools and claimed that it is a good SNP-based pathogenicity detection tools [1]. Capriotti et al [13], developed a method based on support vector machines (SVMs) called “PHD-SNP” that starting from the protein sequence information can predict whether a new phenotype derived from a nsSNP can be related to a genetic disease in humans. They reported more than 74% accuracy in the predicting whether a single point mutation can be disease related or not. Stitziel et al [14], introduced a novel application of hidden Markov models (HMM) for analyzing sequence homology of SNPs on various geometric sites named “PolyPhen2”. They claimed more than 68% accuracy in the predicting whether a single point mutation can be disease related or not. Shihab et al [15], described the Functional Analysis Through Hidden Markov Models (FATHMM) software and server: using a model weighted for human missense mutations. They claimed 71% accuracy in the predicting, which was less than SIFT (74%) but equal to PolyPhen2 (71%). Choi et al [16], developed a new algorithm, Provean (Protein Variation Effect Analyzer), which provides a generalized approach to predict the functional effects of protein sequence variations including single or multiple amino acid substitutions, and in-frame insertions and deletions. They reported 84.8% accuracy compared to SIFT (84.5%) and PolyPhen2 (84.7%) in the predicting that mutation can be disease related or not. In the present study we observed the highest accuracy in SIFT (62.71%) followed by PolyPhen2, and Mutpred (61.02%, in both).
Conclusions
Our results suggest that some of the well-established SNP-based pathogenicity detection tools can appropriately reflect the role of a disease-associated SNP in both local and global structures. A major drawback of the weighted SNP-based pathogenicity detection tools is the inherited restriction that falling within conserved protein domains. Hence, unlike other sequence-based prediction tools, which are too slow for practical use in large-scale sequencing projects, the weighted tools are computationally inexpensive and fast. Although the accuracy of such SNP-based pathogenicity detection tools are not relatively high, but highlight the effects at the protein level of the pathogenic mutations, which improve the understanding of the molecular basis of mutation pathogenesis.
References
- 1.Ng PC, Henikoff S. Predicting the effects of amino acid substitutions on protein function. Annu Rev Genomics Hum Genet. 2006;7:61–80. doi: 10.1146/annurev.genom.7.080505.115630. [DOI] [PubMed] [Google Scholar]
- 2.Lodoso Torrecilla B, Palomo Atance E, Camarena Grande C, Diaz Fernandez MC, Hierro Llanillo L, De la Vega Bueno A, Frauca Remacha E, Munoz Bartolo G, Jara Vega P. [Crigler-Najjar syndrome: diagnosis and treatment] . An Pediatr (Barc) 2006;65:73–78. doi: 10.1157/13090900. [DOI] [PubMed] [Google Scholar]
- 3.Nair KM, Lohse P, Nampoothiri S. Crigler-Najjar syndrome type 2: Novel UGT1A1 mutation. Indian J Hum Genet. 2012;18:233–234. doi: 10.4103/0971-6866.100776. [DOI] [PMC free article] [PubMed] [Google Scholar]
- 4.Sagili H, Pramya N, Jayalaksmi D, Rani R. Crigler-Najjar syndrome II and pregnancy outcome. J Obstet Gynaecol. 2012;32:188–189. doi: 10.3109/01443615.2011.636158. [DOI] [PubMed] [Google Scholar]
- 5.Aloulou H, Ben Thabet A, Khanfir S, Ben Mansour L, Chabchoub I, Labrune P, Kammoun T, Hachicha M. [Type I Crigler Najjar syndrome in Tunisia: a study of 30 cases] . Tunis Med. 2010;88:707–709. [PubMed] [Google Scholar]
- 6.Iolascon A, Meloni A, Coppola B, Rosatelli MC. Crigler-Najjar syndrome type II resulting from three different mutations in the bilirubin uridine 5’-diphosphate-glucuronosyltransferase (UGT1A1) gene. J Med Genet. 2000;37:712–713. doi: 10.1136/jmg.37.9.712. [DOI] [PMC free article] [PubMed] [Google Scholar]
- 7.Shevell MI, Bernard B, Adelson JW, Doody DP, Laberge JM, Guttman FM. Crigler-Najjar syndrome type I: treatment by home phototherapy followed by orthotopic hepatic transplantation. J Pediatr. 1987;110:429–431. doi: 10.1016/s0022-3476(87)80510-3. [DOI] [PubMed] [Google Scholar]
- 8.Shevell MI, Majnemer A, Schiff D. Neurologic perspectives of Crigler-Najjar syndrome type I. J Child Neurol. 1998;13:265–269. doi: 10.1177/088307389801300605. [DOI] [PubMed] [Google Scholar]
- 9.Ihara H, Nakamura H, Aoki Y, Aoki T, Yoshida M. In vitro effects of light on serum bilirubin subfractions measured by high-performance liquid chromatography: comparison with four routine methods. Clin Chem. 1992;38:2124–2129. [PubMed] [Google Scholar]
- 10.Boeckmann B, Bairoch A, Apweiler R, Blatter MC, Estreicher A, Gasteiger E, Martin MJ, Michoud K, O’Donovan C, Phan I, Pilbout S, Schneider M. The SWISS-PROT protein knowledgebase and its supplement TrEMBL in 2003. Nucleic Acids Res. 2003;31:365–370. doi: 10.1093/nar/gkg095. [DOI] [PMC free article] [PubMed] [Google Scholar]
- 11.Sherry ST, Ward MH, Kholodov M, Baker J, Phan L, Smigielski EM, Sirotkin K. dbSNP: the NCBI database of genetic variation. Nucleic Acids Res. 2001;29:308–311. doi: 10.1093/nar/29.1.308. [DOI] [PMC free article] [PubMed] [Google Scholar]
- 12.Fredman D, Munns G, Rios D, Sjoholm F, Siegfried M, Lenhard B, Lehvaslaiho H, Brookes AJ. HGVbase: a curated resource describing human DNA variation and phenotype relationships. Nucleic Acids Res. 2004;32:D516–519. doi: 10.1093/nar/gkh111. [DOI] [PMC free article] [PubMed] [Google Scholar]
- 13.Capriotti E, Calabrese R, Casadio R. Predicting the insurgence of human genetic diseases associated to single point protein mutations with support vector machines and evolutionary information. Bioinformatics. 2006;22:2729–2734. doi: 10.1093/bioinformatics/btl423. [DOI] [PubMed] [Google Scholar]
- 14.Stitziel NO, Tseng YY, Pervouchine D, Goddeau D, Kasif S, Liang J. Structural location of disease-associated single-nucleotide polymorphisms. J Mol Biol. 2003;327:1021–1030. doi: 10.1016/s0022-2836(03)00240-7. [DOI] [PubMed] [Google Scholar]
- 15.Shihab HA, Gough J, Cooper DN, Stenson PD, Barker GL, Edwards KJ, Day IN, Gaunt TR. Predicting the functional, molecular, and phenotypic consequences of amino acid substitutions using hidden Markov models. Hum Mutat. 2013;34:57–65. doi: 10.1002/humu.22225. [DOI] [PMC free article] [PubMed] [Google Scholar]
- 16.Choi Y, Sims GE, Murphy S, Miller JR, Chan AP. Predicting the functional effect of amino acid substitutions and indels. PLoS One. 2012;7:e46688. doi: 10.1371/journal.pone.0046688. [DOI] [PMC free article] [PubMed] [Google Scholar]
- 17.Li B, Krishnan VG, Mort ME, Xin F, Kamati KK, Cooper DN, Mooney SD, Radivojac P. Automated inference of molecular mechanisms of disease from amino acid substitutions. Bioinformatics. 2009;25:2744–2750. doi: 10.1093/bioinformatics/btp528. [DOI] [PMC free article] [PubMed] [Google Scholar]
- 18.Glas AS, Lijmer JG, Prins MH, Bonsel GJ, Bossuyt PM. The diagnostic odds ratio: a single indicator of test performance. J Clin Epidemiol. 2003;56:1129–1135. doi: 10.1016/s0895-4356(03)00177-x. [DOI] [PubMed] [Google Scholar]
- 19.Zamora J, Abraira V, Muriel A, Khan K, Coomarasamy A. Meta-DiSc: a software for meta-analysis of test accuracy data. BMC Med Res Methodol. 2006;6:31. doi: 10.1186/1471-2288-6-31. [DOI] [PMC free article] [PubMed] [Google Scholar]
- 20.Walter SD. Properties of the summary receiver operating characteristic (SROC) curve for diagnostic test data. Stat Med. 2002;21:1237–1256. doi: 10.1002/sim.1099. [DOI] [PubMed] [Google Scholar]
- 21.Wang Z, Moult J. SNPs, protein structure, and disease. Hum Mutat. 2001;17:263–270. doi: 10.1002/humu.22. [DOI] [PubMed] [Google Scholar]


