

Abstract
The large amount of positive genetic association data in a number of bone diseases suggests functional consequences of Vitamin D receptor (VDR) gene polymorphism. In the present study, four microsatellite markers viz., D12S1633, D12S1635, D12S347, and D12S96, that lie in the vicinity of the VDR gene on chromosome 12 were selected to assess the allele distribution pattern and diversity among three groups of individuals - normal, osteopenia and osteoporosis. Genetic association study was performed using allele frequency data. Total genomic DNA was isolated from the whole blood of 226 individuals, after recording their bone mineral density (BMD) using Dual X-ray absorptiometry (DXA). All DNA samples were subjected to multiplex Polymerase Chain Reaction (PCR) - genotyping. Allele frequencies and genetic diversity parameters like - number of alleles, average variance and average heterozygosity across all the four markers among three groups were computed. Effect of population stratification was excluded by investigating population structure. A trend of decreasing genetic diversity across four loci from normal to pre- and post-disease condition has been observed. Lesser recombination rate (θ) indicates linkage between studied microsatellite markers and VDR gene. Statistically significant linkage disequilibrium was detected for the allele - 22 of locus D12S96 with osteoporosis. A positive association of allele - 22 suggests susceptibility to disease whereas predominance of allele - 27 among non - diseased group implicates its association with normal bone health.
Keywords: Genetic diversity, microsatellites, osteopenia, osteoporosis, VDR
Introduction
Osteoporosis is prevalent worldwide as a multifactorial disease resulting from interactions between genetic and environmental factors. The World Health Organization (WHO) defines it as the bone mineral density (BMD) that lies 2.5 standard deviations or more below the average value for healthy young adults and is expressed as T-score. Genetic factors play an important role (50-85%) in the pathogenesis of bone loss. Family- and population-based studies have identified candidate genes that affect bone remodeling [1,2]. Among genes relevant to osteoporotic fractures is the gene for the Vitamin-D receptor (VDR) that impacts major signaling pathways in bone metabolism [3]. VDR mediates the action of bioactive form of vitamin D and regulates expression of other genes by forming a heterodimer complex with retinoic X receptor (RXR) [4]. This, in turn, binds to the vitamin D receptor responsive elements in the target genes. Mutations in the VDR gene result in intestinal malabsorption of calcium and phosphate minerals resulting in decreased bone mineral density [5].
Previous studies have been limited to the use of restriction enzymes with few studies highlighting the role of single nucleotide polymorphisms (SNPs) located in the promoter region and the 3´ untranslated region of the VDR gene [6-8]. Studies have identified risk alleles of osteoporosis that are not always associated with BMD score [9,10], thus making the mechanism of their action unclear.
The present study deals with microsatellite markers or short tandem repeats (STRs) situated in the vicinity (upstream and downstream) of the VDR gene. Microsatellites have been identified associated with increased risk of developing certain diseases like breast cancer [11], schizophrenia [12], and malaria [13].
Along these rationales, the current study presents a comparative account of allelic distribution and genetic diversity among three groups (normal, osteopenia and osteoporosis) classified on the basis of BMD across four microsatellite markers viz., D12S1635, D12S1663, D12S347 and D12S96 all consisting of tandem dinucleotide repeats of Cytosine and Adenine. A novel attempt has been made to understand the genetic association between alleles of selected STRs with normal and disease condition (osteoporosis and Osteopenia) in the Asian Indian population.
Materials and methods
Blood sample collection
Peripheral venous blood (1 ml) was drawn in Ethylenediaminetetraacetic acid (EDTA) vaccutainers from participants (N = 226). The procedures followed during sample collection were in accordance with the ethics guidelines of the Indian Council of Medical Research (ICMR). Dual X-ray absorptiometry (DXA) was used to assess mineral content of the bones of the lower lumbar region. Based on the BMD scores [14] unrelated individuals were classified as normal (n = 78) with T-score > -1.1 standard deviation, osteopenia (n = 72) having T-score between -1.1 to -2.5 standard deviation and osteoporosis (n = 76) with a T-score < -2.5 standard deviation. Exclusion criteria followed while recruiting individuals for the study were the presence of bone-related diseases, thyroid diseases, rheumatoid arthritis and premature cessation of regular menstruation (oophorectomy or hysterectomy). The questionnaire also included a section on physical activity and use of medications (hormone replacement therapy, use of estrogen or oral contraceptives applicable for female participants). Personal and family medical histories were collected with relevant clinical details such as age, sex, height, weight, body mass index (BMI), food habits (dietary intake of calcium) and lifestyle factors (smoking, alcohol intake). The mean age of the selected individuals (both male and females) was 55 ± 7 years.
DNA isolation
Genomic DNA was isolated from 700 μl of whole blood using the phenol-chloroform extraction method [15].
Markers
Four microsatellite markers namely D12S1663, D12S1635, D12S347 and D12S96 located near the VDR gene (cytogenetic position 12q13.11) were selected as they are highly polymorphic with large number of codominant alleles due to elevated mutation and recombination rates (~1/1000) [16].
Primer designing of selected microsatellites
Primers were designed from the genomic sequence, including flanking regions, of the VDR gene obtained from the NCBI (National Centre for Biotechnology) database (GRCh37.p5 reference assembly) (http://www.ncbi.nlm.nih.gov/). Primer3 software was used to design the primers and to ensure that the primers have similar melting temperatures (Tm) and annealing efficiency during the multiplex polymerase chain reaction (PCR) (www.genome.wi.mit.edu) [17]. Details of selected markers and primers are provided in Table 1.
Table 1.
Details of selected microsatellites (D12S1663, D12S1635, D12S347 and D12S96) on chromosome 12 and the primer used for the study
| Marker | Reference allele repeats | Repeat motif | Cytogenetic Position | Fluorescent label | Sequence (5′ → 3′) | Amplicon size (bps) |
|---|---|---|---|---|---|---|
| D12S1635 | 23 | CA | 12q13.12 | FAM | F-GCTGACTGTGGAGATTGTTGG | 164 |
| R-CGTTCTGGCCTACTTTTTGC | ||||||
| D12S1663 | 19 | CA | 12q13.11 | VIC | F-AGTGAGAAATACCAGTTGCAAAG | 167 |
| R-TGTATCCTTTCACAGCTTCCTG | ||||||
| D12S347 | 19 | CA | 12q13.00 | NED | F-TTGGACCAGAAATGGAGGTC | 175 |
| R-CCAGCAGAGTTTTGCCTTTT | ||||||
| D12S96 | 17 | CA | 12q13.13 | PET | F-GAGAGAGAAGCAAAACACACCA | 178 |
| R-TGTCTACCTGTGGCACGAAG |
For singleplex PCR reaction, primers were synthesized from Bioresource Biotech Pvt. Ltd., India. Singleplex PCR amplification of selected microsatellites was performed using 15 μl final reaction volume containing 1-5 nanogram template, 2-5 picomoles of forward and reverse primers, 1.5 units of Taq DNA polymerase, 10x PCR Buffer, 50 millimolar MgCl2, 10 millimolar deoxynucleotide triphosphates (dNTPs) and nuclease free water supplied with PCR kit (GenOmbio Technologies Pvt. Ltd., India). The thermal cycling conditions set in Mastercycler Gradient (Eppendorf, India Pvt. Ltd.) were - 95°C for 5 minutes, 95°C for 30 seconds, 54°C for 40 seconds, 72°C for 40 seconds (30 cycles) and final extension at 72°C for 5 minutes. Amplicons were resolved in 2% agarose gel. The size was found to be in the range of 160 - 180 base - pairs after visualizing under the ultra - violet light using filter 2 of Alpha Ease® FC Stand Alone software (version 4.0.0 in Alpha ImagerTM 3400 machine Alpha Innotech Corporation-2401, Merced Street, San Leandro). After the standardization of the singleplex PCR protocol, primers were sent for fluorescent dye labeling. Fluorescent dyes labeled primers (Applied Biosystems, Inc.) were used for multiplexing the four STR loci at an annealing temperature of 54°C (Figure 1).
Figure 1.
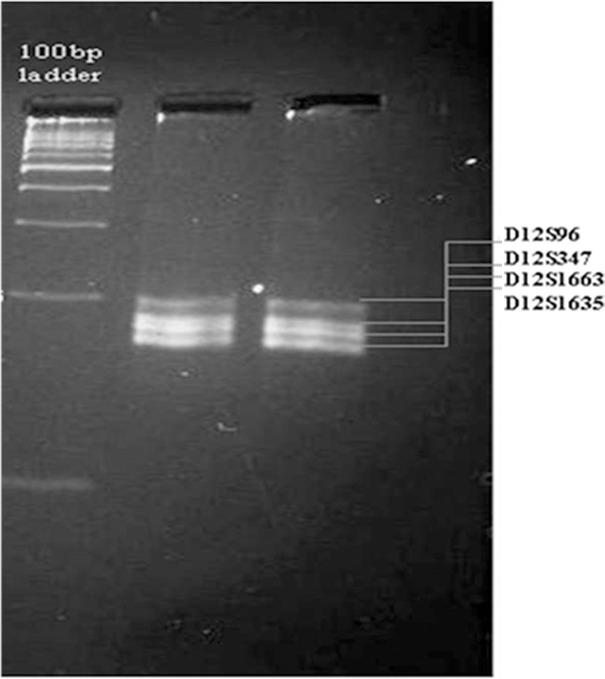
Agarose gel image (2%) of multiplex PCR. Lane - 1, ladder 100 base - pair; Lane - 2 and 3 multiplex PCR products.
Genotyping
The separation and detection of PCR products was accomplished with the ABI 3730XL Genetic Analyzer 96-capillary array system, a 50 cm capillary array part # 4331246 (Applied Biosystems, Foster City, CA) using a G5 matrix filter. GS500 LIZTM (Applied Biosystems, Foster City, CA) was used as the internal standard for sizing DNA in base pairs. Samples were prepared in Hi-DiTM formamide with 1 μl of PCR product (mixed in 9:1 ratio). Following electrophoresis and data collection, samples were analyzed with the Genescan 3.1 software program.
Statistical analysis
As the studied loci are autosomal, frequency of each allele for individual STR was calculated from the numbers of genotype in the sample set by method of gene count. The unbiased estimates of the average heterozygosity and allele size variance were computed [18] through computer simulating program MICROSAT [19]. Further investigation of population genetic structure was carried using Arlequin (version 2.000) [20]. The population structure of disease and normal groups based on their allele frequency data across selected unlinked microsatellites was inferred from STRUCTURE software (version 2.0) [21]. Recombination rate (θ) [22,23] between selected loci and VDR gene was calculated followed by analysis of allele frequency data among normal and disease groups using Chi-square test (χ2) in program MINITAB [24]. Likelihood based test was applied to check allelic association following the established model [25].
Results
The observed alleles and corresponding allele frequencies across four selected loci, D12S1635, D12S1663, D12S347 and D12S96 for osteoporosis (n = 76), osteopenia (n = 72) and normal (n = 78) groups is computed (Tables 2, 3, 4, and 5).
Table 2.
Observed allele frequencies at locus D12S1635 among three studied groups
| Observed Alleles in studied groups | Observed Allele Frequencies | ||
|---|---|---|---|
|
| |||
| Normal (n = 78) | Osteopenia (n = 72) | Osteoporosis (n = 76) | |
| 23 | 0.100 | 0.065 | 0.039 |
| 25 | 0.157 | 0.109 | 0.000 |
| 26 | 0.129 | 0.088 | 0.013 |
| 27 | 0.171 | 0.130 | 0.145 |
| 28 | 0.357 | 0.369 | 0.514 |
| 29 | 0.086 | 0.239 | 0.289 |
Table 3.
Observed allele frequencies at locus D12S1663 among three studied groups
| Observed Alleles in studied groups | Observed Allele Frequencies | ||
|---|---|---|---|
|
| |||
| Normal (n = 78) | Osteopenia (n = 72) | Osteoporosis (n = 76) | |
| 15 | 0.193 | 0.000 | 0.000 |
| 20 | 0.193 | 0.107 | 0.052 |
| 21 | 0.243 | 0.446 | 0.118 |
| 22 | 0.295 | 0.411 | 0.395 |
| 23 | 0.076 | 0.036 | 0.408 |
| 24 | 0.000 | 0.000 | 0.027 |
Table 4.
Observed allele frequencies at locus D12S347 among three studied groups
| Observed Alleles in studied groups | Observed Allele Frequencies | ||
|---|---|---|---|
|
| |||
| Normal (n = 78) | Osteopenia (n = 72) | Osteoporosis (n = 76) | |
| 20 | 0.026 | 0.047 | 0.013 |
| 21 | 0.052 | 0.141 | 0.052 |
| 22 | 0.118 | 0.188 | 0.000 |
| 23 | 0.237 | 0.265 | 0.382 |
| 24 | 0.461 | 0.094 | 0.395 |
| 25 | 0.065 | 0.000 | 0.000 |
| 26 | 0.013 | 0.032 | 0.000 |
| 27 | 0.000 | 0.014 | 0.014 |
| 28 | 0.014 | 0.125 | 0.000 |
| 29 | 0.000 | 0.094 | 0.039 |
| 30 | 0.014 | 0.000 | 0.105 |
Table 5.
Observed allele frequencies at locus D12S96 among three studied groups
| Observed Alleles in studied groups | Observed Allele Frequencies | ||
|---|---|---|---|
|
| |||
| Normal (n = 78) | Osteopenia (n = 72) | Osteoporosis (n = 76) | |
| 19 | 0.064 | 0.047 | 0.039 |
| 20 | 0.064 | 0.148 | 0.066 |
| 21 | 0.077 | 0.148 | 0.145 |
| 22 | 0.115 | 0.222 | 0.276 |
| 23 | 0.154 | 0.110 | 0.171 |
| 24 | 0.128 | 0.148 | 0.145 |
| 25 | 0.064 | 0.074 | 0.013 |
| 26 | 0.103 | 0.094 | 0.066 |
| 27 | 0.231 | 0.056 | 0.079 |
Genetic diversity and structure
Genetic diversity is analyzed by three parameters viz. total number of alleles observed, allele size variance and average heterozygosity. The observed number of alleles for the locus D12S1635 among normal and osteoporosis is found to be same (total number of observed allele is 5) whereas, in osteopenia group it is 6 (Table 2). Likewise, the observed number of alleles at loci D12S1663 and D12S347 are same (total number of observed allele is 5 and 9 respectively) among normal and osteopenia which decreases to 4 and 7 respectively in osteoporosis group (Tables 3, 4). However, at locus D12S96 the number of alleles observed is the same among all three study groups (Table 5). Thus, the sum total of alleles observed across all four STR loci in the population is greater in normal (28 alleles) and osteopenia (28 alleles) individuals than in osteoporosis (25 alleles). Average allele size variance is highest in normal individuals (3.915) followed by osteopenia (3.807) and osteoporosis (2.773) (Table 6). The average heterozygosity is again found to be highest in the normal population (0.775) and is least in osteoporotic individuals (0.640) (Table 6).
Table 6.
Diversity indices among three studied groups of individual
| Parameters | Normal (n = 78) | Osteopenia (n = 72) | Osteoporosis (n = 76) |
|---|---|---|---|
| Average allele size variance | 3.915 | 3.807 | 2.773 |
| Average heterozygosity | 0.775 | 0.730 | 0.640 |
Since the sampled population belonged to the same geographical area, so the number of alleles, allele size variance and average heterozygosity might be influenced by population admixture and mixed ancestry. Therefore, an admixture model considering correlated allele frequency is applied in STRUCTURE program version 2.0. Using a model-based clustering method the value of α, which indicates degree of admixture, is computed and estimated to be 0.101. The estimation of Q which is the membership coefficient for each individual in a cluster (Figure 2) indicate admixture in the sampled groups. Analysis of molecular variance (AMOVA) shows maximum variation within the population (94.72%) whereas among the groups, the variation is less than 5.28%. The fixation index, FST, for the whole sample is found to be 0.0528.
Figure 2.
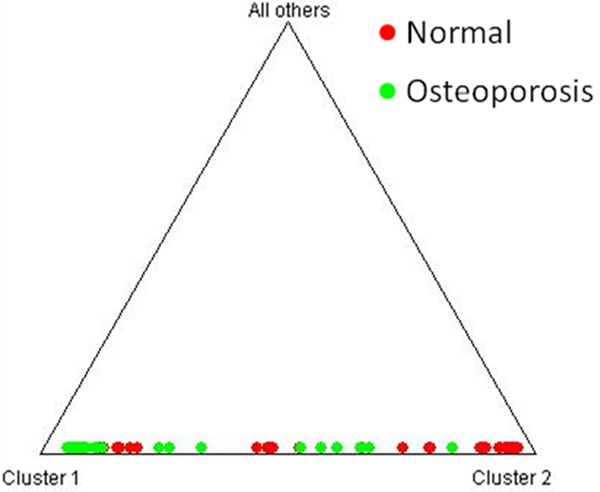
Triangle plot showing estimates of membership coefficient (Q) for each individual of sampled groups, analyzed under admixture model, assuming correlated allele frequencies.
Genetic association between microsatellite allele and disease
The genetic distance of four microsatellite markers from the VDR gene is computed to assess linkage considering a scale of 1 Mb = 1.168 cM [28]. Locus D12S1635 is found to be closest to the VDR gene (3.235 cM), whereas the computed distance between D12S96 and VDR is found to be 5.653 cM. However, the recombination rate (θ) [29], which indexes linkage between two loci, is found to be 0.49 for all the selected markers and is slightly less than the threshold value of q, which is 0.5. Although the locus D12S96 (12q13.13) is farthest from the VDR gene, it shows a significant difference in the allele frequency distribution pattern among normal and diseased condition (osteoporosis and osteopenia). To verify this allele frequency distribution pattern, we investigated the most frequent alleles (MFA) across the four markers in all groups. At locus D12S1635, allele 28 is predominantly present in three groups (Table 2). For loci, D12S1663 (Table 3) and D12S347 (Table 4), the MFA varied for different groups (osteoporosis - allele 23 and 24; osteopenia - allele 21 and 23 and normal subjects - allele 22 and 24 respectively) and no common pattern is observed across these two loci. Again, for the locus D12S96, which is farthest from the VDR gene (genetic distance - 5.653 cM) the most frequent allele was found to be same for the osteopenia and osteoporosis groups (allele - 22), whereas normal group show allele - 27 as MFA (Table 5). Thus, for further linkage analyses, microsatellite marker D12S96 is taken into consideration. The Chi-square (χ2) test is performed using program MINITAB to evaluate allele frequency distribution pattern at D12S96 among disease (osteoporosis and osteopenia) and normal group. Statistical significance was set at p < 0.05 level which confirmed that allele - 22 is present in significantly higher frequency (0.222 and 0.276) in disease condition (osteopenia and osteoporosis) than normal (observed allele frequency is 0.115) whereas, allele - 27 is predominant in the normal (observed allele frequency is 0.231) group (Figure 3).
Figure 3.
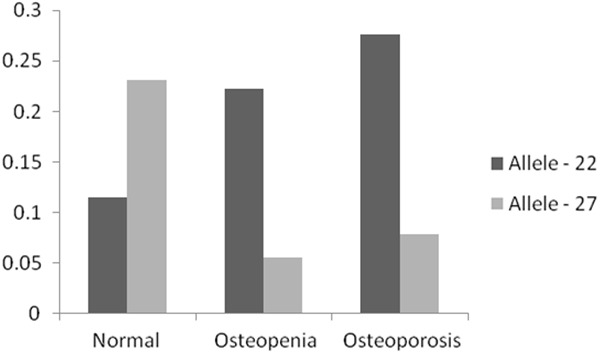
Frequency distribution of alleles - 22 and 27 at the microsatellite locus D12S96, among normal, osteopenia and osteoporosis individuals.
Linkage disequilibrium (LD) between alleles - 22 and 27 of loci D12S96 and osteoporosis is checked by applying likelihood test [30]. Here, the microsatellite locus is treated as bi-allelic marker (associated and non-associated alleles) and are represented in 2 × 2 contingency table. The χ2 value with Yates correction is calculated to be 9.670 (p < 0.001) and the coefficient of association (φ) is found to be +0.310 (range from -1 to +1). Thus, likelihood test entails a slight positive association of allele - 22 with osteoporosis and its susceptibility, while allele - 27 is non-associated with the disease. The risk ratio for associated allele - 22 of D12S96 is 2.5 [95% confidence interval (CI) 1.381 - 4.53; p < 0.001].
Discussion
The larger number of observed alleles across the four loci among normal and osteopenia groups indicates greater diversity in these two groups compared to osteoporosis. According to a priori power analysis, using G*Power 3.1 software, for one - tailed t - test with α - error set at 0.05 (power = 0.950), medium effect size (ρ) set at 0.19, coefficient of determination (r2 = 0.0361). The total recommended sample size (N) is computed to be 291. However due to stringent exclusion criteria set during sample collection we were able to collect only 226 sample. Since the number of segregating alleles is sensitive to sample size other two parameters viz., allele size variance and average heterozygosity are calculated, to substantiate the greater genetic diversity among normal and osteopenia individuals [26,27] (Table 6) compared to osteoporosis groups. The declining average allele size variance and average heterozygosity from normal, osteopenia to osteoporosis groups further indicated less genetic diversity among the later groups. Population admixture analysis along with AMOVA indicates that the participating individuals belong essentially to the same heterozygous population. So the declining diversity could be attributed to the disease prevalence.
The four loci chosen for this study are present on the same contig near VDR (12q13.11). They are polymorphic in terms of large number of reference alleles (Table 1) and hence suitable for genetic epidemiology. However, in the selected population groups, the total numbers of alleles exhibited by these loci are less. This indicates a pressure of disease on microsatellite allele diversification in the selected population.
At locus D12S1635, MFA is found to be allele - 28 in all three groups viz., osteoporosis, osteopenia and normal subjects, suggesting intergroup similarity (Table 2) and its insignificance towards disease prevalence. Similar trends of common MFA are not found for the other three markers. Moreover, the loci, D12S1633 and D12S347, though closer (genetic distance - 3.235 cM) to VDR seem to have no influence on the disease as no pattern of common MFA is observed between osteoporosis and osteopenia groups. However, at locus D12S96 the MFA is significantly different (p < 0.05) between normal and disease group (osteoporosis and osteopenia). Most of the osteoporosis (27.6%) and osteopenia (22.2%) individuals have 22 repeats of CA nucleotides as compared to normal (11.5%) among which 27 repeats of CA nucleotides are predominant. Since D12S96 locus is present at the 3´ flanking end of the VDR gene, the decrease in the number of repeat units of CA in disease (22 repeats) group than normal (27 repeats) may influence the expression of VDR gene.
Conclusion
Thus, the present study clearly depicts that the level of heterozygosity, observed range of alleles and allele size variance are higher among normal subjects than the disease groups (osteopenia and osteoporotic subjects). This decreasing trend of diversity indices from normal to osteopenia and the least among osteoporosis group depicts disease burden on the human genome that may be causing allele restriction. Taken together, the linkage analysis indicates for the first time a significant association between the allele 22 of D12S96 locus situated downstream to VDR gene and risk of osteoporosis among Asian Indians. However, further studies with larger sample sizes from wider geographical areas are required for validation.
Acknowledgement
This study was supported by a research grant of Board of College and University Development, University of Pune. The authors are thankful to Professor S. Rath, Indian Statistical Institute, Pune for all statistical analysis and valuable suggestions. We acknowledge the support of Dr. Neeraj Adkar, Sai Shree Hospital, Orthopaedic Superspeciality and Joint Replacement Center, Pune.
Disclosure of conflict of interest
Authors’ contribution: RA is the main investigator who has conceptualized the entire study. RM and BC have equally contributed to the manuscript. All authors read and approved the final manuscript.
References
- 1.Christian JC, Yu PL, Slemenda CW, Johnston CC. Heritability of bone mass: a longitudinal study in aging male twins. Am J Hum Genet. 1989;44:429–433. [PMC free article] [PubMed] [Google Scholar]
- 2.Slemenda CW, Christian JC, Williams CJ, Norton JA, Johnston CCJ. Genetic determinants of bone mass in adult women: A re-evaluation of the model and the potential importance of gene interaction on heritability estimates. J Bone Miner Res. 1991;6:651–657. doi: 10.1002/jbmr.5650060606. [DOI] [PubMed] [Google Scholar]
- 3.Melhus H, Kindmark A, Amér S, Wilén B, Lindh E, Ljunghall S. Vitamin D receptor genotypes in osteoporosis. Lancet. 1994;344:949–950. doi: 10.1016/s0140-6736(94)92297-7. [DOI] [PubMed] [Google Scholar]
- 4.Yasmin R, Williams RM, Xu M, Noy N. Nuclear import of the retinoid X receptor, the vitamin D receptor, and their mutual heterodimer. J Biol Chem. 2005;280:40152–60. doi: 10.1074/jbc.M507708200. [DOI] [PubMed] [Google Scholar]
- 5.Ralston SH, de Crombrugghe B. Genetic regulation of bone mass and susceptibility to osteoporosis. Gene Dev. 2005;20:2492–2506. doi: 10.1101/gad.1449506. [DOI] [PubMed] [Google Scholar]
- 6.Mitra S, Desai M, Ikram KM. Vitamin D receptor gene polymorphisms and bone mineral density in postmenopausal Indian women. Maturitas. 2006;55:27–35. doi: 10.1016/j.maturitas.2006.01.003. [DOI] [PubMed] [Google Scholar]
- 7.Arai H, Miyamoto KI, Yoshida M, Yamamoto H, Taketani Y, Morita K, Kubota M, Yoshida S, Ikeda M, Watabe F, Kanemasa Y, Takeda E. The polymorphism in the caudal-related homeodomain protein Cdx-2 binding element in the human vitamin D receptor gene. J Bone Miner Res. 2001;16:1256–1264. doi: 10.1359/jbmr.2001.16.7.1256. [DOI] [PubMed] [Google Scholar]
- 8.Fang Y, van Meurs JB, d’Alesio A, Jhamai M, Zhao H, Rivadeneira F, Hofman A, van Leeuwen JP, Jehan F, Pols HA, Uitterlinden AG. Promoter and 3’-untranslated-region haplotypes in the Vitamin D receptor gene predispose to osteoporotic fracture: the Rotterdam study. Am J Hum Genet. 2005;77:807–23. doi: 10.1086/497438. [DOI] [PMC free article] [PubMed] [Google Scholar]
- 9.Macdonald HM, McGuigan FE, Stewart A, Black AJ, Fraser WD, Ralston S, Reid DM. Large-scale population-based study shows no evidence of association between common polymorphism of the VDR gene and BMD in British women. J Bone Miner Res. 2006;21:151–162. doi: 10.1359/JBMR.050906. [DOI] [PubMed] [Google Scholar]
- 10.Garnero P, Munoz F, Borel O, Sornay-Rendu E, Delmas PD. Vitamin D receptor gene polymorphisms are associated with the risk of fractures in postmenopausal women, independently of bone mineral density. J Clin Endocrinol Metab. 2005;90:4829–4835. doi: 10.1210/jc.2005-0364. [DOI] [PubMed] [Google Scholar]
- 11.Chakraborty A, Mishra AK, Soni A, Regina T, Mohil R, Bhatnagar D, Bhatnagar A, Chintamani C, Sharma PC, Saxena S. Vitamin D receptor gene polymorphism(s) and breast cancer risk in north Indians. Cancer Detect Prev. 2009;32:386–94. doi: 10.1016/j.canep.2009.04.012. [DOI] [PubMed] [Google Scholar]
- 12.Bailer U, Leisch F, Meszaros K, Lenzinger E, Willinger U, Strobl R, Heiden A, Gebhardt C, Döge E, Fuchs K, Sieghart W, Kasper S, Hornik K, Aschauer HN. Genome scan for susceptibility loci for schizophrenia and bipolar disorder. Biol Psychiatry. 2002;52:40–52. doi: 10.1016/s0006-3223(02)01320-3. [DOI] [PubMed] [Google Scholar]
- 13.Gaikwad S, Ashma R, Kumar N, Trivedi R, Kashyap VK. Host microsatellite alleles in malaria predisposition? Malar J. 2005;4:50–52. doi: 10.1186/1475-2875-4-50. [DOI] [PMC free article] [PubMed] [Google Scholar]
- 14.World Health Organization. Assessment of fracture risk and its application to screening for postmenopausal osteoporosis. 1994. pp. 843–845. [PubMed] [Google Scholar]
- 15.Sambrook JF, Fritsch E, Maniatis T. Molecular cloning: A laboratory manual. 2nd edition. Cold Spring Harbor: Cold Spring Harbor Laboratory Press; 1989. p. 1210. [Google Scholar]
- 16.Weber JL, Wong C. Mutation of human short tandem repeats. Hum Mol Genet. 1993;2:1123–1128. doi: 10.1093/hmg/2.8.1123. [DOI] [PubMed] [Google Scholar]
- 17.Steve R, Helen JS. Primer3 on the WWW for general users and for biologist programmers in Bioinformatics. Methods Mol Biol. 2000;132:365–386. doi: 10.1385/1-59259-192-2:365. [DOI] [PubMed] [Google Scholar]
- 18.Edwards A, Hammond H, Jin L, Caskey CT, Chakraborty R. Genetic variation at five trimeric and tetrameric repeat loci in four human population groups. Genomics. 1992;12:241–253. doi: 10.1016/0888-7543(92)90371-x. [DOI] [PubMed] [Google Scholar]
- 19.Minch E, Ruiz-Linares A, Goldstein DB, Feldman M, Cavalli-Sforza LL. Microsat (version 1.5d): a program for calculating various statistics on microsatellite allele data. Stanford, CA: Stanford University; [Google Scholar]
- 20.Excoffier L, Laval G, Schneider S. Arlequin ver. 3.0: An integrated software package for population genetics data analysis. Evol Bioinform Online. 2005;1:47–50. [PMC free article] [PubMed] [Google Scholar]
- 21.Hubisz MJ, Falush D, Stephens M, Pritchard JK. Inferring weak population structure with the assistance of sample group information. Mol Ecol Resour. 2009;9:1322–32. doi: 10.1111/j.1755-0998.2009.02591.x. [DOI] [PMC free article] [PubMed] [Google Scholar]
- 22.Payseur BA, Nachman MW. Microsatellite variation and recombination rate in the human genome. Genetics. 2000;156:1285–1298. doi: 10.1093/genetics/156.3.1285. [DOI] [PMC free article] [PubMed] [Google Scholar]
- 23.Zapata C, Rodriguez S, Visedo G, Sacristan F. Spectrum of non random association between microstellite loci on human chromosome 11p15. Genetics. 2001;158:1235–1251. doi: 10.1093/genetics/158.3.1235. [DOI] [PMC free article] [PubMed] [Google Scholar]
- 24.State College, PA: Minitab, I; 2010. Minitab 16 Statistical Software. Retrieved from www.minitab.com. [Google Scholar]
- 25.Terwilliger JD. A Powerful Likelihood Method for the Analysis of Linkage Disequilibrium between Trait Loci and One or More Polymorphic Marker Loci. Am J Hum Genet. 1995;56:777–787. [PMC free article] [PubMed] [Google Scholar]
- 26.Kimmel M, Chakraborty R, Stivers DN, Deka R. Dynamics of repeat polymorphisms under a forward-backward mutation model: Within-and between population variability at microsatellite loci. Genetics. 1996;143:549–555. doi: 10.1093/genetics/143.1.549. [DOI] [PMC free article] [PubMed] [Google Scholar]
- 27.Pritchard JK, Stephens M, Donnelly P. Inference of population structure using multilocus genotype data. Genetics. 2000;155:945–959. doi: 10.1093/genetics/155.2.945. [DOI] [PMC free article] [PubMed] [Google Scholar]
- 28.Haldane JB. The combination of linkage values and the calculation of distance between the loci of linked factors. J Genet. 1919;8:299–309. [Google Scholar]
- 29.Phillips MS, Lawrence R, Sachidanandam R, Morris AP, Balding DJ, Donaldson MA, Studebaker JF, Ankener WM, Alfisi SV, Kuo FS, Camisa AL, Pazorov V, Scott KE, Carey BJ, Faith J, Katari G, Bhatti HA, Cyr JM, Derohannessian V, Elosua C, Forman AM, Grecco NM, Hock CR, Kuebler JM, Lathrop JA, Mockler MA, Nachtman EP, Restine SL, Varde SA, Hozza MJ, Gelfand CA, Broxholme J, Abecasis GR, Boyce-Jacino MT, Cardon LR. Chromosome-wide distribution of haplotype blocks and the role of recombination hot spots. Nat Genet. 2003;33:382–7. doi: 10.1038/ng1100. [DOI] [PubMed] [Google Scholar]
- 30.Dawson-Hughes B, Harris SS, Finneran S. Calcium absorption on high and low calcium intakes in relation to vitamin D receptor genotype. J Clin Endocrinol Metab. 1995;80:3657–3661. doi: 10.1210/jcem.80.12.8530616. [DOI] [PubMed] [Google Scholar]