Abstract
Purpose
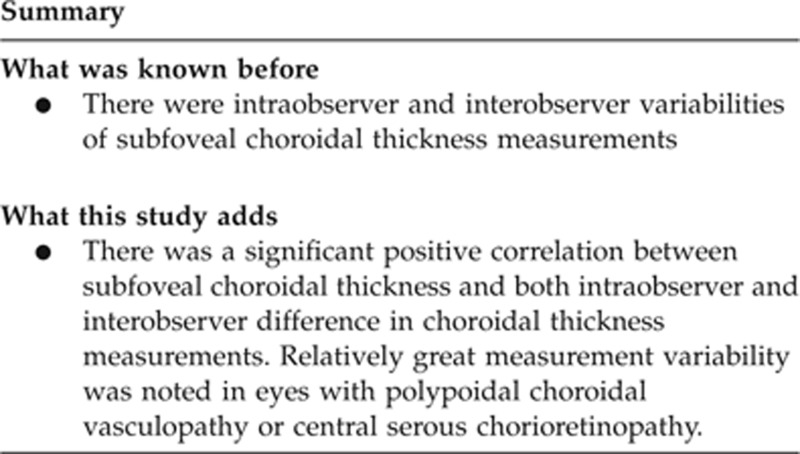
To evaluate the variability in subfoveal choroidal thickness measurements in patients with age-related macular degeneration (AMD) and central serous chorioretinopathy using enhanced depth imaging optical coherence tomography (EDI-OCT).
Methods
One hundred and sixty eyes of 160 patients who were diagnosed with early AMD (N=40), exudative AMD (N=40), polypoidal choroidal vasculopathy (PCV, N=40), or central serous chorioretinopathy (CSC, N=40) were included in this retrospective observational study. In addition, we included 40 normal eyes of 40 subjects. Subfoveal choroidal thickness was measured manually by two masked observers based on EDI-OCT images. The correlation of choroidal thickness with the absolute value of the difference in the choroidal thickness measurement was estimated for all 200 eyes. Intraobserver and interobserver coefficients of repeatability (CRs) were calculated.
Results
There was a significant positive correlation between subfoveal choroidal thickness and both intraobserver (P<0.001) and interobserver (P<0.001) difference in choroidal thickness measurements. The mean intraobserver CRs in nonexudative AMD, exudative AMD, PCV, CSC, and normal eyes were ∼15–21, 23–29, 24–35, 32–38, and 19–25 μm, respectively. The mean interobserver CRs were ∼24–28, 30–36, 39–45, 46–57, and 26–35 μm, respectively.
Conclusions
Relatively great measurement variability should be considered when investigating eyes with pathologic conditions related to a thick choroid, including PCV or CSC.
Keywords: intraobserver variability, interobserver variability, choroid, age-related macular degeneration, central serous chorioretinopathy
Introduction
With the advent of enhanced depth imaging (EDI) technique,1 manual measurement of subfoveal choroidal thickness based on EDI optical coherence tomography (OCT) images has become a widely used method to investigate choroidal thickness in various macular disorders. In particular, a thin choroid in eyes with exudative and nonexudative age-related macular degeneration (AMD)2, 3 and a thick choroid in eyes with polypoidal choroidal vasculopathy (PCV)2, 3, 4 and central serous chorioretinopathy (CSC)5, 6 were notable findings that broadened the understanding of the role of the choroid in the development of these disorders.
One important concern regarding the manual measurement of subfoveal choroidal thickness is intraobserver and interobserver variability. Although there was a highly significant correlation between the measurements performed by independent observers,1 a previous study demonstrated that a difference >32 μm was likely to represent the real difference in subfoveal choroidal thickness in healthy eyes.7
Usually, it is easy to determine the Bruch's membrane–choroid interface in OCT images using EDI technique. However, insufficient quality of image is often experienced in deeper tissues in eyes with a thick choroid. As determining the accurate location of the choroid–sclera interface is essential for accurate choroidal thickness measurements, decreased image quality in deeper tissues may increase the variability of choroidal thickness measurements. In addition, the presence of pathologic lesions, such as subretinal hemorrhage or retinal pigment epithelial detachment (RPED), may also impede the acquisition of a clear image of the underlying tissue. Thus, different degrees of variability might be considered when investigating diseases with different retinal and choroidal pathologies.
The purpose of the present study was to determine the variability of manual measurements of subfoveal choroidal thickness in disorders with a characteristic choroidal thickness profile: nonexudative AMD, exudative AMD, PCV, and CSC. The values of healthy eyes of aged subjects were additionally evaluated. The coefficient of repeatability (CR) and confidence interval were used to estimate the variability of the measurements.
Materials and methods
This study was performed at a single center according to the tenets of the Declaration of Helsinki. The study was approved by the institutional review board (IRB No. 2011-12-072).
We conducted a review of medical records of patients who were diagnosed with nonexudative AMD, exudative AMD, PCV, or idiopathic CSC between 1 September 2009 and 30 August 2011. Forty eyes were enrolled in each group. Patients who were already included in our previous studies2, 6 were not excluded from the current observational study. However, we did not duplicate the data of our previous studies, and all the measurements were newly performed by independent examiners. Data of normal eyes were obtained from the normal fellow eyes of patients with epiretinal membrane or macular hole, who underwent vitreoretinal surgery between 30 August 2010 and 30 August 2011. Within this patient subset, only the normal eyes of subjects ≥50 years of age were utilized.
Diagnosis of each disorder was made based on the results of 90 diopter lens slit-lamp biomicroscopy, fluorescein angiography, and indocyanine green angiography according to the methods described previously.2 PCV was diagnosed when a branching vascular network and terminating polypoidal lesions were identified. Exudative AMD was diagnosed when there was evidence of hyperfluorescence with late leakage associated with pigment epithelial detachment in the macular region, serous retinal detachment, subretinal exudation, and/or hemorrhage. Early AMD was diagnosed if the patient had one or more soft drusen >125 μm or more than five drusen ≥63 μm but <125 μm and any focal hyperpigmentation, but did not show evidence of exudative AMD. Idiopathic CSC was diagnosed when both submacular fluid and idiopathic leaks in fluorescein angiography were noted. Only treatment-naive cases were included in the study. Additional exclusion criteria included the presence of refractive errors >±6.0 diopters (D), amblyopia, significant media opacity or thick subfoveal hemorrhage, central geographic atrophy, history of ocular inflammation, history of retinal detachment, previous vitrectomy, intraocular surgery (including cataract surgery) in the study eye within 1 year, history of ocular trauma, and glaucoma in the study eye.
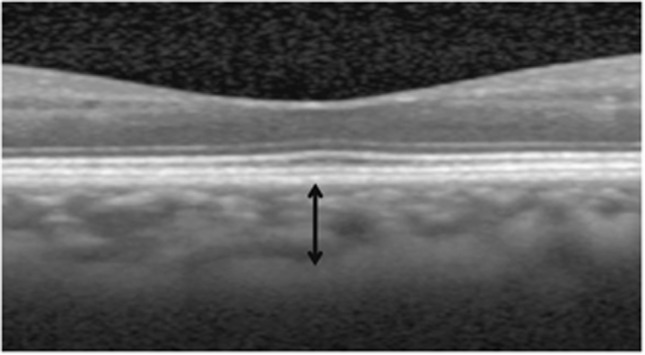
The horizontal and vertical EDI-OCT crosshair scans centered at the center of the fovea were conducted using a spectral domain OCT (Spectralis, Heidelberg Engineering GmbH, Heidelberg, Germany). To perform EDI, either the conservative method for EDI by pushing the instrument closer to the eye,1 or the Spectralis EDI mode by pressing the conversion button provided by the Spectralis software were used. To improve visualization, 50–100 automatic real-time (ART) frames were used to obtain a single image. The choroidal thickness was measured manually using the Heidelberg Eye Explorer software (version 1.7.0.0, Heidelberg Engineering GmbH) according to the previously described method.2 Subfoveal choroidal thickness was defined as the distance from the hyperreflective line of subfoveal Bruch's membrane to the innermost hyperreflective line of the subfoveal choroid–scleral interface. The measurement line was drawn as a perpendicular line between the Bruch's membrane and the choriod–sclera interface (Figure 1). When the subfoveal choroid–sclera interface was difficult to determine due to a very thick choroid or pathologic subfoveal lesion that impeded acquisition of a clear image, an alternative method was used. In such cases, the choroidal thickness was defined as the vertical distance from the hyperreflective line of Bruch's membrane to the imaginary line where the outermost choroidal vascular reflection was visible, even though that line was not the choroid–sclera interface.
Figure 1.
Optical coherence tomography image (1 : 1 micron setting) from a normal fellow eye of a patient with epiretinal membrane. Choroidal thickness (black arrow) is defined as the vertical distance from the hyperreflective line of Bruch's membrane to the outermost hyperreflective line.
Two masked examiners (JHK and JRK) performed two measurements of subfoveal choroidal thickness based on 400 (horizontal and vertical images of 200 eyes) EDI-OCT images. A total of 800 measurements per observer were conducted in a random order with no consecutive measurements for the same image. All the measurements were performed under 300–400% of magnification. As we experienced disagreement in choroidal thickness measurements between measurements based on a 1 : 1 pixel image and measurements based on a 1 : 1 micron image in some cases, all the measurements were performed based on 1 : 1 micron images. The following definitions were used: H=horizontal scan, V=vertical scan, E1=first examiner, E2=second examiner, M1=first measurement, and M2=second measurement. Intraobserver and interobserver variability in the subfoveal choroidal thickness was estimated between the following measurements: intraobserver variability: HE1M1−HE1M2, VE1M1−VE1M2, HE2M1−HE2M2 and VE2M1−VE2M2; interobserver variability: HE1M1−HE2M1, VE1M1−VE2M1, HE1M2−HE2M2 and VE1M2−VE2M2.
The correlation of choroidal thickness with the absolute value of intraobserver and interobserver difference in the choroidal thickness measurements was estimated for all 200 eyes. In addition, we performed partial correlation analysis to exclude the possible influence of the mean number of ART frames. For this supplemental analysis, the number of ART frames was regarded as an adjusted variable. Intraobserver and interobserver coefficients of repeatability (CR) were calculated for each disease group.
Statistical analysis was performed by independent statisticians using R (R Foundation for Statistical Computing, Vienna, Austria; version 2.15.0). The CR and confidence interval were calculated according to the method of Bland and Altman.8, 9, 10 Correlation analyses were performed using Pearson's correlation analysis.
Results
The mean (±SD) age of patients with nonexudative AMD, exudative AMD, PCV, and CSC were 70.8±7.9, 73.6±7.8, 70.3±6.9, and 46.1±5.7 years, respectively. The spherical equivalents were −0.29±1.55 , 0.57±1.37, 0.54±1.26, −0.49±1.57, and 0.13±1.78 D, respectively. The mean horizontal and vertical subfoveal choroidal thicknesses of the first measurement of the first examiner were 206.1±68.8, 185.6±89.8, 345.9±113.0, and 436.8±92.8 μm, respectively. In the normal eye group, the mean age was 65.5±7.5 years and the mean subfoveal choroidal thickness was 256.9±68.1 μm. The alternative method for determining choroidal thickness was used in four eyes with PCV and three eyes with CSC.
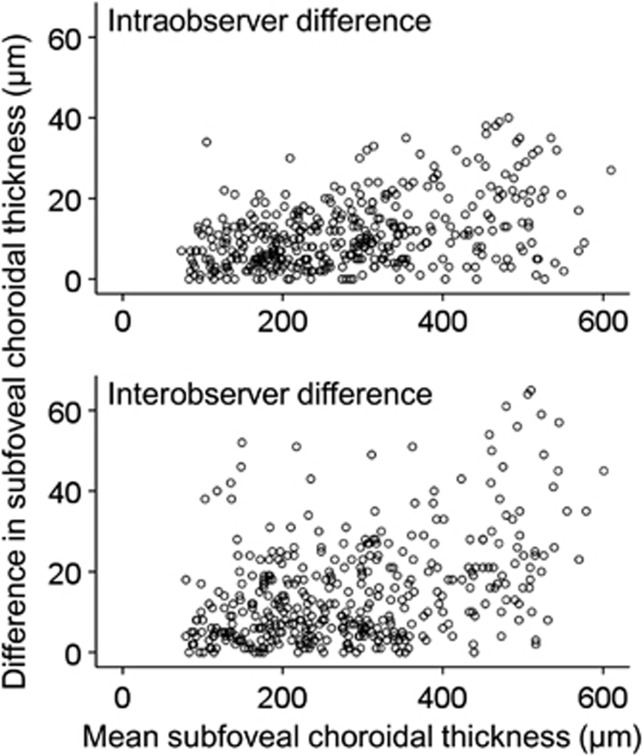
There was a significant positive correlation between the subfoveal choroidal thickness and both intraobserver (HE1M1−HE1M2 (P<0.001, r=0.357), VE1M1−VE1M2 (P<0.001, r=0.398), HE2M1−HE2M2 (P<0.001, r=0.467), and VE2M1−VE2M2 (P<0.001, r=0.447)) and interobserver (HE1M1−HE2M1 (P<0.001, r=0.439), VE1M1−VE2M1 (P<0.001, r=0.375), HE1M2−HE2M2 (P<0.001, r=0.393), and VE1M2−VE2M2 (P<0.001, r=0.356)) differences in the choroidal thickness measurements (Figure 2). The mean numbers of ART frames from the horizontal and vertical images were 80.7±14.9 and 80.4±15.4, respectively. After performing partial correlation analysis, we also identified a significant positive correlation between the subfoveal choroidal thickness and both intraobserver (HE1M1−HE1M2 (P<0.001, r=0.363), VE1M1−VE1M2 (P<0.001, r=0.400), HE2M1−HE2M2 (P<0.001, r=0.464), and VE2M1−VE2M2 (P<0.001, r=0.443)) and interobserver (HE1M1−HE2M1 (P<0.001, r=0.436), VE1M1−VE2M1 (P<0.001, r=0.380), HE1M2−HE2M2 (P<0.001, r=0.395), and VE1M2−VE2M2 (P<0.001, r=0.355)) differences in the choroidal thickness measurements.
Figure 2.
Scatter plots showing the correlation between subfoveal choroidal thickness and the absolute value of the difference in subfoveal choroidal thickness that was measured based on horizontal optical coherence tomography images in all 200 eyes. Intraobserver difference represents the combined results of HE1M1−HE1M2 and HE2M1−HE2M2. Interobserver difference represents the combined results of HE1M1−HE2M1 and HE1M2−HE2M2. Mean subfoveal choroidal thickness represents the mean value of all four measurements (HE1M1, HE1M2, HE2M1, and HE2M2). H: horizontal, E1: first examiner, E2: second examiner, M1: first measurement, M2: second measurement.
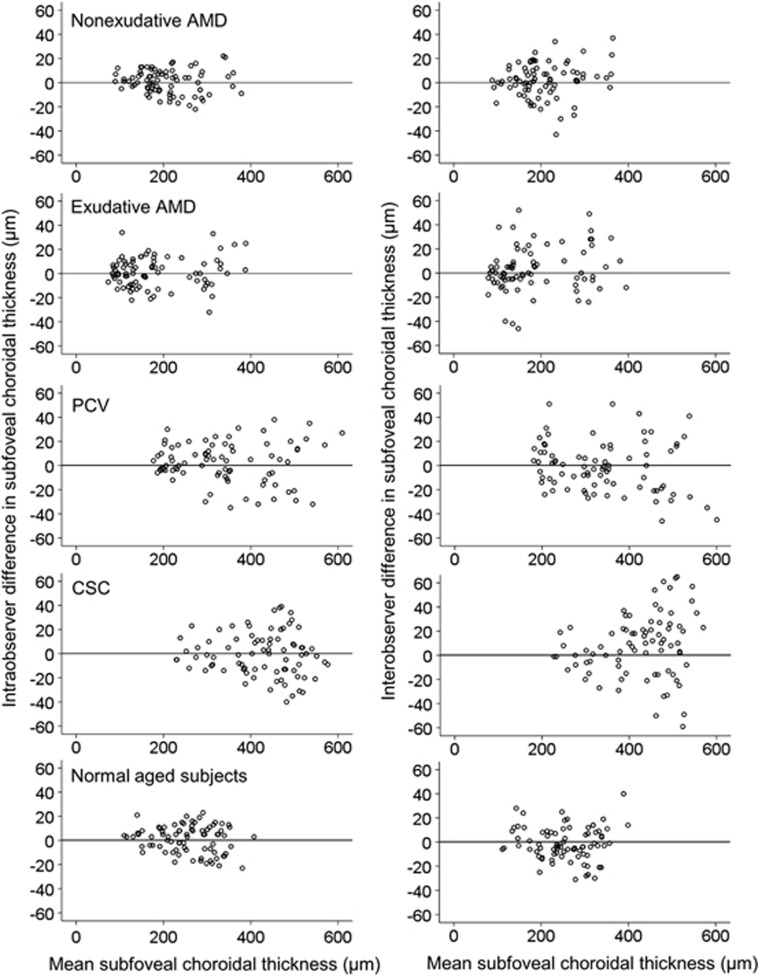
Figure 3 shows the intraobserver and interobserver differences in the subfoveal choroidal thickness measurement in the five groups. Table 1 shows the intraobserver and interobserver CRs derived from both the horizontal and vertical scans from both examiners. The mean intraobserver CRs in nonexudative AMD, exudative AMD, PCV, CSC, and eyes with healthy aged subjects were ∼15–21, 23–29 , 24–35, 32–38, and 19–25 μm, respectively. The mean interobserver CRs were ∼24–28, 30–36, 39–45, 46–57, and 26–35 μm, respectively.
Figure 3.
Scatter plots showing the difference in subfoveal choroidal thickness measured based on horizontal optical coherence tomography images in nonexudative AMD, exudative AMD, PCV, CSC, and normal aged subjects. Intraobserver difference represents the combined results of HE1M1−HE1M2 and HE2M1−HE2M2. Interobserver difference represents the combined results of HE1M1−HE2M1 and HE1M2−HE2M2. Mean subfoveal choroidal thickness represents the mean value of all four measurements (HE1M1, HE1M2, HE2M1, and HE2M2). H: horizontal, E1: first examiner, E2: second examiner, M1: first measurement, M2: second measurement.
Table 1. Intraobserver and interobserver coefficients of repeatability (CRs) of eyes with nonexudative age-related macular degeneration (AMD), exudative AMD, polypoidal choroidal vasculopathy, central serous chorioretinopathy, and eyes of healthy aged subjects.
| Nonexudative AMD | Exudative AMD | PCV | CSC | Healthy subjects | |
|---|---|---|---|---|---|
| Intraobserver CR, mean (95% CI), μm | |||||
| HE1M1−HE1M2 | 20.7 (16.2–25.2) | 24.3 (18.9–29.6) | 31.9 (24.9–38.9) | 37.1 (29.0–45.3) | 20.4 (15.9–24.9) |
| VE1M1−VE1M2 | 15.8 (12.4–19.3) | 29.1 (22.7–35.5) | 35.0 (27.3–42.7) | 37.7 (29.5–46.0) | 24.9 (19.4–30.3) |
| HE2M1−HE2M2 | 17.6 (13.7–21.4) | 24.6 (19.2–29.9) | 34.2 (26.7–41.7) | 32.3 (25.2–39.4) | 23.2 (18.1–28.3) |
| VE2M1−VE2M2 | 14.9 (11.6–18.1) | 23.3 (18.2–28.4) | 23.8 (28.6–29.0) | 35.9 (28.1–43.9) | 18.8 (14.7–22.9) |
| Interobserver CR, mean (95% CI), μm | |||||
| HE1M1−HE2M1 | 26.6 (20.8–32.5) | 31.1 (22.1–40.1) | 41.6 (32.5–50.7) | 56.5 (44.1–68.4) | 26.3 (20.5–32.0) |
| VE1M1−VE2M1 | 24.6 (19.2–29.9) | 35.5 (25.6–45.5) | 38.9 (30.4–48.4) | 45.5 (35.6–55.5) | 27.7 (21.6–33.7) |
| HE1M2−HE2M2 | 28.4 (22.2–34.6) | 30.0 (23.5–36.6) | 39.3 (30.7–47.9) | 49.5 (38.6–60.3) | 27.7 (21.6–33.7) |
| VE1M2−VE2M2 | 24.0 (18.8–29.3) | 35.4 (27.6–43.1) | 44.9 (35.1–54.8) | 45.9 (35.8–55.9) | 34.5 (26.9–42.1) |
Abbreviations: CI, confidence interval; H, horizontal scan; V, vertical scan; E1, first examiner; E2, second examiner; M1, first measurement; M2, second measurement.
Discussion
In this study, we evaluated the intraobserver and interobserver variability in manual subfoveal choroidal thickness measurements in nonexudative AMD, exudative AMD, PCV, CSC, and healthy aged subjects. Measurement variability was positively correlated with subfoveal choroidal thickness. The CRs were relatively small in eyes with nonexudative and exudative AMD that exhibited a thin choroid, whereas relatively larger CRs were noted in eyes with PCV and CSC that exhibited a thick choroid. In addition, as demonstrated in a previous study,7 the intraobserver CRs were generally smaller than the interobserver CRs. We additionally estimated the CRs of healthy eyes of aged subjects that are usually selected as a control group when investigating the choroidal thickness of eyes with AMD. The intraobserver and interobserver CRs of healthy eyes of aged subjects in this study were comparable to the result of a previous study with healthy subjects.7
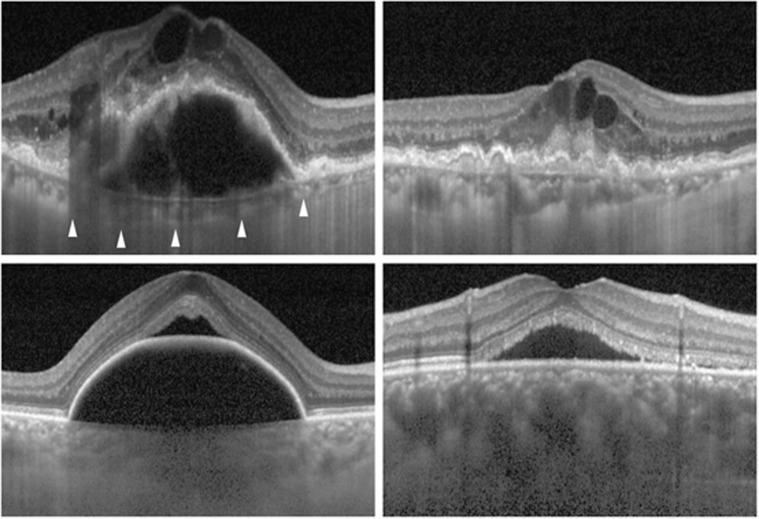
The exudative AMD group showed a slightly thinner subfoveal choroidal thickness than the nonexudative AMD group. However, the intraobserver and interobserver CRs of the exudative AMD group were larger than those of the nonexudative AMD group. In addition, the CRs of the exudative AMD group were even slightly larger than normal eyes despite an ∼71 μm thinner mean subfoveal choroidal thickness. Many eyes in the exudative AMD group exhibited subretinal exudation or retinal pigment epithelial detachment that may have impeded the acquisition of a clear image of the underlying tissue. However, accurate location of the choroid–sclera interface was well determined, because eyes with exudative AMD usually have a thin choroid (Figure 4, top left). Thus, we believe that difficulty in determining the exact location of the measurement point was responsible for the relatively great measurement variability in eyes with exudative AMD. Asymmetric intraretinal edema often induces distortion and tilting of the foveal contour that may decrease the intarobserver and interobserver reproducibility for determining the location of subfoveal Bruch's membrane (Figure 4, top right).
Figure 4.
EDI-OCT images in eyes with exudative AMD (top left, top right), PCV (bottom left), and CSC (bottom right). Choroid–sclera interface (arrowheads) is easily recognizable despite large retinal pigment epithelial detachment combined with severe intraretinal edema due to a thin choroid (top left). The exact “subfoveal” location is difficult to determine due to the severe asymmetric intraretinal edema (top right). Poorly recognizable subfoveal choroid–sclera interface due to a large retinal pigment epithelial detachment and a thick choroid (bottom left). A poorly recognizable subfoveal choroid–sclera interface due to a very thick choroid (bottom right).
Both PCV and CSC groups exhibited relatively larger intraobserver and interobserver CRs than the other groups. One of the important factors for the greater CRs in these disease groups is thought to be relatively greater choroidal thickness. Scatter plots show a larger measurement variability in eyes with a thick choroid in CSC (Figure 3). This suggests that a thick choroid is the primary cause for the large CRs in CSC. It is likely that the decreased image quality of deeper tissues induced by the subretinal fluid was almost negligible. One notable finding is that there is greater measurement variability when the choroidal thickness exceeds ∼400 μm. In our experience, the choroid–sclera interface was usually well recognized in EDI-OCT images in eyes that had <400 μm of choroidal thickness, unless a large RPED or thick subretinal hemorrhage was present. An unclear, blurred choroid–sclera interface is often encountered in eyes with a thicker choroid (Figure 4, bottom right). It is likely that a poor quality of image may have a significant influence on the individual discretion to determine the choroid–sclera interface when the choroidal thickness exceeds 400 μm. In the PCV group, the scatter plots show that increased measurement variability is encountered regardless of choroidal thickness (Figure 3). We postulate the reason as the presence of retinal pigment epithelial detachments, which is a commonly observed finding of PCV,11, 12 or a subretinal hemorrhage that may worsen image quality of the underlying tissue (Figure 4, bottom left). In addition, eyes with PCV usually exhibit a thick choroid.2, 3 Both a thick choroid and subretinal pathology may be primary reasons of the large CRs in PCV.
Although measurement variability is an inevitably encountered problem in manual measurements of subfoveal choroidal thickness, it may affect a significant influence on the primary result of the study when a relatively large variability is expected in many of the studied eyes. Based on the results of the present study, we suggest the following recommendations to handle the problems related to measurement variability. First, considering the relatively large interobserver CRs compared with the intraobserver CRs, a single examiner should perform all the measurements to minimize measurement variability. Second, intraobserver and/or interobserver measurement variability should be presented in the manuscript as additional information when investigating eyes with a relatively thick choroid. This may help determine the validity of the study. Lastly, to minimize the possible influence of exceptionally large measurement variability, eyes in which very large measurement variability is expected, such as eyes with both a very thick choroid and a large hemorrhagic RPED, should be analyzed separately.
Recently, methods of volumetric choroidal thickness measurement have been reported.13, 14 However, the validity of these methods has not yet been verified in eyes with retinal or choroidal pathology. It is likely that manual segmentation will be necessary in eyes with a very thick choroid or retinal/subretinal pathology, because the accuracy of software-driven auto-segmentation may be limited in these conditions. Given this, we believe that measurement variability found in the present study will provide useful information in the era of volumetric choroidal thickness measurement.
In addition to its retrospective design, there were several limitations of the present study. First, two different boundaries were used for choroidal thickness evaluation. Although the alternative method was used only in seven eyes for which the subfoveal choroid–sclera interface was difficult to determine, this approach may nevertheless have influenced the results of the present study. Second, the number of ART frames was not controlled in this retrospective study. Although the correlations of the number of ART frames with intraobserver difference and interobserver difference were not significant, the influence of differences in image quality should not be completely ignored.
In summary, we revealed the variability of measurements in choroidal thickness in various ocular conditions. There was a significant positive correlation between subfoveal choroidal thickness and measurement variability. Variability was relatively small among nonexudative AMD, exudative AMD, and normal eyes; however, a relatively large variability was noted in PCV and CSC. Further efforts to establish a strategy to reduce the influence of measurement variability are needed.
Acknowledgments
We thank Sun Woo Kim and Jung Hyun Ahn for their invaluable assistance with statistical analysis.
The authors declare no conflict of interest.
References
- Spaide RF, Koizumi H, Pozzoni MC. Enhanced depth imaging spectral-domain optical coherence tomography. Am J Ophthalmol. 2008;146 (4:496–500. doi: 10.1016/j.ajo.2008.05.032. [DOI] [PubMed] [Google Scholar]
- Chung SE, Kang SW, Lee JH, Kim YT. Choroidal thickness in polypoidal choroidal vasculopathy and exudative age-related macular degeneration. Ophthalmology. 2011;118 (5:840–845. doi: 10.1016/j.ophtha.2010.09.012. [DOI] [PubMed] [Google Scholar]
- Koizumi H, Yamagishi T, Yamazaki T, Kawasaki R, Kinoshita S. Subfoveal choroidal thickness in typical age-related macular degeneration and polypoidal choroidal vasculopathy. Graefes Arch Clin Exp Ophthalmol. 2011;249 (8:1123–1128. doi: 10.1007/s00417-011-1620-1. [DOI] [PubMed] [Google Scholar]
- Maruko I, Iida T, Sugano Y, Saito M, Sekiryu T. Subfoveal retinal and choroidal thickness after verteporfin photodynamic therapy for polypoidal choroidal vasculopathy. Am J Ophthalmol. 2011;151 (4:594–603 e591. doi: 10.1016/j.ajo.2010.10.030. [DOI] [PubMed] [Google Scholar]
- Imamura Y, Fujiwara T, Margolis R, Spaide RF. Enhanced depth imaging optical coherence tomography of the choroid in central serous chorioretinopathy. Retina. 2009;29 (10:1469–1473. doi: 10.1097/IAE.0b013e3181be0a83. [DOI] [PubMed] [Google Scholar]
- Kim YT, Kang SW, Bai KH. Choroidal thickness in both eyes of patients with unilaterally active central serous chorioretinopathy. Eye (Lond) 2011;25 (12:1635–1640. doi: 10.1038/eye.2011.258. [DOI] [PMC free article] [PubMed] [Google Scholar]
- Rahman W, Chen FK, Yeoh J, Patel P, Tufail A, Da Cruz L. Repeatability of manual subfoveal choroidal thickness measurements in healthy subjects using the technique of enhanced depth imaging optical coherence tomography. Invest Ophthalmol Vis Sci. 2011;52 (5:2267–2271. doi: 10.1167/iovs.10-6024. [DOI] [PubMed] [Google Scholar]
- Bland JM, Altman DG. Measurement error. BMJ. 1996;313 (7059:744. doi: 10.1136/bmj.313.7059.744. [DOI] [PMC free article] [PubMed] [Google Scholar]
- Bland JM.What is the standard error of the within-subject standard deciation, sw? http://www-users.york.ac.uk/~mb55/meas/seofsw.htm 2004. Accessed January 3, 2011.
- Bland JM, Altman DG. Statistical methods for assessing agreement between two methods of clinical measurement. Lancet. 1986;1 (8476:307–310. [PubMed] [Google Scholar]
- Tsujikawa A, Sasahara M, Otani A, Gotoh N, Kameda T, Iwama D, et al. Pigment epithelial detachment in polypoidal choroidal vasculopathy. Am J Ophthalmol. 2007;143 (1:102–111. doi: 10.1016/j.ajo.2006.08.025. [DOI] [PubMed] [Google Scholar]
- Yannuzzi LA, Sorenson J, Spaide RF, Lipson B. Idiopathic polypoidal choroidal vasculopathy (IPCV) Retina. 1990;10 (1:1–8. [PubMed] [Google Scholar]
- Esmaeelpour M, Povazay B, Hermann B, Hofer B, Kajic V, Hale SL, et al. Mapping choroidal and retinal thickness variation in type 2 diabetes using three-dimensional 1060-nm optical coherence tomography. Invest Ophthalmol Vis Sci. 2011;52 (8:5311–5316. doi: 10.1167/iovs.10-6875. [DOI] [PubMed] [Google Scholar]
- Hirata M, Tsujikawa A, Matsumoto A, Hangai M, Ooto S, Yamashiro K, et al. Macular choroidal thickness and volume in normal subjects measured by swept-source optical coherence tomography. Invest Ophthalmol Vis Sci. 2011;52 (8:4971–4978. doi: 10.1167/iovs.11-7729. [DOI] [PubMed] [Google Scholar]


