Abstract
Color markings among felid species display both a remarkable diversity and a common underlying periodicity. A similar range of patterns in domestic cats suggests a conserved mechanism whose appearance can be altered by selection. We identified the gene responsible for tabby pattern variation in domestic cats as Transmembrane aminopeptidase Q (Taqpep), which encodes a membrane-bound metalloprotease. Analyzing 31 other felid species, we identified Taqpep as the cause of the rare king cheetah phenotype, in which spots coalesce into blotches and stripes. Histologic, genomic expression, and transgenic mouse studies indicate that paracrine expression of Endothelin3 (Edn3) coordinates localized color differences. We propose a two-stage model in which Taqpep helps to establish a periodic pre-pattern during skin development that is later implemented by differential expression of Edn3.
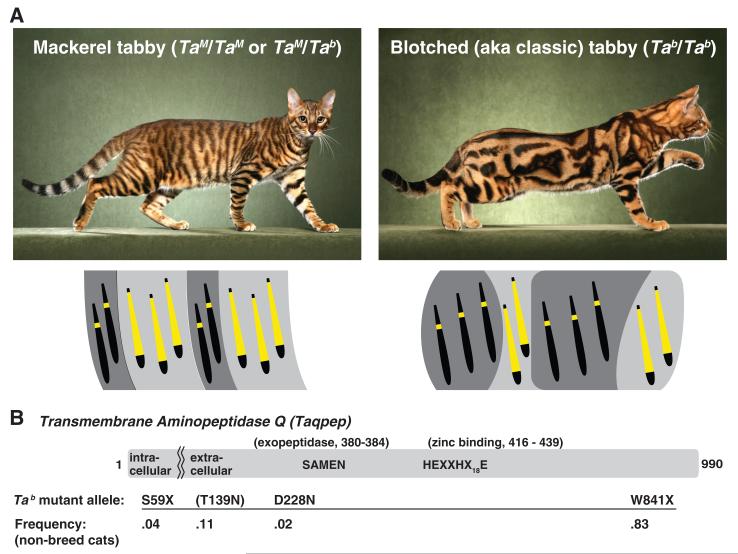
The molecular basis and evolutionary variation of periodic mammalian color patterns have been difficult to investigate from genetic crosses of model organisms. Domestic cats (Felis catus) exhibit heritable variation of tabby markings—mackerel versus blotched—that provide an opportunity for such genetic analysis (1). Tabby markings are a composite of two features: (i) a light background component in which individual hairs have extensive light bands, and (ii) a superimposed darker component in which hairs have little or no banding. In mackerel cats, the dark component is organized into narrow vertical stripes with a constant and regular spacing, whereas in blotched cats, the dark component is expanded into a less organized structure with wide whorls (Fig. 1A). Periodic color patterns in other felids may represent the same process; for example, dark tabby markings in domestic cats may be homologous to black stripes or spots in tigers or cheetahs, respectively (2).
Fig. 1.
(A) Allelic variation at Tabby [mackerel (TaM) is dominant to blotched (Tab)] controls the arrangement of dark- and light-colored areas. Diagrams indicate how the distribution of black or brown eumelanin versus yellow or pale pheomelanin within individual hairs underlies the macroscopic color patterns, although in reality cat hairs frequently exhibit multiple pheomelanic bands. (B) Taqpep encodes a type II membrane protein with aminopeptidase activity encoded by the ectodomain. Mutant allele frequencies are from a survey of 119 feral and outbred cats (table S1). The T139N allele is associated (P = 0.0017, Fisher’s exact test) with an atypical swirled pattern but is incompletely penetrant (table S1 and fig. S2).
A logical explanation for tabby patterning involves the Agouti-melanocortin receptor system, in which Agouti protein, a paracrine signaling molecule released from dermal papillae, acts on overlying hair follicle melanocytes to inhibit the melanocortin 1 receptor (Mc1r), causing a switch from the production of black/brown eumelanin to red/yellow pheomelanin (3, 4). According to this hypothesis, dark tabby stripes are areas in which Agouti signaling is suppressed or surmounted during hair growth and regeneration. However, known components of the Agouti-melanocortin pathway do not affect the shape of tabby patterns (1, 2, 5, 6). Instead, the difference between mackerel and blotched is controlled by a single locus, Tabby (Ta), whose genetic position does not suggest an obvious candidate gene (7) but whose effects could be manifested via differential control of melanocortin signaling.
The 3X cat genome assembly is not contiguous across the Tabby linkage interval (7), but comparison to homologous regions in the dog and human genomes suggests a candidate interval of ~5 Mb in length (fig. S1A). Old World wild cats, from which domestic cats arose ~10,000 years ago (8), exhibit a mackerel-like pattern. However, the blotched pattern is common in many modern breeds, suggesting that one or a few Tab causal variants would lie in a region of reduced allelic variation due to recent selection. We used comparative genomic information to identify single-nucleotide polymorphisms (SNPs) in the candidate interval, then genotyped and analyzed 16 blotched (Tab/Tab) and 33 mackerel (TaM/TaM or TaM/Tab) animals from a feral population in northern California. Five SNPs from a 180-kb interval on chrA1 showed significant association (P range = 9 × 10⁻⁴ to 3.2 × 10⁻⁹) (fig. S1B).
Twenty-four markers genotyped in and around the associated region in 58 blotched and 19 mackerel cats indicated that all blotched animals shared a common haplotype extending for 244 kb, whereas mackerel samples exhibited several haplotypes within the same interval (figs. S1C and S2). Coding sequences from three genes are located within the 244-kb interval: Commd10, LOC644100, and a third gene whose human ortholog has been referred to as both Aminopeptidase Q and Laeverin (9). No sequence alterations were observed in LOC644100 or Commd10, but most blotched cats carried a nonsense mutation, W841X (Fig. 1B, fig. S2, and table S1), in exon 17 of the third gene. We subsequently identified two additional variants in the same gene, S59X and D228N (Fig. 1B, fig. S2, and table S1). This gene is expressed in developing felid skin, and its loss of function causes a loss of color pattern periodicity without obvious effects on other organ systems. We refer to this gene as Transmembrane Aminopeptidase Q (Taqpep) and the protein product as Tabulin to reflect its organismal function.
Taqpep encodes a type II membrane-spanning protein of the M1 aminopeptidase family, whose members are characterized by the presence of GAMEN exopeptidase (SAMEN in Taqpep) and HEXXHX18E zinc-binding motifs in their extracellular domains (Fig. 1B) (9). In feral cats, we observed homozygosity or compound heterozygosity for the Tab S59X or W841X alleles in 58 out of 58 (58/58) blotched animals, with no phenotypic distinction among the different genotypic classes, compared to 51/51 mackerel cats that carried 0 or 1 Tab alleles (table S1). A third Tab allele, D228N, was found to cosegregate with the blotched phenotype in a research colony (fig. S2D). In feral cats, we also observed two variants at codon 139, one of which, T139N, was significantly associated (P = 0.0017, Fisher’s exact test) with an atypical swirled pattern (figs. S2 and S4D and table S1) and therefore may represent hypomorphic or neomorphic activity. Overall, the mutant W841X allele predominates and is responsible for the strong haplotype signature (fig. S1C), although the S59X allele occurs on the same haplotype background, in trans to W841X (fig. S2).
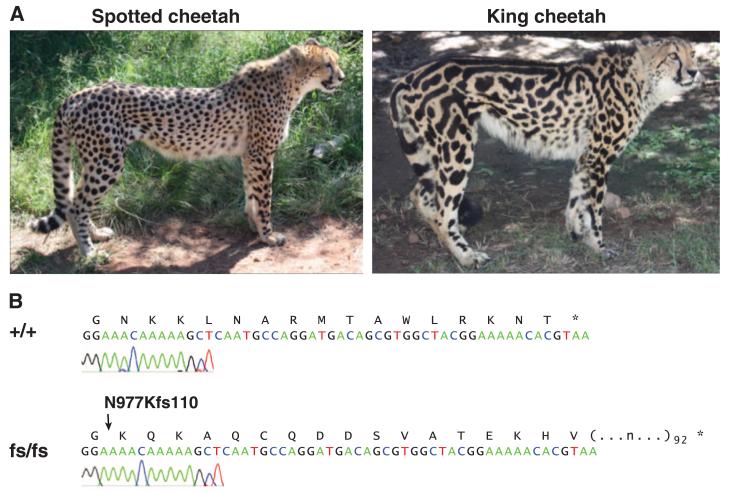
Cheetahs (Acinonyx jubatus) with the rare king pattern were originally described as a distinct felid species (10) but were later recognized as having a monogenic trait with an autosomal recessive mode of inheritance (11). In king cheetahs, the black spots coalesce into larger areas, and multiple longitudinal black stripes appear on the dorsum (Fig. 2A). Wild king cheetahs have been sighted only in a small area of sub-Saharan Africa (fig. S3) (11). Taqpep genomic sequence from a captive king cheetah in North America revealed a base pair insertion in exon 20, predicting a frameshift that replaces what would normally be the carboxy-terminal 16 amino acids with 109 new residues (N977Kfs110, Fig. 2B). Additional DNA samples from captive cheetahs in a large pedigree demonstrated complete cosegregation of the king pattern with the N977Kfs110 mutation [LOD (logarithm of odds) score = 5.7], and further revealed that the mutant allele was introduced into the pedigree by one homozygous and two heterozygous animals (fig. S3). We did not detect the N977Kfs110 mutation in wild cheetahs caught in Namibia (n = 191), Tanzania (n = 23), or Kenya (n = 3).
Fig. 2.
(A) Black-haired areas are larger, more irregular, and associated with dorsal stripes in the king cheetah. (B) Chromatogram of Taqpep cDNA from a spotted (+/+) as compared to a king (fs/fs) cheetah.
Depictions of tabby markings from the Middle Ages are mostly mackerel, but the blotched phenotype increased to a sufficiently high frequency to be described by Linnaeus in 1758 as characteristic for the domestic cat, predating the formation of most modern breeds. We examined the predicted Tabulin sequence in 351 cats from 24 breeds (table S2) and observed that the W841X allele is polymorphic in most breeds of Western origin, but rare or absent in Eastern breeds. The high allele frequency for W841X in Abyssinian (1.0), Birman (0.71), and Himalayan (0.77) cats is especially notable, because tabby markings in these breeds are masked by epistatic interactions. The S59X allele, probably representing a complete ablation of protein function, is most common in Norwegian Forest Cats, and we observed one S59X/S59X homozygote with a blotched phenotype.
We determined Taqpep sequence for 31 wild felid species, identifying 130 synonymous and 64 nonsynonymous predicted substitutions (fig. S4A). We assessed the potential functional impact of the nonsynonymous substitutions with multivariate analysis of protein polymorphism (MAPP) (12), a quantitative approach that takes into account both evolutionary conservation and side-chain physicochemical properties. A MAPP score >10 indicates a likely impact on protein function, and the T139N and D228N substitutions associated with atypical swirled and blotched mutant phenotypes, respectively, in the domestic cat yield MAPP scores of 11 (P = 1.5 × 10⁻³) and 14 (P = 3.9 × 10⁻⁴) (fig. S4B). In contrast, the T139A variant in the domestic cat (which does not affect pattern) yields a MAPP score of 3.8. The black-footed cat (Felis nigripes) is a clear outlier from other Felidae, with five lineage-specific nonsynonymous substitutions and a combined MAPP score of 50 (fig. S4C). F. nigripes exhibits a spotting phenotype that is similar to the atypical swirled pattern associated with the T139N allele in domestic cats (fig. S4D); thus, recent evolution of Taqpep in F. nigripes may contribute to its characteristic pattern.
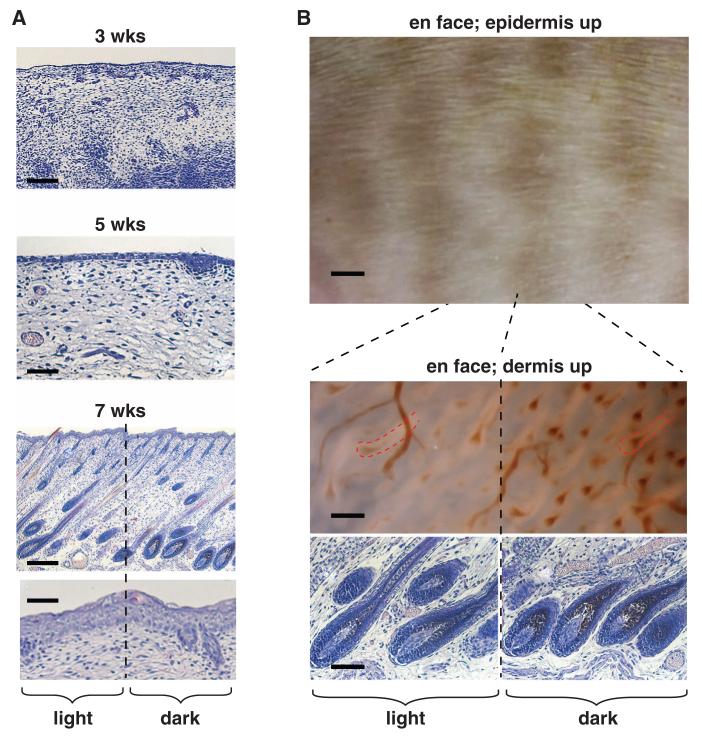
To investigate how color patterns are implemented, we examined fetal cat skin at 3, 5, and 7 weeks of gestation, and observed that the first histologic indication of tabby markings coincides with their external appearance at 7 weeks, when follicle architecture is established and hair shafts begin to protrude through the epidermal surface (Fig. 3). At this stage, the boundary between dark and light tabby components reflects differences in the amount of melanin deposition, with no apparent difference in cell type; melanocytes are present in both dark and light areas but produce more melanin in dark areas. Furthermore, the density and architecture of hair follicles are independent of localization to dark and light areas (Fig. 3B). This suggests that tabby markings arise from spatial variation in transcriptional activity rather than cell type distribution.
Fig. 3.
Skin sections of fetal cats [(A), at 3, 5, and 7 weeks of gestation] stained with hematoxylin and eosin, together with unstained flat-mount (en face) skin preparations of fetal cats [(B), at 7 weeks of gestation]. The 7-week images in (B) are from an orange (O/Y or O/O) individual, which allows the dark component of the tabby pattern (which is orange-colored) to be more easily visualized. In the trans-illuminated “dermis-up” panel, hair follicle outlines (dashed red lines) appear light-colored; melanin incorporation and blood vessels appear dark-colored. Scale bars in (A), 150, 50, and 250 μm in 3-, 5-, and 7-week fetal cat sections, respectively, and 50 μm in the 7-week epidermis close-up. Scale bars in (B), 2 mm, 100 μm, and 600 μm in epidermis-up, follicle histology, and dermis-up panels, respectively.
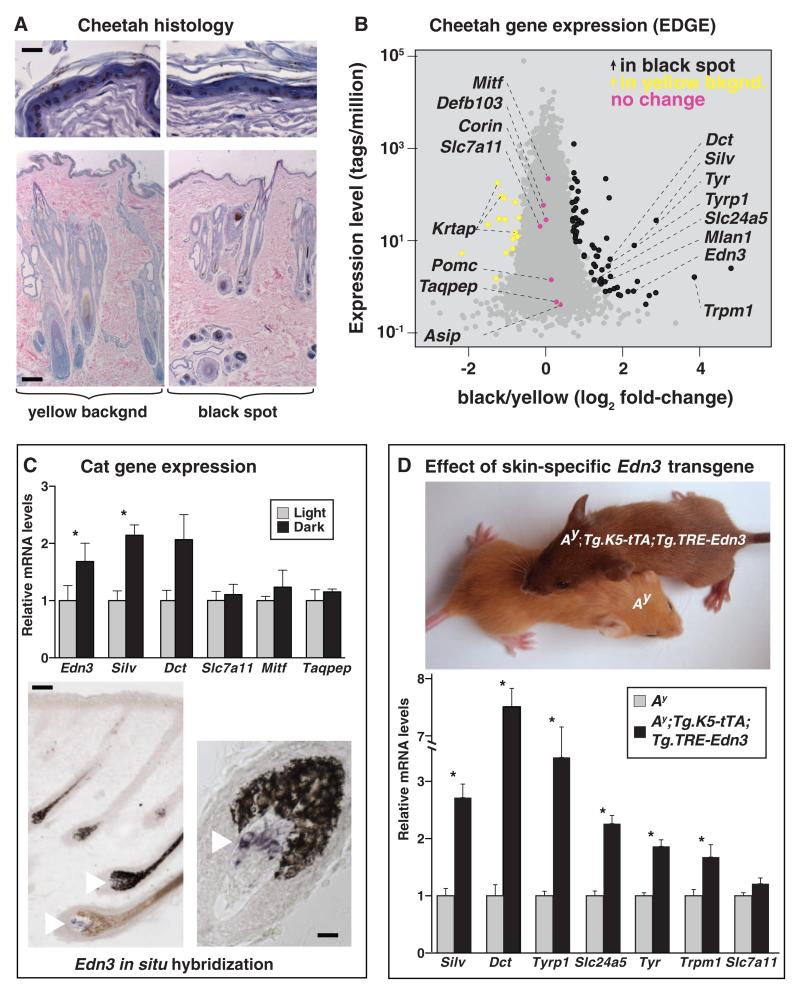
We used the EDGE (EcoP15I-tagged Digital Gene Expression) (13) method for gene expression profiling to examine the transcriptome of cheetah skin, in which there are sharp boundaries between black spots and the yellow interspot areas and for which multiple skin biopsies were available for study. Cheetah skin exhibits an unusual histologic architecture; the epidermis is heavily pigmented, and hair follicles are organized in clusters with extensive accessory structures (Fig. 4A and fig. S5A). However, the number and size of follicle clusters, as well as the number of epidermal pigment cells, do not vary between black-haired and yellow-haired areas (fig. S5B). Based on a previous analysis of EDGE results from a single cheetah, we hypothesized that black coloration involves localized alterations of genes downstream of Mc1r signaling (13). Biopsies of yellow- and black-colored areas from five different animals enabled a genome-wide approach, in which the expression of 14,014 genes could be measured across a 106-fold dynamic range (Fig. 4B). At a false discovery rate (q) < 0.05, we identified 74 differentially expressed genes (tables S7 and S8).
Fig. 4.
(A) A cheetah skin biopsy that includes a black-yellow boundary (also see fig. S6). (B) EDGE (13) determination of differential gene expression in black- as compared to yellow-colored areas of cheetah skin. Transcript frequency (observations per million sequence reads, mean of five samples) is plotted as a function of differential expression. The 74 genes with significant differential expression are shown in black or yellow (FDR < 0.05, see methods and tables S8 and S9); 7 additional pigmentation genes that are not differentially expressed are shown in pink. (C) Relative mRNA levels (mean ± SE) for the indicated genes as assessed by qRT-PCR from paired samples (n = 4) of dark and light neonatal tabby skin; *P < 0.05 (dark versus light, two-tailed t test). Dermal papilla expression of Edn3 mRNA (purple stain, white arrows) as detected by in situ hybridization, from a brown tabby individual. The left panel illustrates the expression of Edn3 mRNA in both pheomelanin- and eumelanin-containing follicles. (D) Phenotypes of 2-week-old mice of the indicated genotypes. Relative mRNA levels (mean ± SE) for the indicated genes from qRT-PCR of cDNA from control (n = 4) and transgenic (n = 4) mice are shown; *P < 0.05 (Ay versus Ay;Tg.K5-tTA;Tg.TRE-Edn3, two-tailed t test). Scale bars in (A), 40 and 200 μmin epidermis and whole-skin sections, respectively. In (C), 60 and 20 μmin left and right panels, respectively.
Among 60 genes up-regulated in black as compared to yellow cheetah skin, 7 are melanocyte-specific, of which 4 [Tyr (4.9-fold, q = 3.8 × 10⁻¹⁹), Silv (7.3-fold, q = 1 × 10−36), Dct (3.2-fold, q = 5.3 × 10⁻⁸), and Tyrp1 (3.1-fold, q = 1.7 × 10⁻⁵)] encode pigment type-switching components (14, 15). Genes that encode ligands or regulators of Mc1r signaling are not differentially expressed between yellow and black cheetah skin (Fig. 4B and table S7). However, one of the nonmelanocytic genes up-regulated in black as compared to yellow cheetah skin (4.9-fold, q = 2.1 × 10⁻⁴), Edn3, a paracrine hormone expressed mostly by mesenchymal cells that promotes differentiation and proliferation of melanocytes and other neural crest derivatives, is a candidate for the coordination of spatial variation in hair color. A hypermorphic mutation of Gnaq, the second messenger through which Edn3 acts, causes the accumulation of dermal melanocytes during embryogenesis and converts yellow hair to black in postnatal mice (16, 17).
Quantitative reverse transcription polymerase chain reaction (qRT-PCR) confirmed that the expression of Edn3 and Silv was increased in black-colored as compared to yellow-colored areas of cheetah skin; we also observed similar increases in a single leopard skin sample (fig. S5C). In neonatal skin from domestic cats (in which there is a high proportion of anagen follicles), Edn3 mRNA expression was also ~twofold higher in dark as compared to light areas (Fig. 4C), and in situ hybridization revealed that expression was restricted to the dermal papilla, a permanent portion of the hair follicle.
In Ay mutant mice, which express high levels of Agouti protein and produce pheomelanin instead of eumelanin, we confirmed that an Edn3 transgene (18) converts yellow hair to dark brown-colored hair (Fig. 4D). Using qRT-PCR, we observed that the Edn3 transgene in mice also caused increased expression of the same melanocyte-specific genes that are overexpressed in black-colored areas of cheetah skin (Fig. 4B). Thus, increased expression of Edn3 in transgenic mice probably recapitulates both the coat color and melanocytic gene expression phenotypes observed in cheetah skin, which suggests that localized expression of Edn3 during felid hair follicle growth serves as a master regulator of spatial hair color differences associated with tabby markings.
In the skin of neonatal domestic cats and adult cheetahs, Taqpep mRNA is expressed at low levels that do not differ between dark and light areas (Fig. 4, B and C). In mice, levels of wholeembryo Taqpep mRNA as measured by qRT-PCR increased progressively during gestation and were highest in postnatal skin (fig. S6). In situ hybridization to mouse embryos (at embryonic days 10.5 to 17.5) and to fetal cat skin at 3, 5, 6, and 7 weeks of gestation did not reveal localization of Taqpep mRNA to any specific cell type or region.
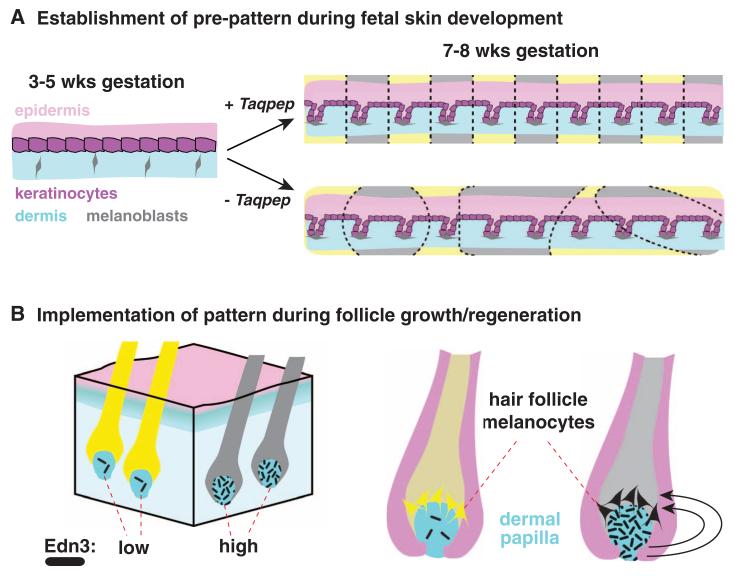
Because tabby markings are apparent soon after the time when melanocytes enter hair follicles (Fig. 3A), the effects of Taqpep on pattern morphology must occur at or before follicle development and are therefore likely to be mediated by epithelial or mesenchymal cells. Our results suggest that Taqpep is required to establish the periodicity of tabby markings during skin development (Fig. 5A), and that the “tabby marking” identity of a particular region is implemented and maintained by the ability of dermal papilla cells to sustain high versus low levels of Edn3 production throughout subsequent hair cycles (Fig. 5B). This model also helps to explain why, in contrast to many periodic color patterns in fish, which are mediated by and depend on direct contact between pigment cells (19-21), tabby markings change in size but not number during organismal growth.
Fig. 5.
A tabby pre-pattern is established at or before hair follicle development (A), specifying regions as dark (gray-colored) or light (yellow-colored). In the absence of Taqpep, dark regions are expanded, and there is less periodicity. Regional identity is manifested and implemented (B) by differential expression of Edn3 in the dermal papilla, a permanent part of the hair follicle that releases paracrine factors to act on overlying melanocytes. Yellow and black pigment are synthesized by melanocytes in hair follicles that produce low and high levels of Edn3, respectively.
Our findings also provide a mechanistic explanation for epistasis relationships between Agouti, Mc1r, and Tabby. Homozygosity for a loss-of-function Agouti allele is associated with a “ghost pattern” in which Tabby stripes are difficult or impossible to visualize, because eumelanogenic genes such as Tyr, Tyrp1, Dct, and Pmel are already up-regulated. The ghost pattern becomes apparent, however, in animals that are doubly mutant for Agouti and Mc1r (5), because endothelin and melanocortin signaling act in parallel (fig. S7). A system in which distinct paracrine signaling pathways—endothelins via a Gαq-coupled receptor and melanocortins via a Gαs-coupled receptor— converge on overlapping cellular machinery could explain more complicated phenotypes, in which pheomelanin-rich yellow versus eumelanin-rich black areas exhibit both periodic and regional fluctuation, such as spots or stripes of alternative pigment types overlaid on a background of dorsoventral differences, as is apparent in leopards, jaguars, and tigers. Further studies of color pattern in domestic-wild cat hybrids offer the opportunity to study these complex color markings and add to our knowledge of how felids acquire their color patterns.
Supplementary Material
Acknowledgments
We thank San Jose Animal Care and Services, Fix Our Ferals, the Berkeley East-Bay Humane Society, Pets In Need, the Monterey Animal Hospital, and the City of Huntsville Animal Shelter for assistance with sample collection; the Wild Cat Education and Conservation Fund for contributing king cheetah samples; R. Finn for assistance with Norwegian Forest Cat samples and phenotypes; H. Flick for domestic cat photographs; and J. C. Kaelin for help with feral cat sample collection. We thank the Production Sequencing Group of the Washington University School of Medicine Genome Center for cDNA sequencing. Namibian samples were collected with the approval of the Ministry of Environment and Tourism (permit 1532). Supported in part by the HudsonAlpha Institute for Biotechnology and by the Intramural Research Program of the NIH, National Cancer Institute, Center for Cancer Research, using federal funds under contract N01-CO-12400. L.Z.H. and J.P. were supported by fellowships from Genentech and the National Institutes of Health, respectively. A.vD. is the founder and director of the Ann van Dyk Cheetah Centre, a nonprofit conservation organization. DNA sequence data for this study are available at http://genome.wustl.edu/genomes/view/felis_catus/ and the NIH Short Read Archive (SRA056885).
Footnotes
www.sciencemag.org/cgi/content/full/337/6101/1536/DC1
Materials and Methods
References and Notes
- 1.Lomax TD, Robinson R. J. Hered. 1988;79:21. doi: 10.1093/oxfordjournals.jhered.a110438. [DOI] [PubMed] [Google Scholar]
- 2.Searle AG. Comparative Genetics of Coat Color in Mammals. Academic Press; New York: 1968. [Google Scholar]
- 3.Millar SE, Miller MW, Stevens ME, Barsh GS. Development. 1995;121:3223. doi: 10.1242/dev.121.10.3223. [DOI] [PubMed] [Google Scholar]
- 4.Jackson IJ. Annu. Rev. Genet. 1994;28:189. doi: 10.1146/annurev.ge.28.120194.001201. [DOI] [PubMed] [Google Scholar]
- 5.Peterschmitt M, Grain F, Arnaud B, Deléage G, Lambert V. Anim. Genet. 2009;40:547. doi: 10.1111/j.1365-2052.2009.01864.x. [DOI] [PubMed] [Google Scholar]
- 6.Eizirik E, et al. Curr. Biol. 2003;13:448. doi: 10.1016/s0960-9822(03)00128-3. [DOI] [PubMed] [Google Scholar]
- 7.Eizirik E, et al. Genetics. 2010;184:267. doi: 10.1534/genetics.109.109629. [DOI] [PMC free article] [PubMed] [Google Scholar]
- 8.Driscoll CA, et al. Science. 2007;317:519. doi: 10.1126/science.1139518. [DOI] [PMC free article] [PubMed] [Google Scholar]
- 9.Maruyama M, et al. J. Biol. Chem. 2007;282:20088. doi: 10.1074/jbc.M702650200. [DOI] [PubMed] [Google Scholar]
- 10.Pocock RI. Proc. Zool. Soc. London. 1927;97:245. [Google Scholar]
- 11.van Aarde RJ, van Dyk A. J. Zool. 1986;209:573. [Google Scholar]
- 12.Stone EA, Sidow A. Genome Res. 2005;15:978. doi: 10.1101/gr.3804205. [DOI] [PMC free article] [PubMed] [Google Scholar]
- 13.Hong LZ, Li J, Schmidt-Küntzel A, Warren WC, Barsh GS. Genome Res. 2011;21:1905. doi: 10.1101/gr.122135.111. [DOI] [PMC free article] [PubMed] [Google Scholar]
- 14.April CS, Barsh GS. Pigment Cell Res. 2006;19:194. doi: 10.1111/j.1600-0749.2006.00305.x. [DOI] [PubMed] [Google Scholar]
- 15.Kobayashi T, et al. J. Cell Sci. 1995;108:2301. doi: 10.1242/jcs.108.6.2301. [DOI] [PubMed] [Google Scholar]
- 16.Van Raamsdonk CD, Fitch KR, Fuchs H, de Angelis MH, Barsh GS. Nat. Genet. 2004;36:961. doi: 10.1038/ng1412. [DOI] [PMC free article] [PubMed] [Google Scholar]
- 17.Van Raamsdonk CD, Barsh GS, Wakamatsu K, Ito S. Pigment Cell Melanoma Res. 2009;22:819. doi: 10.1111/j.1755-148X.2009.00609.x. [DOI] [PubMed] [Google Scholar]
- 18.Garcia RJ, et al. J. Invest. Dermatol. 2008;128:131. doi: 10.1038/sj.jid.5700948. [DOI] [PubMed] [Google Scholar]
- 19.Nakamasu A, Takahashi G, Kanbe A, Kondo S. Proc. Natl. Acad. Sci. U.S.A. 2009;106:8429. doi: 10.1073/pnas.0808622106. [DOI] [PMC free article] [PubMed] [Google Scholar]
- 20.Iwashita M, et al. PLoS Genet. 2006;2:e197. doi: 10.1371/journal.pgen.0020197. [DOI] [PMC free article] [PubMed] [Google Scholar]
- 21.Watanabe M, et al. EMBO Rep. 2006;7:893. doi: 10.1038/sj.embor.7400757. [DOI] [PMC free article] [PubMed] [Google Scholar]
Associated Data
This section collects any data citations, data availability statements, or supplementary materials included in this article.


