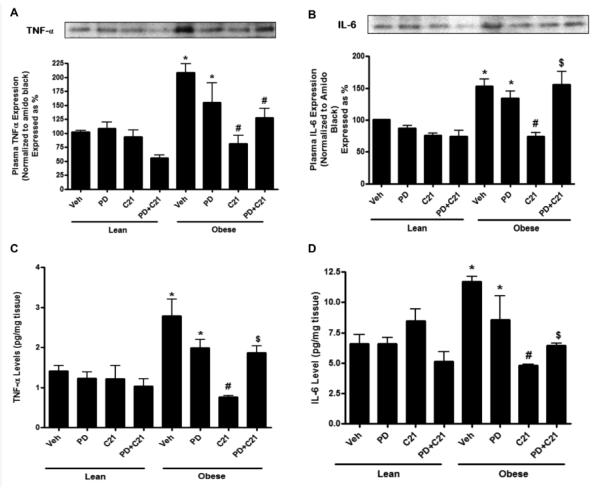
Fig. 5.
Pro-inflammatory cytokine expression in the plasma (A,B) and concentration in the kidney cortex (C,D) of lean and pre-hypertensive obese Zucker rats after 2 weeks treatment with vehicle (Veh), AT2R antagonist PD123319 (PD), AT2R agonist (C21) and both PD123319+C21 (PD+C21). (A) Tumor necrosis factor- α (TNF- α) and (B) Interleukin-6 (IL-6) expression in the plasma normalized with total plasma protein stained with amido black. Top panels show representative western blots for TNF- α and IL-6 (C) TNF-α and (D) IL-6 levels in the kidney normalized to total protein. Data are mean ± SEM. * indicates p<0.05 vs lean vehicle treated, # indicates p<0.05 vs obese vehicle treated and $ indicates p<0.05 vs obese C21 treated rats (n=6).

