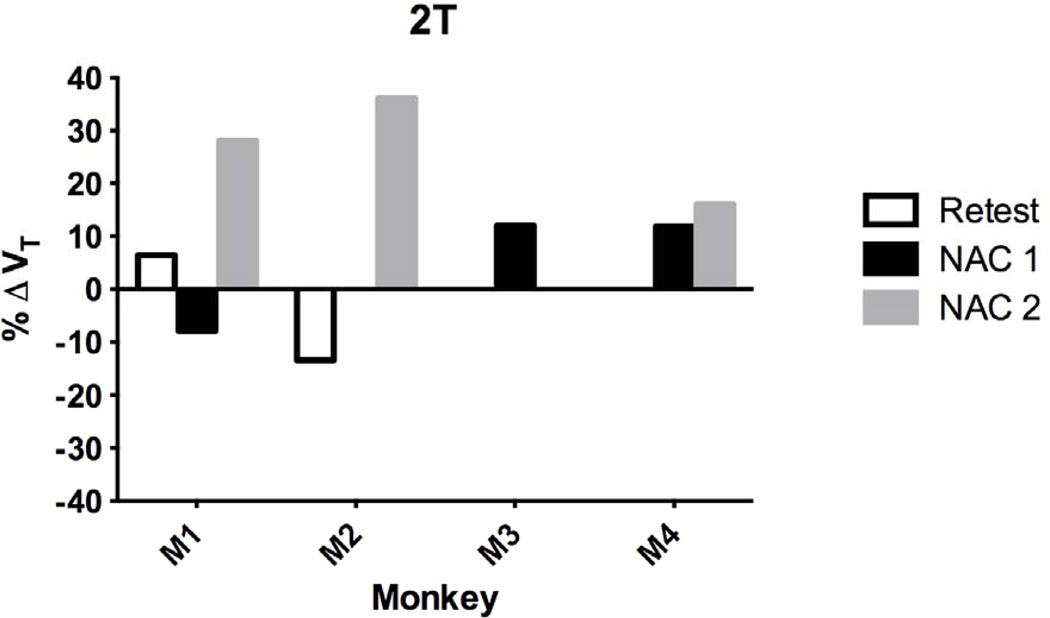
Fig. 5.
Percent change in VT (%ΔVT) with 2T analysis of the cerebellum gray matter (CGM) from test/baseline to Retest (n=2), NAC 1 (50 mg/kg, n=3), and NAC 2 (100 mg/kg, n=3) for each monkey. Monkey 1 (M1) was scanned in all three groups. Monkey 2 (M2) was in the Retest and the NAC 2 group, and Monkey 3 (M3) was in the NAC 1 group. Monkey 4 (M4) was in both NAC 1 and NAC 2 groups. Mean % ΔVT with NAC 2 increased significantly ( p <0.05).

