

Abstract
Objectives. We sought to examine the association between policies governing access to tobacco during adolescence and subsequent adult smoking.
Methods. We analyzed adult smoking data from the 1998 through 2006–2007 administrations of the US Current Population Survey Tobacco Use Supplement by employing a quasi experimental approach. Participants (n = 105 519) were adults, aged 18 to 34 years at the time of the survey. Smoking outcomes included having ever smoked 100 cigarettes, smoking at the time of the survey, and having smoked 10 or more cigarettes a day conditioned on being an ever smoker. These were predicted from exposure to state youth access policies at age 17 years.
Results. Four of the 9 policies exhibited significant associations with reduced prevalence of 1 or more smoking outcomes, primarily among women. Lesser effects for other policies could not be ruled out.
Conclusions. Restrictions on youth access to tobacco might lead to reduction in smoking prevalence later in adulthood. The effect might be limited to women; we estimate that having all policies in place could be associated with a 14% reduction in lifetime smoking prevalence for women, and an additional 29% reduction in heavy smoking among ever smokers.
Both opponents of smoking and purveyors of cigarettes have recognized the significance of adolescence as the period during which smoking behaviors are typically developed.1,2 Accordingly, initiatives to curb youth smoking were among the first federal policy restrictions placed on cigarette sales in the United States.3,4 Adoption of these initiatives was accelerated by passage of the 1992 Synar Amendment to the Federal Alcohol, Drug Abuse, and Mental Health Administration Reorganization Act, which mandated withholding federal block-grant money from states that failed to prohibit distribution of tobacco products to persons younger than 18 years, or failed to enforce such prohibitions. Various measures were implemented by individual states to increase retailer compliance with de jure purchase ages, such as restricting physical access to cigarette vending machines and banning the sale of single cigarettes.5,6
Adaptation of these policies was partly motivated by community intervention studies suggesting that more uniform compliance with legal purchase age policies would reduce smoking rates among youths.7–11 Some postimplementation studies have suggested that youth access restrictions are effective at reducing smoking among adolescents,12–14 whereas other studies have cast doubt on their effectiveness.6,15–17 Furthermore, opponents argue that youth access policies could inadvertently glamorize smoking as a sophisticated adult behavior, thus reinforcing messages historically associated with tobacco advertising.18 Hence, some argue that youth access restrictions divert resources away from well-established and universally targeted tobacco control policies, such as clean indoor air policies, price increases, and media campaigns.16,19
Youth access measures were not designed to merely delay smoking, but presumably to deter progression by delaying onset or reducing the intensity of smoking during adolescence. As such, reductions in smoking that persist into adulthood are the proper benchmarks by which these policies should be assessed. In the current study, we examined whether youths who face a restrictive policy environment are less likely to smoke as adults. We analyzed long-term associations between state youth access policies and subsequent adult smoking by taking advantage of state-by-state and year-by-year policy differences as states adopted various measures in response to the Synar Amendment. We expect that policies effective in mitigating youth smoking also influence subsequent adult smoking. It has been shown, for example, that exposure to stricter drinking age laws are associated with lower prevalence of alcohol problems in adulthood, but to our knowledge, parallel studies have not been conducted for tobacco policy.20–22 Hence, we examined whether policy encountered during adolescence is associated with smoking behaviors during adulthood. This hypothesis is consistent with contemporary neurobiological views of adolescence as a critical period for the development of addiction.23–25
METHODS
Data from the Tobacco Use Supplement (TUS) of the Current Population Survey (CPS) were merged with data on the policy environment that adult participants would have encountered prior to age 18 years. Past policy exposures were used to predict smoking outcomes at time of survey. State of residence at age 17 years and younger would be required to precisely assess exposure; however, the TUS-CPS does not collect historical state of residence data, so we used state of residence at the time of the survey as a proxy. We describe the reliability of this approximation in detail in an appendix (available as a supplement to the online version of this article at http://www.ajph.org), wherein we estimate that policy exposure is correctly classified in 92% to 96% of cases. We estimate that 86% of the population lived in the same state at the time of observation as they lived during adolescence; an additional 6% to 10% lived in states that are concordant with state of emigration with respect to policy.
Participants
Smoking data from the 1998 to 1999, 2001 to 2002, 2003, and 2006 to 2007 releases of the TUS-CPS were analyzed. The CPS is a continuing monthly survey—cosponsored by the US Census Bureau and the US Bureau of Labor Statistics—that collects data on topics related to employment, economic, and demographic characteristics of the US civilian, noninstitutionalized population aged 15 years and older. The TUS is sponsored by National Cancer Institute (NCI) and the Centers for Disease Control and Prevention (CDC), and is administered along with the CPS during selected months. The TUS-CPS uses a nationally representative sample to provide national- and state-level data on smoking and other tobacco use. The survey content, stratified sampling strategy, and detailed methods of the TUS-CPS are described elsewhere.26
Because our interest is in adult smoking, analyses were focused on participants aged 18 years and older at the time of the survey. Because our analytical approach relied on differences across time and state to estimate policy effects, we restricted the analyses to those born during 1973 through 1986 (n = 110 069); these were the individuals who reached legal purchase age during the period in which youth access policies were changing rapidly (1990 through 2003; Figure 1). We further restricted the sample to individuals who were living in states where the minimum purchase age for tobacco was 18 years or older. By 2003 all states had purchase ages of 18 years or older, but a few states did not adopt this criterion until the early 1990s. As a result, the analysis sample comprised n = 105 519 individuals, or 95.9% of the sample of participants who met the birth year criteria described previously. This eliminated heterogeneity with respect to the legal purchase age for tobacco, allowing us to focus on policies that further restrict access to tobacco by youths younger than 18 years.
FIGURE 1—
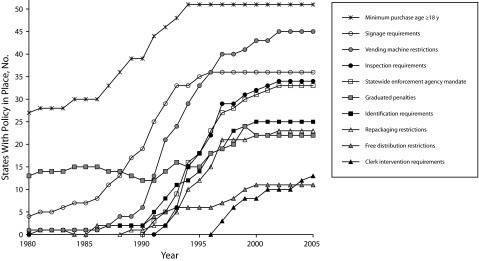
Analysis of the number of states adopting each of the 9 target policies and a minimum purchase age of 18 years or older for tobacco: ImpacTeen Tobacco Control Policy and Prevalence Data and National Cancer Institute State Cancer Legislative Database, 1991–2008.
Smoking Outcomes
Our first outcome of interest was whether participants had smoked 100 or more cigarettes in their lifetime (“ever smoking”), versus those who never smoked, or had smoked fewer than 100 cigarettes. Our second outcome was whether participants smoked any cigarettes at the time of the survey. Specifically, participants were asked whether they “now smoke cigarettes every day, some days, or not at all.” Those participants who reported smoking some days or every day were counted as current smokers, contrasted with those who did not smoke at the time of the survey. This outcome is not independent from the ever smoking outcome because TUS-CPS participants are only asked about current smoking if they reached the 100-cigarette threshold. Nonetheless, it is included because it is the most relevant measure for public health. Finally, among ever smokers only, we analyzed “current heavy smoking,” defined as smoking 11 or more cigarettes per day at the time of the survey. For “every day” smokers, cigarettes per day was queried directly; for “some days” smokers, cigarettes per day was determined by multiplying number of days smoked over the past 30 days by number of cigarettes per smoking days and dividing by 30. Heavy smokers were contrasted with light (≤ 10 cigarettes per calendar day) and former smokers. This threshold was based on the “Heaviness of Smoking Index,” a short test for nicotine dependence that counts smoking more than 10 cigarettes a day as a symptom of dependence.27
Youth Access to Tobacco Policies as Independent Variables
Smoking outcomes were predicted from 9 youth access policy areas that states variously implemented just prior to and after passage of the Synar Amendment. We developed binary scores for each policy that were derived from an ordinal policy coding system proposed by Alciati et al.5 and maintained by the NCI State Cancer Legislative database. Policy data were obtained from the ImpacTeen Web site, which maintains a database of various tobacco control policies.28 The following contrasts were tested:
Signage Requirements: Provision requiring the posting of a warning sign about minimum purchase age and penalizing retailers who fail to post such a sign versus no requirement.
Vending Machine Restrictions: Bans or location restrictions on cigarette vending machines versus no bans or restrictions.
Inspection Requirements: Provisions for random inspections of retailers to ensure compliance with youth access laws versus no requirements.
Graduated Penalties: Provisions that establish a series of increasingly steeper penalties to retailers who violate any youth access laws versus nongraduated penalties for some or all youth access laws, or delays of penalties beyond 3 years.
Identification Requirements: Provisions that require retailers to request identification from individuals appearing to be aged 21 or younger versus no provision.
Repackaging restrictions: Provisions designed to restrict the sale of single cigarettes, or inexpensive small packages, by requiring that cigarettes be sold in a sealed package that meets federal labeling requirements versus no provision.
Statewide Enforcement Authority: Provision establishing a statewide enforcement authority for tobacco sales versus no provision, or provision only for a non-statewide authority.
Free Distribution Restrictions: Bans on free samples of tobacco products with minimal exceptions, versus no provision or location restrictions only.
Clerk Intervention Requirements: Provisions mandating that tobacco purchases take place through store clerks versus no policy.
Analytic Plan
Our analytical approach was an extension of a classical “differences-in-differences” method that compares 2 groups at 2 different time points, and for which one of the groups underwent an environmental and policy change or treatment while the other served as a control.29,30 We used logistic regression to extend the 2-by-2 analysis to multiple groups at multiple time points. In our case, the groups corresponded to states, and time points to birth years, because these variables determined the policy to which a person was exposed. Hence, we included these variables in all models as fixed effect, unordered categorical covariates. State effects account for all time-invariant characteristics of each state, and birth year effects account for all state-invariant characteristics of each birth year, allowing for estimation of the exposure effect.31
In addition to state and birth year fixed effects, we also included observed individual demographic covariates: respondent-reported race/ethnicity was coded as non-Hispanic White, non-Hispanic Black, Hispanic and Other; the latter category was chosen to avoid small cell sizes and excessive degrees of freedom. Age was incorporated as a continuous measure. Survey wave was included as a categorical variable. Gender was included as a covariate in primary analyses; gender-stratified analyses were also conducted. In second-stage models, 3 state policy covariates were included: tobacco excise taxes, an index of clean indoor air laws, and inflation-adjusted state tobacco funding per capita. Excise taxes were obtained from historical data32 and adjusted for inflation based on the annual Consumer Price Index. Clean indoor air laws were coded using a scoring system developed by Chriqui et al.33; both clean indoor air and state tobacco control spending data were obtained from the ImpacTeen Web site.28
Parameter estimates and standard errors were calculated using the “surveylogistic” procedure in SAS version 9.2 (SAS Institute, Cary, NC) using the state as the clustering unit.34,35 This approach accounts for intracorrelation of observations within clusters (states) in estimating standard errors, which is the primary consideration in standard error estimation when applying the differences-in-differences approach.31,35 Sampling error resulting from lower levels of clustering is expected to be small provided that the sample size from within a state is small relative to the full state population.36,37 Unweighted data were used for analyses; this is appropriate providing that policy effects are not substantially heterogeneous with respect to selection probability.38
RESULTS
Table 1 presents the characteristics of the combined TUS-CPS samples, which, after applying exclusion criteria, comprised 105 519 participants with complete data. Altogether 34.4% reported ever having smoked 100 cigaretttes, and 24.4% reported current smoking at the time of the survey. Current heavy smoking, defined as smoking more than 11 cigarettes per day, was endorsed by 44.4% of ever smokers (37 390 participants).
TABLE 1—
Smoking Prevalence Among Individuals Born in the United States Between 1973–1986: US Current Population Survey Tobacco Use Supplement, 1998–2007
| No. (%) | Ever Smoking (≥ 100 Lifetime Cigarettes), % (SE) | Current Smoking, % (SE) | Current Heavy Smoking Among Ever Smokers (n = 35 745), % (SE) | |
| Gender | ||||
| Women | 58 244 (55.2) | 32.2 (1.3) | 22.3 (1.1) | 42.1 (1.4) |
| Men | 47 275 (44.8) | 37.2 (1.0) | 26.9 (0.9) | 46.9 (1.5) |
| Race/ethnicity | ||||
| White | 72 267 (68.5) | 39.9 (0.7) | 28.0 (0.7) | 47.4 (1.1) |
| Black | 15 857 (15.0) | 20.5 (1.0) | 16.7 (0.9) | 40.7 (1.4) |
| Hispanic | 10 445 (9.9) | 20.5 (1.0) | 14.0 (1.3) | 25.1 (2.4) |
| Other | 6950 (6.6) | 30.1 (2.3) | 22.3 (1.8) | 37.1 (2.0) |
| Birth yeara | ||||
| 1973–1979 | 66 781 (63.3) | 36.2 (1.1) | 24.6 (0.9) | 43.7 (1.5) |
| 1980–1986 | 38 738 (36.7) | 31.3 (1.3) | 24.0 (1.1) | 45.8 (1.3) |
| Age,b y | ||||
| 18–24 | 55 218 (52.3) | 31.7 (1.2) | 25.0 (1.1) | 49.0 (1.3) |
| 25–29 | 39 521 (37.5) | 36.4 (1.1) | 25.3 (1.0) | 43.1 (1.5) |
| 30–34 | 10 780 (10.2) | 34.7 (1.3) | 21.6 (1.0) | 40.5 (1.5) |
| Total | 105 519 (100.0) | 34.4 (1.1) | 24.4 (1.0) | 44.4 (1.4) |
Birth year categories are for descriptive purposes only. Birth year was included in regression analyses as an unordered categorical variable.
Age categories are for descriptive purposes only. Age was included in regression analyses as a continuous variable.
Youth Access Policies
Figure 1 plots the number of states that had adopted each of the youth access policies by year, using the coding previously described. The period selected for our analyses, 1990 through 2003, bracket most of the policy change associated with the Synar Amendment (Figure 1). Individual states strengthened some policies during the 1980s, particularly signage requirements and vending machine restrictions, but most major changes took place during the period on which we focus.
Single Policy Analyses
We predicted the 3 smoking outcomes from each of the 9 policies. Each policy variable was analyzed separately while adjusting for demographic covariates, state, and birth year fixed effects, and survey wave as described. Estimates of policy effects were made for the full sample, for men alone, and for women alone. These results are reported in Table 2. In the full sample, only 2 of the 9 policies were associated with statistically significant (P < .05) reductions in any outcome prevalence. Vending machine restrictions appeared to reduce both current smoking (odds ratio [OR] = 0.93; 95% confidence interval [CI] = 0.87, 0.99) and current heavy smoking among ever smokers (OR = 0.91; 95% CI = 0.84, 0.99). Identification requirements were associated with reductions in prevalence of ever smoking (OR = 0.94; 95% CI = 0.88, 0.997) and current smoking (OR = 0.98; 95% CI = 0.87, 0.99).
TABLE 2—
Adjusted Associations Between 9 Youth Access Policies and Smoking Status: US Current Population Survey Tobacco Use Supplement, 1998–2007
| Ever Smoking (≥ 100 Lifetime Cigarettes; n = 105 519), OR (95% CI) | Current Smoking (n = 105 519), OR (95% CI) | Current Heavy Smoking Among Ever Smokers (n = 35 745), OR (95% CI) | |
| Full Sample | |||
| Signage requirements | 1.05 (0.97, 1.15) | 1.01 (0.91, 1.13) | 0.88 (0.76, 1.02) |
| Vending machine restrictions | 0.95 (0.89, 1.01) | 0.93 (0.87, 0.99) | 0.91 (0.84, 0.99) |
| Inspection requirements | 1.01 (0.96, 1.06) | 1.00 (0.94, 1.06) | 0.98 (0.90, 1.08) |
| Graduated penalties | 1.01 (0.95, 1.07) | 0.99 (0.91, 1.07) | 0.99 (0.88, 1.12) |
| Identification requirements | 0.94 (0.88, 0.997) | 0.93 (0.87, 0.99) | 0.97 (0.88, 1.08) |
| Repackaging restrictions | 0.95 (0.89, 1.01) | 0.94 (0.87, 1.01) | 0.94 (0.85, 1.04) |
| Statewide enforcement authority | 0.98 (0.92, 1.03) | 0.97 (0.90, 1.04) | 0.94 (0.86, 1.04) |
| Free distribution restrictions | 0.95 (0.87, 1.03) | 1.02 (0.96, 1.09) | 1.07 (0.95, 1.20) |
| Clerk intervention requirements | 0.99 (0.93, 1.07) | 1.00 (0.86, 1.15) | 1.01 (0.82, 1.24) |
| Women | |||
| Signage requirements | 1.07 (0.95, 1.20) | 1.00 (0.87, 1.15) | 0.92 (0.73, 1.15) |
| Vending machine restrictions | 0.91 (0.84, 0.98) | 0.89 (0.82, 0.96) | 0.86 (0.77, 0.97) |
| Inspection requirements | 0.99 (0.94, 1.05) | 0.98 (0.92, 1.05) | 0.96 (0.85, 1.09) |
| Graduated penalties | 1.01 (0.94, 1.09) | 1.01 (0.94, 1.07) | 0.99 (0.86, 1.13) |
| Identification requirements | 0.91 (0.84, 0.99) | 0.91 (0.84, 0.98) | 0.92 (0.79, 1.06) |
| Repackaging restrictions | 0.93 (0.86, 1.01) | 0.93 (0.87, 0.99) | 0.89 (0.76, 1.05) |
| Statewide enforcement authority | 0.97 (0.91, 1.04) | 0.97 (0.89, 1.05) | 0.87 (0.77, 0.98) |
| Free distribution restrictions | 0.88 (0.77, 0.996) | 0.96 (0.87, 1.06) | 1.09 (0.91, 1.30) |
| Clerk intervention requirements | 0.99 (0.91, 1.09) | 0.99 (0.86, 1.14) | 1.08 (0.86, 1.36) |
| Men | |||
| Signage requirements | 1.04 (0.96, 1.11) | 1.03 (0.91, 1.16) | 0.84 (0.72, 0.98) |
| Vending machine restrictions | 0.99 (0.92, 1.06) | 0.96 (0.88, 1.05) | 0.97 (0.88, 1.07) |
| Inspection requirements | 1.03 (0.97, 1.10) | 1.02 (0.95, 1.10) | 1.01 (0.91, 1.12) |
| Graduated penalties | 1.00 (0.93, 1.08) | 0.97 (0.86, 1.10) | 1.01 (0.87, 1.17) |
| Identification requirements | 0.96 (0.89, 1.03) | 0.95 (0.88, 1.03) | 1.04 (0.93, 1.16) |
| Repackaging restrictions | 0.96 (0.88, 1.05) | 0.95 (0.84, 1.06) | 0.99 (0.89, 1.12) |
| Statewide enforcement authority | 0.98 (0.91, 1.06) | 0.97 (0.89, 1.06) | 1.03 (0.92, 1.16) |
| Free distribution restrictions | 1.03 (0.96, 1.11) | 1.10 (0.997, 1.21) | 1.05 (0.94, 1.17) |
| Clerk intervention requirements | 1.00 (0.91, 1.10) | 1.02 (0.85, 1.22) | 0.94 (0.75, 1.19) |
Note: CI = confidence interval; OR = odds ratio.
Because some studies have suggested that underage women may have less trouble purchasing cigarettes than young men11,32,39–42 we also conducted gender-stratified analyses. Among women, both vending machine restrictions and ID requirements exhibited stronger associations than in the full sample. In addition, for the women-only analyses, repackaging restrictions were associated with statistically significant reduction in prevalence of current smoking (OR = 0.93; 95% CI = 0.87, 0.99); restrictions on free-sample distribution were associated with a significant reduction in ever smoking prevalence (OR = 0.88; 95% CI = 0.77, 0.996), and the presence of a statewide enforcement agency was associated with a reduction in prevalence of current heavy smoking among ever smokers (OR = 0.87; 95% CI = 0.77, 0.98). By contrast, for analyses limited to men, only 1 policy showed significant association with any outcome: sign-posting requirements were associated with a reduction in current heavy smoking prevalence among ever smokers (OR = 0.84; 95% CI = 0.72, 0.98).
Multipolicy Models
Some of the policies analyzed in Table 2 exhibited significant associations with adult smoking, primarily for women. However, interpretation of those results is limited by 2 factors. First, the policies are correlated with each other. Second, it is impossible to rule out small effects for policies that did not attain nominal statistical significance. Prompted by these limitations, 2 sets of analyses were conducted to test aggregate-policy associations. In the first set, we used the results from single-policy analyses to select those with the strongest evidence of effectiveness, and then tabulated a count of these policies in place for each state and birth year combination. Policies were selected if they exhibited a negative coefficient of association for each outcome in the full-sample analysis and were significantly associated with any outcome in either the full sample or gender-stratified analyses. This resulted in 4 policies: vending machine restrictions, identification requirements, repackaging restrictions, and the presence of a statewide enforcement agency. The predictor variable was the count of these 4 policies based on state and birth year. The second approach was to use the count of all 9 policies, regardless of the results of the single policy analysis. By expressing these variables as counts, these models assume independent, homogenous contribution of each policy to smoking behavior.
Table 3 summarizes the results of the multiple policy analyses. The top half of the Table lists results for the models using the same set of covariates described before, and the bottom half includes models that adjust for potential policy confounders including state tobacco excise tax, clean indoor air policies, and state funding for spending on tobacco control at the time of observation. The 4-policy count was associated with significant or near-significant reductions in prevalence of ever smoking, current smoking, and current heavy smoking among ever smokers in the full sample, but stratification by gender indicated that the associations were only significant for women. The 9-policy count exhibited similar results, but associations with current heavy smoking among ever smokers did not meet the statistical significance threshold. After adjustment for additional policy covariates (Table 3), both counts were significantly, or near-significantly associated with reductions in all 3 outcome prevalences for women, but not men. To test whether policy associations diminish with age, interactions between age and policy were incorporated into each model. In no case was the interaction significant (all interaction P > .09; data available as a supplement to the online version of this article at http://www.ajph.org).
TABLE 3—
Adjusted Associations Between Counts of Selected 4 and All 9 Youth Access Policies and Smoking Outcomes: US Current Population Survey Tobacco Use Supplement, 1998–2007
| Ever Smoking (≥ 100 Lifetime Cigarettes; n = 105 519), OR (95% CI) | Current Smoking (n = 105 519), OR (95% CI) | Current Heavy Smoking Among Ever Smokers (n = 35 745), OR (95% CI) | |
| Model 1a | |||
| Full Sample | |||
| Selected 4 policies | 0.974 (0.956, 0.993) | 0.968 (0.950, 0.987) | 0.968 (0.937, 1.000) |
| All 9 policies | 0.990 (0.979, 1.002) | 0.987 (0.975, 1.000) | 0.984 (0.964, 1.005) |
| Women | |||
| Selected 4 policies | 0.964 (0.942, 0.986) | 0.959 (0.937, 0.981) | 0.935 (0.894, 0.978) |
| All 9 policies | 0.984 (0.968, 0.999) | 0.981 (0.967, 0.996) | 0.972 (0.942, 1.002) |
| Men | |||
| Selected 4 policies | 0.986 (0.961, 1.010) | 0.977 (0.949, 1.006) | 1.004 (0.967, 1.043) |
| All 9 policies | 0.998 (0.985, 1.010) | 0.994 (0.978, 1.010) | 0.998 (0.973, 1.022) |
| Model 2b | |||
| Full Sample | |||
| Selected 4 policies | 0.975 (0.957, 0.993) | 0.968 (0.950, 0.987) | 0.967 (0.936, 0.999) |
| All 9 policies | 0.990 (0.979, 1.002) | 0.987 (0.974, 0.999) | 0.983 (0.962, 1.004) |
| Women | |||
| Selected 4 policies | 0.964 (0.942, 0.987) | 0.959 (0.937, 0.981) | 0.935 (0.893, 0.978) |
| All 9 policies | 0.984 (0.968, 0.999) | 0.980 (0.966, 0.995) | 0.970 (0.940, 1.001) |
| Men | |||
| Selected 4 policies | 0.986 (0.962, 1.010) | 0.977 (0.950, 1.006) | 1.004 (0.966, 1.043) |
| All 9 policies | 0.997 (0.985, 1.010) | 0.993 (0.977, 1.010) | 0.997 (0.973, 1.021) |
Note. CI = confidence interval; OR = odds ratio. Selected 4 policies are vending machine restrictions, identification requirements, packaging restrictions, and presence of a statewide enforcement agency.
Adjusted for demographic variables and survey wave (see Methods).
Further adjusted for state excise tax, clean indoor air policy, and tobacco control funding per capita at time of survey.
Finally, to test whether states with high baseline smoking prevalence were more or less likely to adopt restrictive youth access policies, we calculated the correlation coefficient between the prevalence of “current smoking” in 1999 and the policy count variable in 2006. The correlation coefficient was small (–0.02) and nonsignificant (P = .87).
DISCUSSION
Our findings suggest that restricted access to tobacco during adolescence is associated with reduced smoking prevalence in adulthood, but the associations are observed only among women. No single policy exhibited large associations, but various policies may have had small, additive effects. Significant associations with prevalence of both ever smoking and current smoking were observed. Additionally, in analyses limited to lifetime smokers, policies were independently associated with lower prevalence of current heavy smoking.
Although individual policy associations were small, the aggregate effect of multiple policies could be substantial. For example, the multipolicy models (Table 3) suggested that each of the 4 most consistently associated policies could decrease odds for ever smoking by 3.6% for women, or that all 4 combined could lower odds by nearly 14%. Similarly, the cumulative effect of the 4 policies would be a 29% reduction in odds for current heavy smoking among ever smokers. Taken together, these findings offer evidence that youth access policies may promote lower rates of smoking initiation among women, in addition to possibly leading to lighter smoking or quitting.
The 4 policies that exhibited the strongest results when analyzed singularly were vending machine restrictions, identification requirements, repackaging restrictions, and restrictions on free-sample distribution. A mandated statewide enforcement agency was associated with reduced current heavy smoking among ever smokers. Because individual associations were small, we cannot rule out small effects for other policies that were not detected because of power limitations. Accordingly, we predicted smoking from the count of all 9 policies. These results were also consistent with the interpretation that youth access policies exhibit small, additive effects on smoking prevalences, but only for women. Although we cannot rule out the possibility of minor effects for men, the differences in effect sizes between women and men were striking.
Any interpretation of the gender differences in the policy associations is necessarily speculative given our current knowledge. However, given that the Synar policies were intended to intensify the enforcement of nominal purchase ages, a plausible interpretation is that, absent uniform enforcement protocols, girls might have an easier time obtaining age-restricted goods than boys. For example, in a South Australian study, girls younger than 16 years had more success than boys when attempting to illicitly purchase cigarettes.43 In the United States, at least 5 studies—largely conducted prior to the full implementation of Synar amendment policies—exhibited similar findings.11,39–42 Parallel gender differences have been reported for field studies of underage alcohol purchase.44–46 We found no field studies of underage alcohol or tobacco purchases that reported higher success rates for boys. Hence, policies that promote more uniform enforcement of nominal restrictions, such as the Synar policies, might have larger effects on girls’ access to tobacco than on boys’ access.
Interpretation of our results should be tempered by several limitations. Despite using an analytical design that controls for many potential unobserved confounders, alternative explanations for reductions in smoking prevalence among those exposed to more restrictive policies cannot be exhaustively ruled out; potential unmeasured confounders include any factors that changed in the same states and at the same times as state youth access policies. On the other hand, we found no evidence for reverse causation (i.e., there was no correlation between baseline prevalence of smoking at the state level and the number of youth access policies subsequently adopted). Because we examined policy exposure at age 17 years, and some participants would have reached smoking milestones prior to this age, the protective effects of policy with ever smoking prevalence might be underestimated. Nonetheless, the choice of age 17 years is appropriate because most young people do not begin smoking regularly prior to that age.47 Also, because the TUS-CPS provides a year but not the exact date of birth, there is some random error introduced into the policy exposure estimation, in addition to that caused by the proxy use of current state of residence for state of residence during adolescence (see Methods and supplemental data). Random error would bias our findings toward underestimating the effects of policy exposure. Finally, voluntary retailer practices or local ordinances might place restrictions on youth access to tobacco beyond state policy; these effects would not be detected by our analyses. Limitations notwithstanding, the finding that youth access laws might result in substantial, long-term reductions in smoking prevalence, even if reductions are limited to women, is novel and significant. In addition to replication in other samples, future research on potential meditating mechanisms for youth access policies is warranted. For example, youth access policies might influence social norms and other factors more proximal to youth smoking.
Analyses of long-term effects associated with major policy such as the Synar Amendment help inform evidence-based policy evaluation.48 Although a number of studies have described the short-term influence of youth access measures on adolescents6,12,13,15 the results of this study address an area of unmet need by describing their long-term association with behaviors later in life and providing vital information for evaluating long-term benefits against costs. Policies aimed at affecting the health of adolescents and young adults might have effects that persist into older adulthood.20–22 Our analyses of the long-term outcomes associated with Synar Amendment policies provide evidence that maintaining or even strengthening youth access measures might be a worthwhile endeavor.
Acknowledgments
This study was supported by the National Institute of Health (R21DA0266, R01DA031288 [to R. A. G.], R01 DA0269112 [R. A. G., N. L. Saccone, PI], T32 DA07313 [A. D. P., R. K. Price, PI], K01DA025733 [to P. C. R.], K02 DA021237, P01 CA89392 [to L. J. B.], the American Cancer Society (IRG-58-010-54 [to P. C. R.]), and the American Foundation for Suicide Prevention (SRG-00214-1210 [to R. A. G.]). L. J. Bierut is listed as an inventor on a patent (US 20070258898) covering the use of certain genetic polymorphisms in the diagnosis, prognosis, and treatment of addiction.
Human Participant Protection
These analyses used deidentified data obtained from the US Census Bureau and the Minnesota Population Center, University of Minnesota. Study procedures were reviewed and approved by the Washington University Human Research Subjects Protection Office.
References
- 1.Kessler DA, Natanblut SL, Wilkenfeld JP et al. Nicotine addiction: a pediatric disease. J Pediatr. 1997;130(4):518–524. doi: 10.1016/s0022-3476(97)70232-4. [DOI] [PubMed] [Google Scholar]
- 2.Brandt AM. New York, NY: Basic Books; 2007. The Cigarette Century; pp. 385–393. [Google Scholar]
- 3.Forster JL, Widome R, Bernat DH. Policy interventions and surveillance as strategies to prevent tobacco use in adolescents and young adults. Am J Prev Med. 2007;33(6, Suppl):S335–S339. doi: 10.1016/j.amepre.2007.09.014. [DOI] [PubMed] [Google Scholar]
- 4.DiFranza JR, Dussault GF. The federal initiative to halt the sale of tobacco to children–the Synar Amendment, 1992-2000: lessons learned. Tob Control. 2005;14(2):93–98. doi: 10.1136/tc.2004.009373. [DOI] [PMC free article] [PubMed] [Google Scholar]
- 5.Alciati MH, Frosh M, Green SB et al. State laws on youth access to tobacco in the United States: measuring their extensiveness with a new rating system. Tob Control. 1998;7(4):345–352. doi: 10.1136/tc.7.4.345. [DOI] [PMC free article] [PubMed] [Google Scholar]
- 6.Chaloupka FJ. Tobacco Control Lessons Learned: The Impact of State and Local Policies. Chicago, IL: Robert Wood Johnson Foundation and University of Illinois Chicago; 2010 January, 2010. Report No. 38. [Google Scholar]
- 7.Rigotti NA, DiFranza JR, Chang Y, Tisdale T, Kemp B, Singer DE. The effect of enforcing tobacco-sales laws on adolescents’ access to tobacco and smoking behavior. N Engl J Med. 1997;337(15):1044–1051. doi: 10.1056/NEJM199710093371505. [DOI] [PubMed] [Google Scholar]
- 8.Difranza JR, Carlson RR, Caisse RE. Reducing youth access to tobacco. Tob Control. 1992;1(1):58. [Google Scholar]
- 9.Jason LA, Ji PY, Anes MD, Birkhead SH. Active enforcement of cigarette control laws in the prevention of cigarette sales to minors. JAMA. 1991;266(22):3159–3161. [PubMed] [Google Scholar]
- 10.Stead LF, Lancaster T. A systematic review of interventions for preventing tobacco sales to minors. Tob Control. 2000;9(2):169–176. doi: 10.1136/tc.9.2.169. [DOI] [PMC free article] [PubMed] [Google Scholar]
- 11.Forster JL, Murray DM, Wolfson M, Blaine TM, Wagenaar AC, Hennrikus DJ. The effects of community policies to reduce youth access to tobacco. Am J Public Health. 1998;88(8):1193–1198. doi: 10.2105/ajph.88.8.1193. [DOI] [PMC free article] [PubMed] [Google Scholar]
- 12.DiFranza JR, Savageau JA, Fletcher KE. Enforcement of underage sales laws as a predictor of daily smoking among adolescents: a national study. BMC Public Health. 2009;9:107. doi: 10.1186/1471-2458-9-107. [DOI] [PMC free article] [PubMed] [Google Scholar]
- 13.Luke DA, Stamatakis KA, Brownson RC. State youth-access tobacco control policies and youth smoking behavior in the United States. Am J Prev Med. 2000;19(3):180–187. doi: 10.1016/s0749-3797(00)00196-3. [DOI] [PubMed] [Google Scholar]
- 14.Lewit EM, Hyland A, Kerrebrock N, Cummings KM. Price, public policy, and smoking in young people. Tob Control. 1997;6(suppl 2):S17–S24. doi: 10.1136/tc.6.suppl_2.s17. [DOI] [PMC free article] [PubMed] [Google Scholar]
- 15.Botello-Harbaum MT, Haynie DL, Iannotti RJ, Wang J, Gase L, Simons-Morton B. Tobacco control policy and adolescent cigarette smoking status in the United States. Nicotine Tob Res. 2009;11(7):875–885. doi: 10.1093/ntr/ntp081. [DOI] [PMC free article] [PubMed] [Google Scholar]
- 16.Fichtenberg CM, Glantz SA. Youth access interventions do not affect youth smoking. Pediatrics. 2002;109(6):1088–1092. doi: 10.1542/peds.109.6.1088. [DOI] [PubMed] [Google Scholar]
- 17.Chaloupka FJ, Wechsler H. Price, tobacco control policies and smoking among young adults. J Health Econ. 1997;16(3):359–373. doi: 10.1016/s0167-6296(96)00530-9. [DOI] [PubMed] [Google Scholar]
- 18.Glantz SA. Preventing tobacco use–the youth access trap. Am J Public Health. 1996;86(2):156–158. doi: 10.2105/ajph.86.2.156. [DOI] [PMC free article] [PubMed] [Google Scholar]
- 19.Craig MJ, Boris NW. Youth tobacco access restrictions: time to shift resources to other interventions? Health Promot Pract. 2007;8(1):22–27. doi: 10.1177/1524839905279882. [DOI] [PubMed] [Google Scholar]
- 20.Norberg KE, Bierut LJ, Grucza RA. Long-term effects of minimum drinking age laws on past-year alcohol and drug use disorders. Alcohol Clin Exp Res. 2009;33(12):2180–2190. doi: 10.1111/j.1530-0277.2009.01056.x. [DOI] [PMC free article] [PubMed] [Google Scholar]
- 21.Grucza RA, Hipp PR, Norberg KE et al. The legacy of minimum legal drinking age law changes: long-term effects on suicide and homicide deaths among women. Alcohol Clin Exp Res. 2012;36(2):377–384. doi: 10.1111/j.1530-0277.2011.01608.x. [DOI] [PMC free article] [PubMed] [Google Scholar]
- 22.Kaestner R, Yarnoff B. Long-Term eEfects of Minimum Legal Drinking Age Laws on Adult Alcohol Use and Driving Fatalities. Cambridge, MA: National Bureau of Economic Research; 2009. NBER Working Paper No. 15439. [Google Scholar]
- 23.Chambers RA, Taylor JR, Potenza MN. Developmental neurocircuitry of motivation in adolescence: a critical period of addiction vulnerability. Am J Psychiatry. 2003;160(6):1041–1052. doi: 10.1176/appi.ajp.160.6.1041. [DOI] [PMC free article] [PubMed] [Google Scholar]
- 24.Crews F, He J, Hodge C. Adolescent cortical development: a critical period of vulnerability for addiction. Pharmacol Biochem Behav. 2007;86(2):189–199. doi: 10.1016/j.pbb.2006.12.001. [DOI] [PMC free article] [PubMed] [Google Scholar]
- 25.Slotkin TA. Nicotine and the adolescent brain: insights from an animal model. Neurotoxicol Teratol. 2002;24(3):369–384. doi: 10.1016/s0892-0362(02)00199-x. [DOI] [PubMed] [Google Scholar]
- 26. National Cancer Institute and Centers for Disease Control and Prevention co-sponsored tobacco use supplement to the current population survey (1999, 2001-02, 2003, 2006-07). US Department of Commerce, US Census Bureau. 2008. Available at: http://www.census.gov/cps/methodology/techdocs.html. Accessed May 6, 2013. [Google Scholar]
- 27.Heatherton TF, Kozlowski LT, Frecker RC, Rickert W, Robinson J. Measuring the heaviness of smoking: using self-reported time to the first cigarette of the day and number of cigarettes smoked per day. Br J Addict. 1989;84(7):791–799. doi: 10.1111/j.1360-0443.1989.tb03059.x. [DOI] [PubMed] [Google Scholar]
- 28.Tobacco control policy and prevalence data. 1991-2008 codebook and definitions. ImpacTeen Project. 2009. Available at: http://www.impacteen.org/tobaccodata.htm. Accessed May 6, 2013.
- 29.Ashenfelter O, Card D. Using the longitudinal structure of earnings to estimate the effect of training programs. Rev Econ Stat. 1985;67(4):648–660. [Google Scholar]
- 30.Snow J. London, UK: Churchill; 1855. On the Mode of Communication of Cholera. [Google Scholar]
- 31.Angrist J, Pischke J- S. Mostly Harmless Econometrics: An Empiricist’s Companion. Princeton, NJ: Princeton University Press; 2008. [Google Scholar]
- 32.Orzechowski W, Walker RC. The Tax Burden on Tobacco: Historical Compilation. Arlington, VA: Orzechowski and Walker; 2008. [Google Scholar]
- 33.Chriqui JF, Frosh M, Brownson RC et al. Application of a rating system to state clean indoor air laws (USA) Tob Control. 2002;11(1):26–34. doi: 10.1136/tc.11.1.26. [DOI] [PMC free article] [PubMed] [Google Scholar]
- 34.Liang KY, Zeger SL. Longitudinal data analysis using generliazed linear models. Biometrika. 1986;73:13–22. [Google Scholar]
- 35.Arellano M. Computing robust standard errors for within-groups estimators. Oxf Bull Econ Stat. 1987;49(4):431–434. [Google Scholar]
- 36.Cochran WG. Sampling Techniques. New York, NY: John Wiley and Sons; 1977. [Google Scholar]
- 37.West BT. Accounting for Multi-Stage Sample Designs in Complex Sample Variance Estimation (Working Paper) Boca Raton, FL: Chapman Hall/CRC Press; 2010. Supporting Material for “Applied Survey Data Analysis.”. [Google Scholar]
- 38.Groves RM. Survey Errors and Survey Costs. New York, NY: Wiley; 1989. [Google Scholar]
- 39.DiFranza JR, Savageau JA, Aisquith BF. Youth access to tobacco: the effects of age, gender, vending machine locks, and “it's the law” programs. Am J Public Health. 1996;86(2):221–224. doi: 10.2105/ajph.86.2.221. [DOI] [PMC free article] [PubMed] [Google Scholar]
- 40.Altman DG, Foster V, Rasenick-Douss L, Tye JB. Reducing the illegal sale of cigarettes to minors. JAMA. 1989;261(1):80–83. [PubMed] [Google Scholar]
- 41.Cismoski J, Sheridan M. Availability of cigarettes to under-age youth in Fond du Lac, Wisconsin. Wis Med J. 1993;92(11):626–630. [PubMed] [Google Scholar]
- 42.Erickson AD, Woodruff SI, Wildey MB, Kenney E. A baseline assessment of cigarette sales to minors in San Diego, California. J Community Health. 1993;18(4):213–224. doi: 10.1007/BF01324432. [DOI] [PubMed] [Google Scholar]
- 43.Wakefield M, Carrangis J, Wilson D, Reynolds C. Illegal cigarette sales to children in South Australia. Tob Control. 1992;1(2):114–117. [Google Scholar]
- 44.Willner P, Hart K, Binmore J, Cavendish M, Dunphy E. Alcohol sales to underage adolescents: an unobtrusive observational field study and evaluation of a police intervention. Addiction. 2000;95(9):1373–1388. doi: 10.1046/j.1360-0443.2000.95913738.x. [DOI] [PubMed] [Google Scholar]
- 45.Gosselt JF, van Hoof JJ, de Jong MD, Prinsen S. Mystery shopping and alcohol sales: do supermarkets and liquor stores sell alcohol to underage customers? J Adolesc Health. 2007;41(3):302–308. doi: 10.1016/j.jadohealth.2007.04.007. [DOI] [PubMed] [Google Scholar]
- 46.Rossow I, Karlsson T, Raitasalo K. Old enough for a beer? Compliance with minimum legal age for alcohol purchases in monopoly and other off-premise outlets in Finland and Norway. Addiction. 2008;103(9):1468–1473. doi: 10.1111/j.1360-0443.2008.02302.x. [DOI] [PubMed] [Google Scholar]
- 47.Dierker L, He J, Kalaydjian A et al. The importance of timing of transitions for risk of regular smoking and nicotine dependence. Ann Behav Med. 2008;36(1):87–92. doi: 10.1007/s12160-008-9051-x. [DOI] [PMC free article] [PubMed] [Google Scholar]
- 48.Brownson RC, Chriqui JF, Stamatakis KA. Understanding evidence-based public health policy. Am J Public Health. 2009;99(9):1576–1583. doi: 10.2105/AJPH.2008.156224. [DOI] [PMC free article] [PubMed] [Google Scholar]