

Abstract
Genome-wide association studies have highlighted three major lung cancer susceptibility regions at 15q25.1, 5p15.33 and 6p21.33. To gain insight into the possible mechanistic relevance of the genes in these regions, we investigated the regulation of candidate susceptibility gene expression by epigenetic alterations in healthy and lung tumor tissues. For genes up- or downregulated in lung tumors the influence of genetic variants on DNA methylation was investigated and in vitro studies were performed.
We analyzed 394 CpG units within 19 CpG islands in the susceptibility regions in a screening set of 34 patients. Significant findings were validated in an independent patient set (n=50) with available DNA and RNA. The most consistent overall DNA methylation difference between tumor and adjacent normal tissue on 15q25 was tumor hypomethylation in the promoter region of CHRNB4 with a median difference of 8% (p<0.001) which resulted in overexpression of the transcript in tumors (p<0.001). Confirming previous studies we also found hypermethylation in CHRNA3 and TERT with significant expression changes. Decitabine treatment of H1299 cells resulted in reduced methylation levels in gene promoters, elevated transcript levels of CHRNB4 and CHRNA3 and a slight downregulation of TERT demonstrating epigenetic regulation of lung cancer cells. SNPs rs421629 on 5p15.33 and rs1948, rs660652, rs8040868 and rs2036527 on 15q25.1, previously identified as lung cancer risk or nicotine addiction modifiers were associated with tumor DNA methylation levels in the promoters of TERT and CHRNB4 (p<0.001) respectively in two independent sample sets (n=82; n=150). In addition, CHRNB4 knock down in two different cell lines (A549 and H1299) resulted in reduced proliferation (pA549<0.05;pH1299L<0.001) and propensity to form colonies in H1299 cells.
These results suggest epigenetic deregulation of nicotinic acetylcholinereceptor subunit (nAChR) genes which in the case of CHRNB4 is strongly associated with genetic lung cancer susceptibility variants and a functional impact on tumorigenic potential.
Keywords: DNA methylation, risk factors, non-small cell lung cancer (NSCLC), CHRNB4, TERT
Introduction
Due to technical advances, genome-wide association (GWA) studies have now been conducted for most common human malignancies including lung cancer. These studies have identified genetic variants associated with chromosomal regions conferring elevated risks to cancer development. This is well exemplified by three independent studies on lung cancer that identified strong associations between single nucleotide polymorphisms (SNPs) on chromosome 15q25.1 and lung cancer risk (1–3). Six genes namely iron-responsive element binding protein 2 (IREB2), aminoglycosid phosphotransferase domain (AGPHD), proteasome alpha subunit isoform 1 (PSMA4) and the nicotinic acetylcholine receptor subunit gene cluster consisting of CHRNA5, CHRNA3 and CHRNB4 are situated at this locus. Two further studies have identified additional chromosomal regions on 5p15.33 and 6p21.33 as highly associated with individual risk of developing lung cancer (4, 5). These two regions harbor three genes: telomerase reverse transcriptase (TERT) coding for the catalytic subunit of the human telomerase, cleft-lip palate transmembrane protein 1-like (CLPTM1L) and HLA-B associated transcript 3 (BAT3). These studies suggest that genetic variants may predispose towards, or support the development of lung cancer. Currently, underlying genes and functional mechanisms causing the elevated risk for many of the identified cancer risk loci in GWAs are unknown, indicating the need to investigate the regulation of candidate genes in these genomic regions (6).
With about 1.35 million new cases per year, lung cancer is the most common cancer and the leading cause of cancer-related death worldwide (7). The initiation and progression of lung cancer is caused by various events altering genomic structure through changes in the DNA sequence and/or alteration of gene copy number, affecting gene expression and/or function. Altered epigenetic regulation, e.g. changes in chromatin structure, DNA methylation and abundance of small RNAs, is also involved in tumorigenesis (8–10). Early estimates of global frequencies for CpG island methylation have suggested that up to 5.3% of all CpG islands in a lung tumor genome are targeted by aberrant DNA hypermethylation (11). Methylation events frequently lead to gene silencing of potential tumor suppressor genes (12). Aberrant DNA methylation has been described as an early event in lung tumorigenesis (13, 14) suggesting a role in tumor initiation and early steps of tumor progression. Brena et al. have shown that DNA methylation patterns may serve as prognostic factors (15) and genetic and epigenetic events may act in a concerted manner in human tumorigenesis (16). One way in which genetic variation could affect lung cancer risk would be the modification of epigenetic alterations in regulatory regions (17–21). A recent study investigated epigenetic targets in the CHRN gene cluster on 15q25.1 and found epigenetic silencing of CHRNA3 which impacts the ability to enter into apoptosis (22).
In this study, we investigate the hypothesis that epigenetic patterns in three genetic susceptibility regions are altered in non-small cell lung (NSCLC) cancer, and thus, deregulate the expression of lung cancer risk genes. We determined methylation patterns of all CpG islands across the three lung cancer susceptibility regions. We additionally hypothesized that there might be a connection between the genetic variation and epigenetic patterns and analyzed tagSNPs to investigate the association of genetic variation with DNA methylation.
Results
DNA methylation screen in lung cancer susceptibility regions identifies aberrantly methylated genes
In order to evaluate a possible epigenetic gene silencing of candidate lung cancer susceptibility genes in malignant tissue, we systematically investigated quantitative DNA methylation levels in 29 amplicons within 19 CpG islands (CGIs) situated in the three lung cancer susceptibility regions. DNA methylation was analyzed in both lung tumor and adjacent normal lung tissue from a screening set (set-1) consisting of 34 patients with adenocarcinoma (AdC) and squamous cell carcinoma (SCC) including all stages (see Table 1 for main characteristics of the investigated study populations). The relative location of CGIs in the susceptibility regions is shown in the upper part of Figure 1. Actual methylation values are represented in the middle part and estimated median methylation differences with 95% confidence intervals (CIs) are shown in the lower part of the figure. We consistently observed DNA hypomethylation in tumors in the promoter of CHRNB4 where the median difference was −8% (95%CI −12% to −3%, p≤0.001) (Figure 1A). Upstream of the transcriptional start site of CHRNB4 we found a moderate but non-significant hypermethylation in tumors, consistent with a previous report (22). Additionally, we confirmed hypermethylation of previously published candidates like CHRNA3 on 15q25.1 (median hypermethylation 8%, 95%CI 4% to 12%, p≤0.001) and TERT on chromosome 5p15.33, where we observed the strongest hypermethylation in the 5′-UTR sequence of the TERT gene (Median difference 16%, 95%CI 11% to 21%, p<0.001) (22). This was observed in both histologies (SCC median difference 14.5%; p<0.001, AdC median difference (AdC)=8%, p<0.001). CGIs in the gene body of TERT showed consistent hypomethylation (Figure 1B). The eight amplicons analyzed in the promoter regions of CLPTM1L and BAT3 (chromosomal region 6p21.33) did not show statistically significant differences in methylation (data not shown).
Table 1.
Characteristics of the 3 patient sets used for methylation analysis
| Variable | Set-1 (N=34) | Set-2 (N=48) | Set-3 (n=150) | |
|---|---|---|---|---|
| Age | 42 to 78 | 40 to 81 | 38 to 85 | |
| Median 61 | Median 67 | Median 63 | ||
| Gender | Women | 8 (24%) | 20 (42%) | 43 (28.7%) |
| Men | 26 (76%) | 28 (58%) | 107 (71.3%) | |
| Smoking | Current-smoker | 23 (68%) | 15 (30%) | 45 (31.2%) |
| Ex-smoker | 11 (32%) | 27 (58%) | 89 (61.8%) | |
| Non-smoker | 6 (12%) | 10 (7%) | ||
| Packyears | (21 cases without information) | 5 to 98 | 0 to 80 | 0 to 120 |
| Median 38 | Median 30 | Median 40 |
Packyears information was not avalable for 2 patients from set-2 and 19 patients from set-3
Set 1 consists of 18 AdC and 16 SCC with all stages
Set 2 consists of 24 squamous cell carcinoma (10 × Stage I, 9 × Stage II, 5 × Stage III) and 24 adenocarcinoma (AdC) (10 × Stage I, 10 × Stage II, 4 × Stage III) patients.
Set-3 consists of 75 SCC and 75 AdC patients (each histology: 35 × Stage I, 20 × Stage II, 20× Stage III)
Figure 1. Genomic regions associated with increased lung cancer susceptibility and differences in CpG island DNA methylation.

A Genomic region of 15q25.1 with genes IREB2, AGPHD, PSMA4, CHRNA5, CHRNA3 and CHRNB4. B Region 5p15.33 with TERT and CLPTM1L. Single nucleotide Polymorphism (SNP) positions (indicated by arrows) and CpG islands (CGI) information was extracted from the website of the UCSC Genome Browser (http://genome.ucsc.edu). Each figure shows the relative position of the CpGs investigated. Heatmaps for 34 lung cancer patients (each row represents one patient) indicate the differences in DNA methylation levels between lung tumor and adjacent normal tissue DNAs in single CpG unit resolution (each column represents one CpG unit). Green indicates hypomethylation, red indicates hypermethylation. Confidence intervals for methylation differences in preselected CpGs, based on intra-sample correlation, are depicted below the heatmap.
Stars (*) indicate the amplicons with significantly aberrant methylation in tumors with p≤0.001.
For amplicons which showed methylation differences in set 1, analyses were repeated in a validation set (set-2) of 48 tumor-normal matched pairs (Table 1). Statistical analyses confirmed significant methylation differences for CHRNB4, CHRNA3 and TERT (Supplemental Figure 1). Overall, three CpG units in CHRNA3, nine CpGs units in TERT and twelve CpGs units in CHRNB4 were included in the analysis. After stratification for histology in set-2, amplicon-wise hypermethylation was validated for CHRNA3 in adenocarcinoma patients (median difference 10.5%, 95%CI 5% to 15%, p<0.001), hypomethylation for CHRNB4 in SCC (median difference=−5.5%, 95%CI −7% to −3%, p<0.001) and hypermethylation for TERT in both histologies (median difference (SCC) 14%, 95%CI 9–20% p<0.001; median difference (AdC) 8%, 95%CI 4–13%, p<0.001).
Expression of target genes is in line with DNA methylation events
We next investigated whether altered DNA methylation levels in tumor tissue correlate with reduced gene expression. The expression pattern was investigated for genes with confirmed differential methylation in tumor versus adjacent normal tissue, namely CHRNB4, CHRNA3 and TERT. To assess differential gene expression, we analyzed the 48 tumor/normal pairs from set-2 using quantitative RT-PCR. For CHRNB4 we detected increased transcription in lung tumors of both histological subgroups (p=2.3*10−13). A larger than four-fold up-regulation of CHRNB4 transcription levels was observed in 21 of 23 stage SCC patient tumors. Statistical analysis revealed a significant overall down-regulation of CHRNA3 (p=0.02). After stratification for histology the strongest effect was detected in SCCs (median four-fold reduction, p=0.002). CHRNA3 down-regulation (at least four-fold) was seen in four out of ten stage I, all stage II tumors and in one of five stage III tumors. In AdCs no uniform down-regulation was observed and the data showed high variation, but CHRNA3 expression in stage I tumors appeared down-regulated (Figure 2). Median TERT mRNA expression was 10-fold up-regulated in tumors (p=3.8*10−7) which cannot readily be explained by the observed DNA methylation data, but is in agreement with a previous study (23). In order to explore the possible relationship between methylation and expression, we dichotomized methylation differences (under or over 20%) and expression fold changes (under or over 4-fold) in tumor compared to adjacent normal tissue. The best concordance between promoter methylation and transcript level was observed for CHRNB4, where 83% of hypomethylated samples showed up-regulation. A weaker concordance was observed for CHRNA3 where 53% of samples showed hypermethylation and down-regulation.
Figure 2. Expression analysis in genes shown to be differentially methylated in tumor/normal matched pairs.

Normalized RT-PCR expression data shown as fold expression in tumor versus normal tissue for 3 genes are depicted for 48 patients, including 24 squamous cell carcinoma (10 × Stage I, 9 × Stage II, 5 × Stage III) and 24 adenocarcinoma (AdC) (10 × Stage I, 10 × Stage II, 4× Stage III) patients, stratified by histology and stage. All expression data was normalized to to the average of two housekeeping genes succinate dehydrogenase complex subunit A (SDHA) and TATA binding protein (TBP). Median values are indicated by bold horizontal lines. Dotted line represents no difference.
Stars indicate significance; ** Pval≤0.008, * Pval≤0.03
In 65% of the samples TERT showed the previously reported, counterintuitive concordance of hypermethylation with increased mRNA expression. Taken together, differential DNA methylation patterns observed for the genes coding for subunits of the nicotinic acetylcholine receptor seemed to agree with overall expression.
5-aza-2′-deoxycytidine treatment of lung cancer cell line H1299 results in reexpression of target genes
In order to test whether the removal of the epigenetic marks restores gene expression levels we measured gene expression in the lung cancer cell line H1299, without treatment, and following treatment with 0.5 μM of 5-aza-2′-deoxycytidine (5-Aza-dC) Figure 3. We chose long interspersed nuclear element 1 (LINE1) repeat DNA methylation as a surrogate for the effective loss of methylation following 5-Aza-dC treatment. H1299 cells showed reduced levels of LINE1 methylation indicating successful treatment with 5-Aza-dC. Three genes (CHRNA3, CHRNB4 and TERT) showed promoter methylation in H1299 ranging from 24−57%. Following treatment, a reduced level of DNA methylation at CHRNA3 (21% versus 19%, p=0.002) and CHRNB4 (55% versus 42%, p<0.0002) was found, that associated with increased expression (Figure 3B, p<0.01). A reduced TERT methylation (p=0.0006) was observed but the correlation with expression did not reach statistical significance, a finding in agreement with results in tissue samples.
Figure 3. In vitro demethylation and expression of selected genes in the lung cancer cell line H1299.
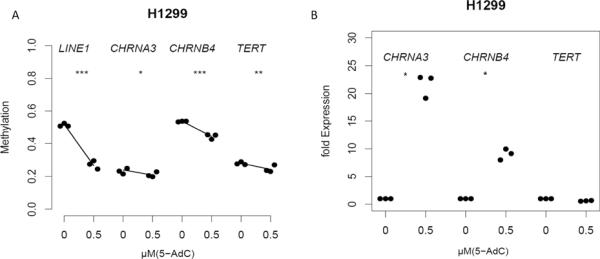
A Dots summarize the average methylation and B normalized fold expression for three replicates (treated vs untreated) of 3 genes in the lung cancer cell line and H1299 without treatment, and following treatment with 0.5 μM of 5-aza-2′-deoxycytidine (5-Aza-dC). LINE1 repeat DNA methylation serves as a marker for the efficiency of 5-Aza-dC treatment. Robust bisquare M-regression was used to explore changes in methylation and expression after 72 h 5-Aza-dC-treatment.
Stars indicate significance for changes in methylation;* Pval=0.002, **Pval=0.0006
*** Pval<0.0002
Stars indicate significance for changes in expression; *Pval<0.05
Genotyping of tagSNPs identifies variant which influence methylation in tumors
To gain insight into the interplay between the epigenetic and genetic factors we genotyped 42 SNPs covering the three susceptibility regions identified in the GWA studies (see Supplemental Table 3). This set included 26 SNPs from rs11639224 to rs11857532 covering the 15q25.1 susceptibility region, 8 SNPs from rs4073918 to rs421629 on 5p15.33 and 8 SNPs from rs1046080 to rs7029 covering the 6p21.33 susceptibility region. We also genotyped the reported variants for lung cancer risk and nicotine dependence rs1051730, rs8034191 and rs12914385 on 15q25.1, as well as rs2736100 on 5p15.33 (1, 5). Genotyping was performed on blood DNA from the set-1 cases, normal lung DNA from the set-2 cases and later on tumor DNA from set-3 patients (Table 1). In order to determine the validity of the genotypes obtained from tumor tissue in set-3, the available 18 paired samples of adjacent normal tissue were also genotyped and 100% correlation with tumor-genotypes was observed. We evaluated whether there is an association between genotype and methylation in normal lung tissue, lung tumor tissue, or the difference between methylation in tumor versus normal lung tissue (set-1 and set-2). The within-amplicon correlation of methylation values among CpG units is represented in Figures 4A and 5A. This correlation was taken into account by bootstrapping to generate amplicon-wise estimates of methylation differences. In order to detect genotype-methylation associations DNA methylation data were investigated assuming a dominant, a recessive and a three-genotype model for the effect of the variant allele. After applying a Kruskal-Wallis test to detect associations between genotypes and methylation in set-1 and -2 the SNPs rs1948 (p=0.0001) (Figure 4B), rs 660652 (p=0.005) (Figure 4C), rs 8040868 (p=0.01) (Figure 4D), and rs 2036527 (p= 1×10⁻⁸) (Figure 4E) on 15q25.1 and one SNP rs421629 on chromosome 5p15.33 were significantly associated with ampliconwise tumor DNA methylation in the CHRNB4 and TERT (Figure 5B) promoters, respectively. For CHRNA3 we observed a significant association at the amplicon-wise level with very minor differences among genotypes at CpG unit resolution (see Supplemental-Figure 4). The rs421629-TERT ampliconwise DNA methylation association was also true (p<0.01) for normal lung tissue (Figure 5C) even though this significance could not be detected on single CpG unit level (see Figure 5D). We were able to validate significant tumor-specific associations in set-3 tumors (n=150) for all SNPs detected in the screen (prs1948=5×10⁻⁵, prs660652=0.0001, prs8040868=0.0007, prs2036527=0.03, prs421629=0.003 see Figure 4). To evaluate the linkage between the SNPs associated with DNA methylation in our study and the reported GWA risk SNPs we used the haplotype analysis software THESIAS 3.1 {, 2008 #7}. In our sample set we would predict the SNPs rs8034191, rs2036527, rs1051730 and rs8040868 to be situated in one haplotype block underlining the importance of our findings (see Supplemental-table 5).
Figure 4. Tumor DNA-methylation at CHRNB4 promoter stratified by genotype.

Significant differences in tumor tissue DNA methylation levels in this CHRNB4 promoter CpG island are observed between individuals with different genotypes (Kruskal Wallis test, p<0.001). A) Correlation plot for CpG units in the promoters of CHRNB4 For the four significant SNPs B) rs1948 C) rs660552 D) rs8040868 E) rs2036527 the distribution of tumor DNA-methylation in the particular genotype is plotted. The large panels show this for all CpGs in the first screen of 82 tumors (set-1 and -2) A separate analysis of a further 150 tumors (set-3) showed the strongest genotype-specific methylation differences for CpG units 22.23, 32.33, and 34 shown in the small panels. Median values are indicated by bold horizontal lines. Genotype distributions: rs 1948: CC n=101; CT n=97; TT n= 23; rs 660652: AA n=32; AG n=102; GG n=92.; rs 8040868: CC n=43; CT n=116; TT n=60; rs 2036527 CC n=72; CT n=116; TT n=34.
Figure 5. Tumor DNA-methylation at the TERT promoter stratified by rs421629.

A) Correlation plot for methylation at TERT-4 CpG units (plotted from -1 to 1). Significant differences were detected for amplicon-wise methylation differences among genotypes in B) tumors (n=82, p< 0.001) and C adjacent normal tissue (n=82, p<0.001). The distribution of single CpG unit methylation values was plotted according to genotypes. D) In an independent analysis of 150 tumor samples (Set-3) CpG units 31–33 and 34 showed a similar trend. Genotype distributions for the whole sampleset were CC=88, CT=99, TT=37
In order to investigate whether the methylation in the promoter region of CHRNB4 is allele specific, we took advantage of public data repositories to explore the pattern of linkage disequilibrium (LD) in the investigated region. Supplemental Figure 5 summarizes these results. Based on the CEU panel of The 1000 Genomes Project (Utah residents with Northern and Western European ancestry from the CEPH collection), we found several recombination hotspots in the region. The polymorphisms genotyped in the present study and variants which have been previously reported to be associated with lung cancer risk generally shared a LD block. Interestingly, the variant rs67426328 in the promoter region of the investigated genes showed a moderate LD with several variants we found to be associated with methylation, for example rs1948 (r2=0.65) and rs8040868 (r2=0.65) (Supplemental Figure 6).
Further we sequenced the CHRNB4 promoter of 20 lung cancer cases preselected for heterozygosity at rs8040868 and rs1948. At rs67426328 five were homozygous for CC, four for GG and eleven were CG carriers reflecting an overall linkage of R2=0.36 to the SNPs rs1948 and rs8040868. Tumors and adjacent normals of four of the heterozygous individuals were selected for bisulfite sequencing.
Forty-five independent clones from tumors and fifty-four from adjacent normal tissue were sequenced. and revealed significant overall hypomethylation in tumors (39.8% methylation) compared to normal lung tissue (48.3% methylation) (p=0.0002) (Supplemental Figure 7). In addition we investigated the question if there is allele-specific methylation present in tumors and adjacent normal tissues. In the normal tissue we could detect differential methylation in the promoter region between C (25 clones, 44%) and G alleles (29 clones, 51.9%) (p=0.015). In the tumor tissue we found methylation differences between the C (22 clones; 50.5%) and the G allele (23 clones; 27.9%) DNA methylation (p<0.0001).
Taken together, we found genotype methylation correlations mainly in tumor tissue in a screening set and were able to validate the results in an independent set of 150 further tumors. In addition we could detect allelic segregation of DNA methylation analyzing four individuals heterozygous for the CHRNB4 promoter SNP rs67426328. These data limited by the fragment size that can successfully be bisulfite sequenced cannot be directly linked to our tagging-SNP related data as the promoter variant only shows 36% linkage to our associated SNPs rs1948 and rs8040868.
Taken together, we found genotype methylation correlations mainly in tumor tissue in a screening set and were able to validate the results in an independent set of 150 further tumors. In addition we could detect allelic segregation of DNA methylation analyzing four individuals heterozygous for the CHRNB4 promoter SNP rs67426328. These data cannot be directly linked to our data as the promoter variant only shows 36% linkage to our associated SNPs rs1948 and rs8040868.
CHRNB4 knockdown leads to reduced proliferation and propensity to form colonies
In order to test tumor-specific features of CHRNB4 expression we knocked down the transcript in two lung cancer cell lines H1299 and A549. After treatment of lung cancer cells with a pool of four different siRNAs, each targeting CHRNB4, for 96h we detected a reduced HOECHST signal which represents DNA amount for H1299 (p=0.0002) and A549 (p=0.0059) cells (Figure 6A). The second measurement of Calcein signals, which indicates the amount of metabolic active cells, showed significance for both cell lines (H1299, p<0.0001; A549, p=0.0213) as well (Figure 6B). A reduced transcript level of CHRNB4 in H1299 and A549 was detected using RT-PCR (H1299, p<0.05; A549, p<0.001) Figure 6C. A time course experiment measuring the growth of cells every 24h reveals a different doubling time between treated and untreated cells (Figure 6D). Single evaluation in a deconvolution experiment testing the four single siRNAs separately confirmed our observations on HOECHST (Figure 6E) and Calcein levels (Figure 6F). Furthermore colony formation assays revealed a reduced ability to form colonies in CHRNB4 knockdown cells seeded in two different concentrations (Figure 6G). Taken together our observations strongly indicate an influence of CHRNB4 transcripts on proliferation and further on the propensity to form colonies.
Figure 6. siRNA mediated knockdown of CHRNB4 in lung cancer cell lines.

H1299 and A549 cells were treated with 20 nM of a siRNA pool against the CHRNB4 transcript for 96h. Cells were seeded in quadruplicates. Cell proliferation was measured employing A) HOECHST staining which represents the amount of DNA and B) with Calcein staining which measures the metabolic activity in a cell population. C) Expression of CHRNB4 in knockdown cells was detected by qPCR and normalized to expression in siCON treated cells. D) A time course experiment with Hoechst measurement every 24h revealed diverging growth curves for cells treated with siRNAs against CHRNB4 compared to those ones that were treated with siCON siRNAs E) and F) Deconvolution experiments with four single siRNAs (20nM) in H1299 and A549 G) Knockdown for both cell lines in the deconvolution experiment H) CHRNB4 knockdown cells show a reduced propensity to form colonies. Results are displayed from a 6-well plate and also in a bar chart.
Signal intensity is given as raw values (relative units)
*: p<0.05
**: p<0.01
***: p<0.001
Ns: not significant
Discussion
Several genome-wide association studies and a subsequent meta-analysis have identified three consistent haplotypes conferring elevated risk for lung cancer on chromosomes 15q25.1, 6p21.33 and 5p15.33. Possible explanations for increased risk could be expression differences of genes in these regions due to genetic variation in regulatory sequences or epigenetic modifications, different activities of proteins encoded by different alleles, or increased likelihood of genes to become deregulated during tumorigenesis. In the present study we quantified DNA methylation levels ampliconwise in lung tumor tissues in CGIs of the three candidate regions and compared these profiles to those in normal lung tissue. Our search for aberrant DNA methylation changes identified hypomethylation for CHRNB4 and hypermethylation for CHRNA3 and TERT, as well as expression changes on the RNA level. In vitro treatment with the demethylating drug 5-Aza-dC and subsequent elevated expression of gene products confirmed the regulating effects of epigenetic marks in gene promoters. We were able to link genetic and epigenetic factors in the TERT and CHRNB4 promoter and found functional relevance for CHRNB4 transcript levels in cell lines underscoring the tissue-specific results.
The present data suggests CHRNB4 as a new susceptibility gene on 15q25.1, responsible for the increased risk of certain individuals of developing lung cancer. Sequence-dependent, allele-specific methylation is a newly recognized phenomenon which was also found to be relevant for tumorigenesis (21, 24–26). In an effort to link genetic and epigenetic modifications in the lung cancer susceptibility regions, we looked for SNPs that significantly affect DNA methylation levels at certain CpG sites. We found the strongest evidence for genotype-specific methylation in the promoter of CHRNB4 caused by SNPs that were recently described as significantly associated either with lung cancer risk in Afro Americans (27) or with onset of tobacco smoking (28–30). We found the strongest genotype-specific methylation for CHRNB4 in the tumor and not in the adjacent normal tissue which indicates a tumor-specific effect. Given the large proportion of ever-smokers in our study population our analyses could not determine smoking relatedness of this effect. However, we could show linkage of alleles of a promoter SNP to methylation. Given that the risk SNPs are related to cigarette consumption, it is possible that the genotype-specific methylation events in dedifferentiated cells, could be related to smoking as an environmental factor which interacts with the CHRNB4 promoter. This would also explain the deregulation of CHRNB4 in nearly every tumor sample, which is evidently relevant for growth of lung cancer cell lines. In order to investigate if the transcription factor ASCL1 recently reported to regulate CHRNA3 and CHRNB4 expression {Improgo, #3367} binds to sites involving any of the differentially methylated CpGs we searched for E-Boxes throughout the promoter region but could not find any CpG involved in ASCL1 binding sites (see Supplemetal Figure 4). To sum up the major findings in the genomic region 15q25.1 our data together with data from Paliwal et al. (22) suggest an underlying deregulation of nicotinic acetylcholinereceptor subunit genes (nAChR) genes in cancer and a direct effect on tumorigenesis.
For TERT, our data confirm and support previous findings regarding the promoter hypermethylation and tumor-specific expression of the catalytic subunit of telomerase. Additionally, we found strong gene body hypomethylation which could contribute to more open DNA conformation and higher transcription activity (31). Recent data also suggest a connection between DNA methylation, transcription, histone modification and alternative splicing, which could reflect an important role of gene body CpG islands in the TERT gene (32–34).
Our data also show an association between genotype and quantitative methylation level in the promoter of TERT promoter in lung tumors and also in adjacent normal tissue.
A possible mechanism for our observations regarding genotype-methylation patterns in TERT might be that SNPs alter DNA binding sites for protein complexes that either recruit epigenetic modifiers (35–37) or affect binding of transcription factors resulting in altered gene expression from the individual alleles, which subsequently results in different epigenetic modifications (38). It suggests a cancer supporting event which is dependent on the genotype and impacts the epigenetic pattern either on DNA methylation or on chromatin level. It may also describe a novel mechanism of carcinogenesis with treatment promise due to the relevance of TERT expression (39).
Future experiments will aim at mutagenesis of the identified SNPs in cell lines and animal models and measurement of the epigenetic consequences in order to determine the causality of variants situated in the lung cancer risk regions.
Our results may also guide the ranking of candidate lung cancer risk genes. For chromosome 15q25.1, they include the nAChR subunit genes, CHRNA3 and CHRNB4. These genes belong to a gene family comprised of five subunits assembling to either homo- (α7, 8 or 9 subunit receptors) or heteropentamers (combinations of α2–6 or α10 with β2–4 subunits) enclosing a central ion channel. Dependent on the type of the expressed receptors, different signal cascades, e.g. apoptosis or the Ras-MAPK pathway, are induced in the cell by calcium influx (40). It has been shown that nicotine, by binding, activates homomeric α7 receptors, regulating the release of epidermal growth factor (EGF) as well as the stress hormones adrenaline and noradrenaline, and thus contributes to several cancers including lung cancer (41). Because of a higher affinity to nicotine, the heteromeric receptors are rapidly desensitized by smoking exposure (42), which leads to the interruption of γ-aminobutyric acid (GABA) excretion, which beside the inhibitory neurotransmitter function, has been shown to have tumor suppressing effects in numerous cancers (43). Even though previous studies have indicated that nAChR genes are also involved in smoking addiction thus affecting lung cancer risk, our study together with results from Paliwal and colleagues (22) reveal the direct importance of CHRNA3 and CHRNB4 expression in lung tumorigenesis. If the underlying mechanism causing epigenetic deregulation and subsequent loss of function is based on heritable host factors, it could even mimic strong environmental exposure to tobacco smoke, which would also explain the strong correlation of lung cancer susceptibility to 15q25 SNPs regardless of the smoking status (44). Another recent study was able to detect two risk haplotypes for familial lung cancer after 15q25.1 fine-mapping. One contains PSMA4 which was found to be overexpressed in lung cancer and to have a proliferative effect in lung cancer cell lines. The other risk haplotype includes CHRNA3/5 and CHRNB4 (45). Our results implicate epigenetic deregulation of CHRNA3 and CHRNB4 in lung cancer susceptibility.
With CHRNB4 we found a new strong candidate for lung carcinogenesis, which is deregulated in nearly every sample. To our knowledge this is the first study pointing to a connection between genetics and epigenetics in lung cancer susceptibility as a potential mechanism involved in lung tumorigenesis. Further experiments are required to bring methylation as well as other epigenetic layers, expression and tumor development into a chronological context and to sort the effects of differential gene expression to cell metabolism and detoxification or smoking behaviour. Our study also serves as “proof of concept”, suggesting that regions associated with genetic susceptibility to cancer are good targets to identify epigenetic aberrations which can be linked to genetic background and which deregulate genes influencing cell growth making this approach relevant to cancer research. Further interdisciplinary approaches to investigate the events in lung tumorigenesis are necessary to elucidate the function of different levels of biological information.
Materials and Methods
Study population
For the initial methylation screen, DNAs isolated from sample pairs each consisting of frozen, histologically confirmed tumor and adjacent normal lung tissue, from 34 lung cancer patients recruited at the Thoraxklinik Heidelberg were used (set-1). Freshly-frozen, histologically confirmed tumor samples from another 48 non-small cell lung cancer (NSCLC) patients, as well as the corresponding adjacent morphologically normal lung tissue were retrieved from the tissue bank of the Thoraxklinik in Heidelberg (set-2). These were used as a validation set for methylation and expression analyses of target genes identified in the initial screen. For the genotype analysis gDNA was isolated from blood samples of set-1 patients and normal lung tissue DNA from set-2. For replication of genotypemethylation associations we analyzed another independent set of tumors (n=150, set-3). Matched normal tissues of >10% of the set-3 patients (n=18) were also genotyped to exclude systematic tumor-specific genotype alterations. All study participants provided written informed consent, the collection and use of the materials was approved by the Ethics committee of the University of Heidelberg (270/2001; 199/2001). (See Table 1 for a detailed description of the study groups.)
DNA isolation
DNA from tissue was isolated using the DNeasy Blood and Tissue Kit (Qiagen, Hilden) according to the manufacturer's protocol or by proteinase K digestion with subsequent precipitation. Genomic DNA from whole blood or buffy coat from 5 ml venous blood in EDTA was isolated using either the QIAamp DNA blood midi kit (Qiagen), or by an automated DNA extraction protocol on the MagNA Pure System (Roche) according to the manufacturer's instructions.
RNA isolation, reverse transcription and expression analysis
Tumors and adjacent normal lung tissues from sample set-2 were used to extract RNA. RNAs were isolated using the RNeasy Mini kit (Qiagen) according to the manufacturer's protocol. To generate cDNAs two aliquots of 0.5μg total RNA were reverse transcribed using the First Strand Synthesis Supermix (Invitrogen, Karlsruhe, Germany). First strand synthesis of the RNA was conducted with OligodT as well as random hexamer primers. Both reactions were combined afterwards. Reverse transcription PCR was performed with a LightCycler (Roche, Basel, Switzerland) with primers and conditions as listed in Supplementary Table 1. Gene expression was normalized to the average expression of the two housekeeping genes succinate dehydrogenase complex subunit A (SDHA) and TATA binding protein (TBP) (see Supplemental Figure 3).
Methylation analysis
Quantitative DNA methylation analysis was conducted using base-specific cleavage and matrix-assisted laser desorption ionization time-of-flight mass spectrometry (MALDI-TOF MS) with the Epityper application (Sequenom, San Diego). The method includes bisulfite treatment of genomic DNA, PCR, in vitro transcription and base-specific cleavage of the generated RNA followed by mass-spectrometry analysis (46). Generated RNA fragments contain one or more CpGs which are termed one CpG unit. In order to correct for a potential PCR bias, we generated a six point standard by mixing in vitro whole genome amplified DNA (unmethylated) with SssI treated (methylated) DNA in defined ratios of 0, 20, 40, 60, 80, 100 %. The standard was included for each amplicon and best fitting curves were computed using R statistical environment on http://www.r-project.org (R 2.9.0). DNA methylation data possibly influenced by variations in DNA sequence (e.g. published or newly identified SNPs) within the amplicon were eliminated. Primers and conditions as listed in Supplemental Table 2.
For bisulfite sequencing of the CHRNB4 promoter we amplified the bisulfite treated DNA with primers that included the SNP rs67426328 and substantial parts of the promoter of CHRNB4 (see Supplemental Table 3 and Supplemental Figure 4). Analysis was conducted using the DNA methylation analysis platform BISMA online http://biochem.jacobs-university.de/BDPC/BISMA/AnalyzeMethylationUniqueSequence.php.
Genotyping
Non-tumor DNAs of 82 patients (set-1 and set-2) with confirmed lung cancerwere genotyped using the iPlex Typer application (Sequenom) as previously described (47). Information for the SNPs selection (Supplemental Table 3) was extracted from the website of the international HapMap project http://hapmap.ncbi.nlm.nih.gov/. We selected SNPs that cover the three genomic regions of interest with a R2>0.8 and MAF of >0.05. Additionally, we genotyped SNPs which have been found to be significantly associated with lung cancer risk or nicotine addiction in genome-wide association studies (1, 2, 5) and SNPs used for haplotype analyses on 15q25 (45). SNPs genotyped with call rates <90% or those that did not meet Hardy Weinberg equilibrium in the controls were excluded from further analyses. For the replication analysis lung tumor DNA from a further 150 patients (set-3) was genotyped.
Knockdown and 5-aza-2′-deoxycytidine treatment
The human lung cancer cell lines A549 and H1299 were a gift of Dr. Ruprecht Kuner and was cultured in RPMI 1640 with 10 mM Hepes (PAN, Hannover), supplemented with 10% fetal bovine serum. Cells were grown in tissue culture flasks at 37°C in a 5% CO2 atmosphere. Treatment for H1299 was performed with a concentration of 0.5μM 5-aza-2′-deoxycytidine (5-Aza-dC) added to the media for 72h, with fresh media replacements every 24 h.
We conducted gene knockdown of CHRNB4 using siRNAs (Dharmacon) in 20nM concentration for 96h in A549 and H1299 cells.
As a control we used scrambled siRNAs (siCON) for normalization of our readout. We used Hoechst (4μg/ml end concentration) and Calcein (0.1μg/ml end concentration) costaining for detection of DNA amount and metabolic activity representing cell number. The SpectraMax plate reader was used to analyze luminescent signals.
For colony formation assays we transfected cells with 20 nM concentration of CHRNB4 and siCON siRNAs respectively. After 24 hours we washed the cells with PBS, detached the cells by Trypsin/EDTA treatment and passaged them into a fresh 6-well plate seeding two different cell numbers, namely 200 and 400 cells. For determination of propensity to form colonies we counted colonies as previously published (48).
Statistical analyses
The non-normal distribution of methylation and expression data and the relatively small number of observations for some experiments motivated the use of non-parametric statistics. Differences in methylation levels were investigated by using Wilcoxon signed ranks tests and quantified by median values with 95% confidence intervals. Heatmaps were created with the TIGR Multi-Experiment Viewer software (TIGR MeV 4.1). Transcript level up- or down-regulation in tumor and matched adjacent normal tissue pairs was quantified by median fold-changes and assessed using Wilcoxon signed rank tests (H0: μ=1). Robust bisquare M-regression was used to explore changes in methylation and expression after 72 h 5-Aza-dC-treatment (0.5 and 1μM) of the cell line. The correlation among methylation levels in neighboring CpG units, and the relationship between methylation and gene expression were measured by Spearman's rank correlation rho. Amplicon-wise associations were quantified by bootstrapping, taking into account the intra-sample correlation of methylation values (10 000 bootstrap samples). Deviation from Hardy-Weinberg equilibrium among control genotypes was investigated by chi-square tests. The association between genotype and lung cancer was analysed using multivariable logistic regression, where odds ratios were adjusted for age, gender and smoking status. Kruskal-Wallis tests were used to evaluate genotype-methylation associations.
Supplementary Material
Acknowledgements
We thank Frau Heinzmann-Groth, Birgit Jäger and all other members of the clinical and laboratory teams for help with sample and/or data collection and archiving for the Heidelberg lung study. We are grateful to all patients at the Thoraxklinik Heidelberg, who participated in the study. We thank Ruprecht Kuner for the cell lines, Oliver Mücke for competent technical assistance, Chris Amos for helpful comments on the manuscript and the members of the Plass Laboratory for thoughtful discussions.
Financial Support Grant support: This work was in part supported by the National Institute of Health (USA) [grant number CA148127] and earlier sample collection by the Deutsche Krebshilfe [grant number 70-2387]. JLB was in part supported by a grant of the Deutsche Forschungsgemeinschaft (DFG, SFB/TRR77, project Z2). The scientific development and funding of this project were in part supported by the Genetic Associations and Mechanisms in Oncology (GAME-ON): a NCI Cancer Post-GWAS Initiative
Footnotes
Conflict of Interest Statement The authors have no conflict of interest to declare.
References
- 1.Amos CI, Wu X, Broderick P, Gorlov IP, Gu J, Eisen T, et al. Genome-wide association scan of tag SNPs identifies a susceptibility locus for lung cancer at 15q25.1. NatGenet. 2008;40(5):616–22. doi: 10.1038/ng.109. [DOI] [PMC free article] [PubMed] [Google Scholar]
- 2.Hung RJ, McKay JD, Gaborieau V, Boffetta P, Hashibe M, Zaridze D, et al. A susceptibility locus for lung cancer maps to nicotinic acetylcholine receptor subunit genes on 15q25. Nature. 2008;452(7187):633–7. doi: 10.1038/nature06885. [DOI] [PubMed] [Google Scholar]
- 3.Thorgeirsson TE, Geller F, Sulem P, Rafnar T, Wiste A, Magnusson KP, et al. A variant associated with nicotine dependence, lung cancer and peripheral arterial disease. Nature. 2008;452(7187):638–42. doi: 10.1038/nature06846. [DOI] [PMC free article] [PubMed] [Google Scholar]
- 4.McKay JD, Hung RJ, Gaborieau V, Boffetta P, Chabrier A, Byrnes G, et al. Lung cancer susceptibility locus at 5p15.33. NatGenet. 2008;40(12):1404–6. doi: 10.1038/ng.254. [DOI] [PMC free article] [PubMed] [Google Scholar]
- 5.Wang Y, Broderick P, Webb E, Wu X, Vijayakrishnan J, Matakidou A, et al. Common 5p15.33 and 6p21.33 variants influence lung cancer risk. NatGenet. 2008;40(12):1407–9. doi: 10.1038/ng.273. [DOI] [PMC free article] [PubMed] [Google Scholar]
- 6.Freedman ML, Monteiro AN, Gayther SA, Coetzee GA, Risch A, Plass C, et al. Principles for the post-GWAS functional characterization of cancer risk loci. Nat Genet. 2011 Jun;43(6):513–8. doi: 10.1038/ng.840. [DOI] [PMC free article] [PubMed] [Google Scholar]
- 7.Parkin DM, Bray F, Ferlay J, Pisani P. Global cancer statistics, 2002. CA Cancer JClin. 2005;55(2):74–108. doi: 10.3322/canjclin.55.2.74. [DOI] [PubMed] [Google Scholar]
- 8.Coolen MW, Statham AL, Gardiner-Garden M, Clark SJ. Genomic profiling of CpG methylation and allelic specificity using quantitative high-throughput mass spectrometry: critical evaluation and improvements. Nucleic Acids Res. 2007;35(18):e119. doi: 10.1093/nar/gkm662. [DOI] [PMC free article] [PubMed] [Google Scholar]
- 9.Herman JG, Baylin SB. Gene silencing in cancer in association with promoter hypermethylation. NEnglJMed. 2003;349(21):2042–54. doi: 10.1056/NEJMra023075. [DOI] [PubMed] [Google Scholar]
- 10.He L, Hannon GJ. MicroRNAs: small RNAs with a big role in gene regulation. NatRevGenet. 2004;5(7):522–31. doi: 10.1038/nrg1379. [DOI] [PubMed] [Google Scholar]
- 11.Dai Z, Lakshmanan RR, Zhu WG, Smiraglia DJ, Rush LJ, Fruhwald MC, et al. Global methylation profiling of lung cancer identifies novel methylated genes. Neoplasia. 2001;3(4):314–23. doi: 10.1038/sj.neo.7900162. [DOI] [PMC free article] [PubMed] [Google Scholar]
- 12.Shivapurkar N, Stastny V, Xie Y, Prinsen C, Frenkel E, Czerniak B, et al. Differential methylation of a short CpG-rich sequence within exon 1 of TCF21 gene: a promising cancer biomarker assay. Cancer EpidemiolBiomarkers Prev. 2008;17(4):995–1000. doi: 10.1158/1055-9965.EPI-07-2808. [DOI] [PMC free article] [PubMed] [Google Scholar]
- 13.Belinsky SA, Nikula KJ, Palmisano WA, Michels R, Saccomanno G, Gabrielson E, et al. Aberrant methylation of p16(INK4a) is an early event in lung cancer and a potential biomarker for early diagnosis. ProcNatlAcadSciUSA. 1998;95(20):11891–6. doi: 10.1073/pnas.95.20.11891. [DOI] [PMC free article] [PubMed] [Google Scholar]
- 14.Belinsky SA, Liechty KC, Gentry FD, Wolf HJ, Rogers J, Vu K, et al. Promoter hypermethylation of multiple genes in sputum precedes lung cancer incidence in a high-risk cohort. Cancer Res. 2006;66(6):3338–44. doi: 10.1158/0008-5472.CAN-05-3408. [DOI] [PubMed] [Google Scholar]
- 15.Brena RM, Morrison C, Liyanarachchi S, Jarjoura D, Davuluri RV, Otterson GA, et al. Aberrant DNA methylation of OLIG1, a novel prognostic factor in non-small cell lung cancer. PLoSMed. 2007;4(3):e108. doi: 10.1371/journal.pmed.0040108. [DOI] [PMC free article] [PubMed] [Google Scholar]
- 16.Brena RM, Costello JF. Genome-epigenome interactions in cancer. HumMolGenet. 2007 Spec;(No 1):R96–R105. doi: 10.1093/hmg/ddm073. [DOI] [PubMed] [Google Scholar]
- 17.Esteller M, Garcia A, Martinez Palones JM, Xercavins J, Reventos J. Germ line polymorphisms in cytochrome-P450 1A1 (C4887 CYP1A1) and methylenetetrahydrofolate reductase (MTHFR) genes and endometrial cancer susceptibility. Carcinogenesis. 1997;18(12):2307–11. doi: 10.1093/carcin/18.12.2307. [DOI] [PubMed] [Google Scholar]
- 18.Shames DS, Girard L, Gao B, Sato M, Lewis CM, Shivapurkar N, et al. A genome-wide screen for promoter methylation in lung cancer identifies novel methylation markers for multiple malignancies. PLoSMed. 2006;3(12):e486. doi: 10.1371/journal.pmed.0030486. [DOI] [PMC free article] [PubMed] [Google Scholar]
- 19.Laird PW. Principles and challenges of genome-wide DNA methylation analysis. Nat Rev Genet. 2010 Feb 2;11(3):191–203. doi: 10.1038/nrg2732. [DOI] [PubMed] [Google Scholar]
- 20.Park JC, Chae YK, Son CH, Kim MS, Lee J, Ostrow K, et al. Epigenetic silencing of human T (brachyury homologue) gene in non-small-cell lung cancer. Biochem Biophys Res Commun. 2008 Jan 11;365(2):221–6. doi: 10.1016/j.bbrc.2007.10.144. [DOI] [PubMed] [Google Scholar]
- 21.Hitchins MP, Rapkins RW, Kwok CT, Srivastava S, Wong JJ, Khachigian LM, et al. Dominantly inherited constitutional epigenetic silencing of MLH1 in a cancer-affected family is linked to a single nucleotide variant within the 5'UTR. Cancer Cell. 2011 Aug 16;20(2):200–13. doi: 10.1016/j.ccr.2011.07.003. [DOI] [PubMed] [Google Scholar]
- 22.Paliwal A, Vaissiere T, Krais A, Cuenin C, Cros MP, Zaridze D, et al. Aberrant DNA Methylation Links Cancer Susceptibility Locus 15q25.1 to Apoptotic Regulation and Lung Cancer. Cancer Res. 2010 Mar 23;70(7):2779–88. doi: 10.1158/0008-5472.CAN-09-4550. [DOI] [PMC free article] [PubMed] [Google Scholar]
- 23.Renaud S, Loukinov D, Abdullaev Z, Guilleret I, Bosman FT, Lobanenkov V, et al. Dual role of DNA methylation inside and outside of CTCF-binding regions in the transcriptional regulation of the telomerase hTERT gene. Nucleic Acids Res. 2007;35(4):1245–56. doi: 10.1093/nar/gkl1125. [DOI] [PMC free article] [PubMed] [Google Scholar]
- 24.Schalkwyk LC, Meaburn EL, Smith R, Dempster EL, Jeffries AR, Davies MN, et al. Allelic skewing of DNA methylation is widespread across the genome. Am J Hum Genet. 2010 Feb 12;86(2):196–212. doi: 10.1016/j.ajhg.2010.01.014. [DOI] [PMC free article] [PubMed] [Google Scholar]
- 25.Kerkel K, Spadola A, Yuan E, Kosek J, Jiang L, Hod E, et al. Genomic surveys by methylation-sensitive SNP analysis identify sequence-dependent allele-specific DNA methylation. NatGenet. 2008;40(7):904–8. doi: 10.1038/ng.174. [DOI] [PubMed] [Google Scholar]
- 26.Zhang Y, Rohde C, Reinhardt R, Voelcker-Rehage C, Jeltsch A. Non-imprinted allele-specific DNA methylation on human autosomes. Genome Biol. 2009;10(12):R138. doi: 10.1186/gb-2009-10-12-r138. [DOI] [PMC free article] [PubMed] [Google Scholar]
- 27.Amos CI, Gorlov IP, Dong Q, Wu X, Zhang H, Lu EY, et al. Nicotinic acetylcholine receptor region on chromosome 15q25 and lung cancer risk among African Americans: a case-control study. J Natl Cancer Inst. 2011 Aug 4;102(15):1199–205. doi: 10.1093/jnci/djq232. [DOI] [PMC free article] [PubMed] [Google Scholar]
- 28.Schlaepfer IR, Hoft NR, Collins AC, Corley RP, Hewitt JK, Hopfer CJ, et al. The CHRNA5/A3/B4 gene cluster variability as an important determinant of early alcohol and tobacco initiation in young adults. Biol Psychiatry. 2008 Jun 1;63(11):1039–46. doi: 10.1016/j.biopsych.2007.10.024. [DOI] [PMC free article] [PubMed] [Google Scholar]
- 29.Stephens SH, Hoft NR, Schlaepfer IR, Young SE, Corley RC, McQueen MB, et al. Externalizing Behaviors are Associated with SNPs in the CHRNA5/CHRNA3/CHRNB4 Gene Cluster. Behav Genet. 2011 Nov 1; doi: 10.1007/s10519-011-9514-x. [DOI] [PMC free article] [PubMed] [Google Scholar]
- 30.Erlich PM, Hoffman SN, Rukstalis M, Han JJ, Chu X, LindaKao WH, et al. Nicotinic acetylcholine receptor genes on chromosome 15q25.1 are associated with nicotine and opioid dependence severity. Hum Genet. 2010 Nov;128(5):491–9. doi: 10.1007/s00439-010-0876-6. [DOI] [PubMed] [Google Scholar]
- 31.Jones PA. The DNA methylation paradox. Trends Genet. 1999 Jan;15(1):34–7. doi: 10.1016/s0168-9525(98)01636-9. [DOI] [PubMed] [Google Scholar]
- 32.Allemand E, Batsche E, Muchardt C. Splicing, transcription, and chromatin: a menage a trois. Curr Opin Genet Dev. 2008 Apr;18(2):145–51. doi: 10.1016/j.gde.2008.01.006. [DOI] [PubMed] [Google Scholar]
- 33.Luco RF, Pan Q, Tominaga K, Blencowe BJ, Pereira-Smith OM, Misteli T. Regulation of alternative splicing by histone modifications. Science. 2010 Feb 19;327(5968):996–1000. doi: 10.1126/science.1184208. [DOI] [PMC free article] [PubMed] [Google Scholar]
- 34.Chodavarapu RK, Feng S, Bernatavichute YV, Chen PY, Stroud H, Yu Y, et al. Relationship between nucleosome positioning and DNA methylation. Nature. May 30; doi: 10.1038/nature09147. [DOI] [PMC free article] [PubMed] [Google Scholar]
- 35.McCabe MT, Lee EK, Vertino PM. A multifactorial signature of DNA sequence and polycomb binding predicts aberrant CpG island methylation. Cancer Res. 2009 Jan 1;69(1):282–91. doi: 10.1158/0008-5472.CAN-08-3274. [DOI] [PMC free article] [PubMed] [Google Scholar]
- 36.Gebhard C, Benner C, Ehrich M, Schwarzfischer L, Schilling E, Klug M, et al. General transcription factor binding at CpG islands in normal cells correlates with resistance to de novo DNA methylation in cancer cells. Cancer Res. 2010 Feb 15;70(4):1398–407. doi: 10.1158/0008-5472.CAN-09-3406. [DOI] [PubMed] [Google Scholar]
- 37.Herceg Z. Epigenetic information in chromatin and cancer. Eur J Cancer. 2009 Sep;45(Suppl 1):442–4. doi: 10.1016/S0959-8049(09)70082-6. [DOI] [PubMed] [Google Scholar]
- 38.Chen SS, Raval A, Johnson AJ, Hertlein E, Liu TH, Jin VX, et al. Epigenetic changes during disease progression in a murine model of human chronic lymphocytic leukemia. Proc Natl Acad Sci U S A. 2009 Aug 11;106(32):13433–8. doi: 10.1073/pnas.0906455106. [DOI] [PMC free article] [PubMed] [Google Scholar]
- 39.Van den Berg RM, Brokx H, Vesin A, Field JK, Brambilla C, Meijer CJ, et al. Prognostic value of hTERT mRNA expression in surgical samples of lung cancer patients: the European Early Lung Cancer Project. Int J Oncol. 2010 Aug;37(2):455–61. doi: 10.3892/ijo_00000694. [DOI] [PubMed] [Google Scholar]
- 40.Schuller HM. Is cancer triggered by altered signalling of nicotinic acetylcholine receptors? Nat Rev Cancer. 2009 Mar;9(3):195–205. doi: 10.1038/nrc2590. [DOI] [PubMed] [Google Scholar]
- 41.Schuller HM, Tithof PK, Williams M, Plummer H., 3rd The tobacco-specific carcinogen 4-(methylnitrosamino)-1-(3-pyridyl)-1-butanone is a beta-adrenergic agonist and stimulates DNA synthesis in lung adenocarcinoma via beta-adrenergic receptor-mediated release of arachidonic acid. Cancer Res. 1999 Sep 15;59(18):4510–5. [PubMed] [Google Scholar]
- 42.Kawai H, Berg DK. Nicotinic acetylcholine receptors containing alpha 7 subunits on rat cortical neurons do not undergo long-lasting inactivation even when up-regulated by chronic nicotine exposure. J Neurochem. 2001 Sep;78(6):1367–78. doi: 10.1046/j.1471-4159.2001.00526.x. [DOI] [PubMed] [Google Scholar]
- 43.Joseph J, Niggemann B, Zaenker KS, Entschladen F. The neurotransmitter gamma-aminobutyric acid is an inhibitory regulator for the migration of SW 480 colon carcinoma cells. Cancer Res. 2002 Nov 15;62(22):6467–9. [PubMed] [Google Scholar]
- 44.Shiraishi K, Kohno T, Kunitoh H, Watanabe S, Goto K, Nishiwaki Y, et al. Contribution of nicotine acetylcholine receptor polymorphisms to lung cancer risk in a smoking-independent manner in the Japanese. Carcinogenesis. 2009 Jan;30(1):65–70. doi: 10.1093/carcin/bgn257. [DOI] [PubMed] [Google Scholar]
- 45.Liu Y, Liu P, Wen W, James MA, Wang Y, Bailey-Wilson JE, et al. Haplotype and cell proliferation analyses of candidate lung cancer susceptibility genes on chromosome 15q24-25.1. Cancer Res. 2009 Oct 1;69(19):7844–50. doi: 10.1158/0008-5472.CAN-09-1833. [DOI] [PMC free article] [PubMed] [Google Scholar]
- 46.Ehrich M, Nelson MR, Stanssens P, Zabeau M, Liloglou T, Xinarianos G, et al. Quantitative high-throughput analysis of DNA methylation patterns by base-specific cleavage and mass spectrometry. ProcNatlAcadSciUSA. 2005;102(44):15785–90. doi: 10.1073/pnas.0507816102. [DOI] [PMC free article] [PubMed] [Google Scholar]
- 47.Oeth P, del Mistro G, Marnellos G, Shi T, van den Boom D. Qualitative and quantitative genotyping using single base primer extension coupled with matrix-assisted laser desorption/ionization time-of-flight mass spectrometry (MassARRAY) Methods Mol Biol. 2009;578:307–43. doi: 10.1007/978-1-60327-411-1_20. [DOI] [PubMed] [Google Scholar]
- 48.Franken NA, Rodermond HM, Stap J, Haveman J, van Bree C. Clonogenic assay of cells in vitro. Nat Protoc. 2006;1(5):2315–9. doi: 10.1038/nprot.2006.339. [DOI] [PubMed] [Google Scholar]
- Improgo MR, Schlichting NA, Cortes RY, Zhao-Shea R, Tapper AR, Gardner PD. ASCL1 regulates the expression of the CHRNA5/A3/B4 lung cancer susceptibility locus. Mol Cancer Res. 2010;8:194–203. doi: 10.1158/1541-7786.MCR-09-0185. PMID:20124469. [DOI] [PMC free article] [PubMed] [Google Scholar]
Associated Data
This section collects any data citations, data availability statements, or supplementary materials included in this article.