

Abstract
Slo channels are large conductance K+ channels that display marked differences in their gating by intracellular ions. Among them, the Slo1 and C. elegans SLO-2 channels are gated by calcium (Ca2+), while mammalian Slo2 channels are activated by both sodium (Na+) and chloride (Cl−). Here, we report that SLO-2 channels, SLO-2a and a novel N-terminal variant isoform, SLO-2b, are activated by Ca2+ and voltage, but in contrast to previous reports they do not exhibit Cl− sensitivity. Most importantly, SLO-2 provides a unique case in the Slo family for sensing Ca2+ with the high-affinity Ca2+ regulatory site in the RCK1 but not the RCK2 domain, formed through interactions with residues E319 and E487 (that correspond to D362 and E535 of Slo1, respectively). The SLO-2 RCK2 domain lacks the Ca2+ bowl structure and shows minimal Ca2+ dependence. In addition, in contrast to SLO-1, SLO-2 loss-of-function mutants confer resistance to hypoxia in C. elegans. Thus, the C. elegans SLO-2 channels possess unique biophysical and functional properties.
Keywords: allosteric regulation, ion channels, membrane function, polymerase chain reaction (PCR), protein metal ion interaction, Ca2+ binding, Slo channel
Introduction
The BK (Maxi K, Slo) potassium channel family includes Slo1, Slo2 and Slo3 as its members. Among them, the Slo1 channel is gated by Ca2+,1,2 while the Slo3 channel is activated by alkalinization.3,4 Slo2 channel gating exhibits species differences; the rat Slo2.2 (rSlo2.2 or Slack) and human Slo2.1 (hSlo2.1 or Slick) channels are each activated by both Na+ and Cl−,5,6 whereas the C. elegans Slo2a (SLO-2a) has been reported to be sensitive to Ca2+ and Cl−.7 Based on structure and sequence alignment, the C-termini of Slo1 channels are organized into two functional RCK (regulation of conductance for K) domains, RCK1 and RCK2. Three distinct Ca2+ binding sites, two high-affinity and one low-affinity sites, have been reported in Slo1 C-termini based on electrophysiological experiments. One of the high-affinity Ca2+ binding sites, located in the RCK2 domain, is composed of five consecutive Asp amino acid residues and referred to as the “Ca2+ bowl.”8 The second high-affinity Ca2+ binding site located predominantly in the RCK1 domain involves residues D367 and E535.9 A crystal structure of the C-terminus of Slo1 channels in the presence of Ca2+, consistent with electrophysiological data, identified the oxygen atoms of the side-chain carboxylate groups of D895 and D897 and the main-chain carbonyl oxygens of Q889 and D892 as the Ca2+ coordination site.10 This study did not resolve a Ca2+ ion bound in the RCK1 domain, and the D367-E535 were positioned in such a way that could not possibly coordinate a Ca2+ ion. Another crystal structure of the C-terminus of Slo1, in the absence of Ca2+, localized the oxygen atoms of the RCK1 D367 in close proximity to the side chain carboxylate group of E535, consistent with experimental data implicating these residues as part of a high-affinity Ca2+ coordination site.11,12 However, this RCK1 Ca2+ binding site has not been structurally shown yet in complex with Ca2+. Similarly, this crystal structure determined in the absence of divalents localized the E374/E399 site, which has displayed low affinity to Ca2+, Mg2+ and Zn2+, on the upper plateau of the gating ring and close to the membrane. Biochemical data have raised the possibility that RCK1 may only serve to transduce Ca2+ binding into a structural rearrangement.13
Unlike the mammalian Slo1 channel, it remains unclear how C. elegans SLO-2 channels sense Ca2+. Moreover, SLO-2 channels have been reported to sense Cl− ions, like their mammalian counterparts that sense Cl− and Na+ ions. For Slo2.2 channels, we have previously reported that the side chains of D818 and H823 in the RCK2 domain are critical for Na+ coordination and channel activation.14 The Cl− coordination sites remain unknown. Loss-of-function studies of SLO-2 in C. elegans have been reported to cause hypersensitivity to hypoxia.5
Here we cloned and characterized a novel isoform of the C. elegans Slo2 channel, SLO-2b. We demonstrated that both SLO-2a and SLO-2b can be activated by Ca2+ but not by Cl−, in contrast to a previous report.7 Moreover, we provide experimental evidence that the RCK1 domain residue E319 together with E487 (corresponding to D362 and E535 of Slo1, respectively) control Ca2+ sensitivity in SLO-2b, independently of the RCK2 domain. Furthermore, we show that SLO-2 loss-of-function mutations confer resistance to hypoxia in C. elegans (contrary to the results by Yuan et al., 2003),5 while a slo-1 loss-of-function mutant does not share this phenotype. These results establish the C. elegans SLO-2 channels to be functionally more similar to the Slo1 than Slo2 mammalian channels but with important differences from Slo1 channels in the Ca2+ sensing mechanism.
Results
Cloning and expression of the slo-2b gene in Xenopus Oocytes
The slo-2 gene in C. elegans encodes two protein isoforms. The SLO-2a isoform has been previously described,7 and here we describe the SLO-2b isoform. SLO-2b is identical to SLO-2a starting from residue R40 of SLO-2a, but its N-terminal end is shorter by 22 and variant in 17 amino acids from SLO-2a. The full-length slo-2b gene encodes a 1086 amino acid protein, which is named F08B12.3c, as an alternative splice form of the C. elegans slo-2 in the Worm database. All amino acids of the SLO-2b from R18 (corresponds to R40 in SLO-2a) are identical to the SLO-2a amino acids (Fig. 1A). The slo-2b cDNA was subcloned into the vector pGEMsh and expressed in Xenopus oocytes.15 Recording from patches in the inside-out patch configuration, using a step protocol from −200mV to 200mV, we found that SLO-2b is a Ca2+- and voltage-dependent potassium channel (Fig. 1B). The macroscopic current reached the range of 2–10 nA at 60 μM Ca2+ with 200 mV depolarization in the absence of internal Cl−, a finding that differed from previously reported SLO-2a data.7 To provide estimates of the Ca2+ dependence of the SLO-2b current regulation, conductance estimates were re-plotted showing the effect of Ca2+ on conductance at different depolarized potentials (Fig. 1C). Such plots could be fit with the Hill equation with a half maximal activation of the conductance at a voltage range of over 80 mV occurring at [Ca2+] concentrations of 10.4 ~ 39.5 μM. The Hill coefficients for such relationships ranged from 1.8 to 2.4, suggesting that at least two Ca2+ ions cooperate to activate SLO-2b.

Figure 1. Amino acid sequence of the C. elegans SLO-2b channel and Ca2+ dependence of its macroscopic conductance. (A) The full amino acid sequences of SLO-2b (in red, F08B12.3c) and SLO-2a (in black, F08B 12.3b). (B) Current traces of inside-out macropatches expressing SLO-2b, bathed in the indicated Ca2+ concentrations. Pipette Solution: 140 mM KMES (potassium methanesulphonate), 20 mM KOH, 10 mM HEPES, 2 mM MgCl2 (pH7.0). The bath solution used in inside-out patch recordings contained 140 mM KMES, 20 mM KOH, 10 mM HEPES and one of the following: 5 mM EGTA (for nominally 0 Ca2+, 1 μM Ca2+), 5 mM HEDTA (for 10 μM Ca2+ solutions) or no added Ca2+ buffer for 60 μM and higher Ca2+. (C) The normalized conductance is plotted as a function of [Ca2+] for a range of command potentials. Solid lines show the best fits of the conductance at each voltage by the Hill equation. The x-axis is shown in a Log scale.
The SLO-2b channel has a similar conductance with the SLO-2a channel but is not Cl− dependent
In order to further investigate the effect of Cl− on the activation of SLO-2b channels, we performed inside-out patch recordings in symmetrical potassium solutions, either in 160 mM KMES or 160 mM KCl. Plotted normalized G-V curves in different Ca2+ concentrations established the Ca2+-dependent activation of SLO-2b under both conditions (Fig. 2A and B). However, at high Ca2+ (ranging from 10 ~ 300 μM) concentrations and at negative potentials the conductance values were much higher in 160 mM KCl than in 160 mM KMES. Thus, superficially, Cl− seemed to increase the activity of the SLO-2b channel. We tested the possibility that Cl− activated a conductance independent of SLO-2b in Xenopus oocytes by running a ramp protocol on the same patch perfused in its inner surface with either 160 mM KCl or 160 mM KMES (with 160 KMES in its outer surface) in 60 μM Ca2+. The recorded currents obtained by perfusion with 160 mM KCl (Fig. 2C, black line), following offsetting the holding current at 0 mV, showed relatively symmetrical currents (Fig. 2C, solid blue line). This was in contrast to the currents obtained in 160 mM KMES that showed outwardly rectifying currents (Fig. 2C, red line). The difference current between the two conditions (the current recorded in 160 mM KMES subtracted from that recorded in 160 mM KCl) revealed a weak inwardly rectifying current (Fig. 2C, dashed blue line). Uninjected oocytes tested in symmetrical 160 mM NaCl in 60 μM Ca2+, yielded a weak inwardly rectifying current similar to the difference current obtained in Figure 2C (Fig. 2D, blue line). Almost identical G-V relationships of the two Cl−-induced conductances (corresponding to ramp currents shown in the dashed blue trace in Fig. 2C and the solid blue trace in Fig. 2D) indicated that the greater conductance seen in KCl solutions resulted from an oocyte endogenous Ca2+ activated Cl− current that is independent of SLO-2b expression (Fig. 2E and F). Furthermore, we performed experiments to measure and compare the reversal potentials achieved by different concentrations of internal Cl− in uninjected versus SLO-2b expressing oocytes. In each Cl− concentration we tested, the measured reversal potential values were comparable in the two groups of oocytes and consistent with the predicted value based on the Nernst Equation for a Cl− selective conductance, rather than a K+ activated one (Fig. S1). Finally, we performed single channel recordings at +100 mV in 0 Ca2+ with different concentrations of Cl−. The data showed no obvious increase in Po with elevated Cl− concentrations (Fig. 2G and H). This result was in sharp contrast to similar recordings using the Slack channel as a positive control. At −100 mV the Slack Po was increased with the elevated Cl− concentration (to 30 or 100 mM Cl− in 50 mM Na+) (Fig. S2). At 1 μM Ca2+ the Po of SLO-2b in different Cl− concentrations could not be measured because large Cl− currents were evoked even in uninjected oocytes. Thus, we obtained inside-out recordings in HEK cells transfected with the cSlo2b cDNA. With 10 μM Ca2+ at 60 mV, Po was measured in different Cl− concentrations, clearly failing to show Po increases with increasing Cl− concentrations (Fig. S3A–C). However, the increased Ca2+ concentration clearly led to a higher Po of SLO-2b channels (Fig. S3A–C). These results combined suggest that the SLO-2b channel isoform is not Cl− sensitive, in marked contrast to previous results reported for SLO-2a.7

Figure 2. SLO-2b currents expressed in Xenopus oocytes do not exhibit a dependence on Cl−. (A) Normalized conductances were converted from tail currents recorded in symmetrical 160 mM KMES bathed in the indicated Ca2+ concentrations (solutions used are the same as in Fig. 1). (B) Normalized conductances were converted from tail currents recorded in symmetrical 140 mM KCl. Pipette Solution: 140 mM KCl, 20 mM KOH, 10 mM HEPES, 2 mM MgCl2, bath solution contained 140 mM KCl, 20 mM KOH, 10 mM HEPES, 5 mM EGTA with indicated Ca2+ concentrations. (C) SLO-2b current traces recorded from an inside-out patch with a ramp protocol in symmetrical K+ solutions. Pipette Solution: 140 mM KMES, 20 mM HEPES, 2 mM MgCl2. Black trace was recorded with intracellular 140 mM KCl and 60 μM Ca2+, the red trace was recorded with 140 mM KMES and 60 μM Ca2+. The solid blue trace shows that the holding current was offset. The dashed blue trace indicates the subtraction of the red trace from the solid blue trace (i.e. the Cl−-dependent current). (D) The blue trace (in the presence of Ca2+) shows a current recorded in uninjected oocytes with symmetrical 140 mM NaCl. Pipette Solution: 140 mM NaCl, 20 mM KOH, 10 mM HEPES, 2 mM MgCl2. Bath Solution: 140 mM NaCl, 20 mM KOH, 10 mM HEPES, 5 mM EGTA bathed in either 0 μM or 60 μM Ca2+. (E and F) Normalized conductances from the dashed blue traces (E) and the solid blue traces (F) that are shown in (C and D). Conductances were normalized to conductance values at −100 mV. (G) The SLO-2b single channel activity was recorded in the inside-out patch configuration with 0 Ca2+ at different Cl− concentrations. Pipette Solution: 140 mM KCl, 20 mM KOH, 10 mM HEPES, 2 mM MgCl2 (pH 7.0). Bath Solution: 140 mM KMES, 20 mM KOH, 10 mM HEPES, 0, 80 or 160 mM Choline Chloride (pH 7.0). (H) The amplitude histogram events in 0, 80 and 160 Cl− were fitted with Gaussian functions.
In order to further compare SLO-2b to SLO-2a channels, the unitary conductance of SLO-2b was determined (Fig. S4A–B). Although the activation of SLO-2b is voltage dependent, openings can be observed even at strongly hyperpolarized potentials, provided that there is high enough channel expression. The unitary conductance in symmetrical 160 mM KMeS was 107 ± 3 pS. This value is consistent with the unitary conductance reported for SLO-2a.7 The single-channel open probability at 100 mV in 60 μM Ca2+ was calculated to be 0.39 ± 0.02 by measuring and fitting single-channel open and closed events with a Gaussian function (Fig. S4C and D). Thus, since the open probability (Po) at 100 mV in 60 μM Ca2+ was about 67% of the maximal Po (Fig. 3B, blue dashed line), the maximal Po was calculated at around 58%.

Figure 3. SLO-2a is also activated by Ca2+ but is not sensitive to Cl−. (A) Step protocol and current traces recorded from an inside-out patch on oocytes that expressed SLO-2a. Solutions used were the same as in Figure 1. (B) The G-V curves of SLO-2a are plotted and fitted with a Boltzmann relation. The dashed lines show the fitted G-V curve of SLO-2b. The same Ca2+ concentrations for SLO-2a and SLO-2b are shown in the same colors. (C) Vhs in different Ca2+ concentrations for the SLO-2a and SLO-2b isoforms. The X-axis is shown in a log scale. (D) The single-channel current traces of SLO-2b recorded in the inside-out mode of patch clamp in different Cl− concentrations. (E) Amplitude histograms of single-channel activities were plotted and fitted by Gaussian functions. (F) The NPo of SLO-2a in different Cl− concentrations were summarized.
The biophysical properties of SLO-2 channels are closer related to Slo1 than Slo2 channels
Since SLO-2a and SLO-2b are regulated by Ca2+ and voltage, we used the Horrigan–Aldrich model aiming to describe the gating behavior of the SLO-2b channel (Fig. S5A). Due to the low open probability of SLO-2b in low Ca2+ concentrations, we depolarized the membrane to 300 mV. First, at very negative potentials, the SLO-2b voltage sensor is likely to be located in the resting state because the voltage dependence of the SLO-2b channels is weaker than that of the mouse Slo1 (mSlo1) channel.7 Based on the equation for P(v) (see Materials and Methods, Eqn. 3), ZL was given a value of 0.003e, suggesting lack of a voltage dependence. We thus estimated the D value based on the Log(G) vs V relationship and P(Vmax)/P(Vmin). With some constraints (see Materials and Methods) we could fit all parameters based on Eqn. 2 (Table 1). The G-V relationship of the wild-type SLO-2b could be fitted well by equation 2, indicating that the Horrigan–Aldrich model is suitable for describing the properties of SLO-2b (Fig. S5B). Furthermore, the lower value of the SLO-2b Zj, compared to that of mSlo1, is consistent with the fact that the voltage sensor of SLO-2b lacks a number of positively charged residues located on its S4 segment. The higher value of the Ca2+ dissociation constant C reflects the fact that SLO-2b is also less sensitive to Ca2+ than mSlo1. The G-V of the SLO-2a channel could also be fitted well by the Horrigan–Aldrich model although the parameters used were somewhat different from those for the SLO-2b channels (see Table 1). The activation time course was well fitted by a single exponential function over the full range of Ca2+ concentrations (Fig. S5C). The activation time course of the SLO-2b is much slower than that of the mSlo1 channel. For SLO-2b, increases in Ca2+ from 10 to 60 μM produced a 10-fold change in the activation time constant at a given potential (Fig. S5D).
Table 1. Allosteric constants comparing Slo1, Slo3 and SLO-2b activation4,18.
| Slo1 Horrigan/Aldrich | Slo3 Zhang/Lingle | SLO-2b | SLO-2a | |
|---|---|---|---|---|
| L |
9.8E-07 |
1.59E-03 |
5.29E-07 |
1.38E-03 |
| ZLe |
0.3 |
0.04 |
→0 |
→0 |
| J0 |
0.3 |
0.34 |
0.05 |
0.09 |
| Zje |
0.58 |
0.34 |
0.27 |
0.48 |
| D |
25 |
4.03 |
30.48 |
3.83 |
| Kd( μM ) |
11 |
50.16 (H+) |
48.4 |
57.8 |
| C |
8 |
0.125 |
6.57 |
3.38 |
| E |
2.4 |
0.7 |
1.37 |
5.05 |
| Vh | 152 | 80.1 | 371 | 267 |
In order to directly compare SLO-2b with SLO-2a, we also performed similar recordings with the SLO-2a isoform. SLO-2a also revealed a large Ca2+-dependent current that was insensitive to internal Cl− (Fig. 3A). The conductance versus voltage relationship (G-V) showed that SLO-2a exhibits greater activation at any given Ca2+ concentration than SLO-2b (dashed lines for SLO-2b are shown in the same color for a given Ca2+ concentration). The G-V curve of SLO-2a was left-shifted about 60 mV in each Ca2+ concentration (Fig. 3B and C). In high Ca2+ (60–300 μM), the channel remained in the open state even under highly hyperpolarized conditions (Fig. 3B). These results indicate that the N-terminus of SLO-2a can allosterically regulate channel activity. We further tested whether SLO-2a was sensitive to Cl− by measuring the single-channel activity in different Cl− concentrations. Our data clearly demonstrate that the Po of SLO-2a was insensitive to increasing Cl− concentrations (Fig. 3D–F).
The current properties of SLO-2a and SLO-2b seemed to resemble those of mSlo1 but with significant differences. Thus, we investigated whether the Ca2+ sensing mechanism of SLO-2b was similar to that of mSlo1 channels. Since there is no Ca2+ bowl in the RCK2 domain of SLO-2b, we focused on the RCK1 high-affinity Ca2+ binding site. We aligned the SLO-2b (or cslo2) amino acid sequence with that of the Ca2+-sensitive mSlo1 and the related but Ca2+-insensitive rSlo2 (or slack) (Fig. 4A). The E325 and E487 residues of SLO-2b corresponded to the D367 and E535 of mSlo1, respectively, which have been shown to greatly affect Ca2+ sensitivity (e.g., 12). We performed alanine scanning mutagenesis on and around these negatively charged residues (Fig. 4E). The E325A mutant did not substantially change the Ca2+ sensitivity of the SLO-2b channel (Fig. 4C and E). In contrast, the E319A mutant (corresponding to the D362 residue in mSlo1) largely abolished the Ca2+ sensitivity of the SLO-2b channel (Fig. 4B). The E319D, E319N and E319R mutants also decreased the Ca2+ sensitivity of SLO-2b (Fig. S6A and B). Similarly, the Ala mutant at position E487, which corresponds to the critical Ca2+-sensitive Slo1 residue E535, dramatically decreased Ca2+ sensitivity of SLO-2b channel activity (Fig. 4D). All other mutants we tested did not substantially change the Ca2+ sensitivity of the SLO-2b channel, exhibiting Vh values similar to the wild-type SLO-2b (Fig. 4E). We also tested mutants of the two positive SLO-2b residues (i.e., E319 and E487) at the corresponding SLO-2a channel positions (i.e., E340A and E508A). The results show that these mutations also largely abolished Ca2+ sensitivity in SLO-2a channels (Fig. S6C and D).

Figure 4. Identification of a Ca2+ binding site in the RCK1 domain of the SLO-2b channel. (A) Alignment of amino acid sequence around the Ca2+ binding site in RCK1 domain of SLO-2b (indicated as cslo2) channel with the mslo1 and the rat slack channel. *denotes the Ala scanned tested mutations. The E325 and E487 residues of SLO-2b correspond to the D367 and E535 residues of mslo1 respectively, which have been suggested to form a Ca2+ coordination site in Slo1. (B) The G-V curves of E319A mutant are plotted and fitted with a Boltzmann relation. (C and D) The G-V relationships of the E325A and E487A mutants are plotted and fitted with the Boltzmann equation. (E) Effect of individual and combined mutations on Ca2+ activation. The ΔVh = Vh in 0 μM [Ca2+]i-Vh in 60 μM [Ca2+].
Although the E319A and E487A mutants dramatically decreased the Ca2+ sensitivity of SLO-2b channels, neither of them alone completely abolished Ca2+ sensitivity of SLO-2b channels, nor did the double mutant (it showed a similar effect as the single mutants). We thus investigated whether the RCK2 domain of the SLO-2b channels contributed to Ca2+ sensitivity. Neutralization mutants of the non-conserved negative residues around the residue that corresponds to the Na+ regulatory site D818 in Slo2.2 were tested for potential effects on Ca2+ sensitivity. None of the D759N, D763N and the triple mutant E754N/E756N/E757N showed obvious Ca2+ sensitivity changes (Fig. S6B). We constructed a chimeric channel, in which the entire RCK2 domain of the SLO-2b channel was replaced by the RCK2 domain of the rSlo2.2 (slack) channel, to test the role of the RCK2 domain in Ca2+ sensing (Fig. 5A). This chimeric channel showed no obvious decrease in Ca2+ sensitivity. Although the Vh in 60 μM Ca2+ was right-shifted by 200 mV, the Vh in 0 Ca was also right-shifted because the G/Gmax in 0 Ca at 300 mV was only 1/3 value of the wild-type SLO-2b (Fig. 5B). Since replacement of the SLO-2b RCK2 domain right-shifted the voltage-dependent activation even in the absence of Ca2+, we concluded that it reflected a Ca2+-independent effect on channel gating. Also, the RCK2 of Slack did not confer Na+ sensitivity to the chimeric channel, even though it contained the Na+ coordination site of Slack suggesting further differences from the Slack channel. Thus, the RCK2 of SLO-2 is likely to contribute less to the Ca2+-sensitivity of the channel than the RCK1 domain. Based on the recent crystal structure of the C-terminal domain of hSlo1, we constructed a homology model of SLO-2b. This model shows the E487 and E319 residues within reasonable proximity to be able to coordinate Ca2+ (Fig. 5C).

Figure 5. The RCK2 domain contributes less to the Ca2+ sensitivity of SLO-2b than the RCK1 domain. (A) The cartoon of a chimera (CS736) between Slack (that is not Ca2+-sensitive) and SLO-2b. The RCK2 domain of SLO-2b was replaced by the RCK2 domain of Slack (blue). (B) The normalized G-V curve of the CS736 chimera shows a rightward Vh shift of about 200 mV in both 0 and 60 μM intracellular Ca2+. (C) An approximation of the Ca2+ coordination site obtained from the C-terminal homology model of SLO-2b based on the crystal structure of the Slo1 C-terminus (3NAF).
We tested if Cd2+ or Mg2+ ions could also activate the SLO-2b channel. Cd2+ has been previously shown to activate mSlo1 channels by binding to the D362 residue, which corresponds to E319A in the SLO-2b channel. However, Cd2+ could not activate the SLO-2b channel at concentrations up to 200 μM (Fig. S7), whereas it does activate the mSlo1 channel at concentrations in the range of tens of micromolar. Mg2+ activated the SLO-2b channel but less potently than mSlo1 (Fig. 6A). Using a ramp protocol from −100 mV to +100 mV, we obtained the Mg2+ dose-dependent activation curve. At 100 mV, the current level with 100 mM Mg2+ in the bath was only 10% of the current level at 300 μM Ca2+ (Fig. 6A). Similarly, Mg2+ dose-dependent activity could also be observed with increasing voltage steps in the range from 60–200 mV. This activity was higher in bath solutions including 10 mM Mg2+ compared to 1 mM Mg2+ but was much lower than at 300 μM Ca2+ (Fig. 6C1–3). The G-V relationship of the Mg2+ activation for SLO-2b was plotted and fitted with the Boltzmann equation (Fig. 6B), showing an obvious left shift with increasing Mg2+ concentrations. Next, we determined how the Ca2+ binding site influences Mg2+ sensitivity by measuring the activity of the E487A mutant. Since the G-V relationship was largely out of the measurable range, it appears that the E487A only right-shifted the G-V relationship but did not abolish Mg2+ sensitivity (compare Fig. 6B and D). These results indicate that G-V relationships could be right-shifted by the E487A mutant but that the Mg2+ sensitivity was maintained. Considering that the E487A also right-shifted the G-V curve at 0 μM Ca2+, the possibility that an independent Mg2+ binding site exists cannot be excluded.

Figure 6. Mg2+ may use an independent binding site to activate SLO-2b with a weaker potency than Ca2+. (A) Representative traces with intracellular 300 μM Ca2+ or indicated concentration of Mg2+ in a ramp protocol from −100 mV to +100 mV. (B) Mean G-V relationship of Mg2+ activation of SLO-2b current summarized from records obtained from the wild-type SLO-2b (C) Representative traces with intracellular 300 μM Ca2+ or indicated concentration of Mg2+ in a voltage step from −140 mV to +200 mV (C1-C3). (D) Mean G-V relationship of Mg2+ activation of SLO-2b current summarized from records in E487A mutations.
SLO-2 confers sensitivity to hypoxia and functions differently from SLO-1 in C. elegans
SLO-2 channels have previously been reported to have a role in the C. elegans response to hypoxia.5 In this report, worms lacking a functional SLO-2 channel were more sensitive to hypoxia-induced lethality than wild type. Given the similarities of SLO-2 channels to mSlo1, we tested the effects of loss of function in both slo-2 and slo-1 on sensitivity to hypoxia in C. elegans. To our surprise, when we tested slo-2 mutant animals in three different paradigms of hypoxia, we found that they were significantly resistant to hypoxia, rather than sensitive. slo-1; slo-2 double mutant animals were also resistant to hypoxia. In contrast, slo-1 mutants were not different from wild-type strains.
There are several methods for inducing hypoxic responses in the worm, and we used three different approaches to induce hypoxia. First, we incubated the animals with cobalt chloride, which induces expression of the hypoxia inducible transcription factor, HIF-116,17 (Fig. 7A). Second, we incubated worms in a bio-bag environmental chamber that uses an oxygen scavenger to remove oxygen from the enclosed environment, which generates O2 levels well less than 1%, 18,19 as tested by a chemical indicator enclosed in the bag (Fig. 7B). Third, we used a hypoxia chamber similar to the one used previously5,20 (Fig. 7C). In this chamber, oxygen in the atmosphere is replaced by a gas that is pumped in, and oxygen levels are monitored by a sensor. In our experiments, we maintained the oxygen at 0.1%. Unlike the previous study that used a gas mixture of 5% CO2, 10% H2 and 85% N2, we used 100% N2 gas, as 10% H2 is flammable. Additionally our experiments were performed at 25 °C rather than the 27 °C used in the previous study.5 Regardless of the method used to cause or mimic hypoxia, we found that slo-2 mutant animals were significantly resistant to hypoxia, whereas slo-1 mutant animals were not. Loss of function of the SLO-2 channel improved survival under hypoxic conditions, strongly suggesting that slo-2 confers sensitivity to hypoxia.

Figure 7.slo-2 mutant animals are resistant to severe hypoxia-induced death. Hypoxic responses were induced in three different paradigms. Severe hypoxia is defined as < 0.3% oxygen. (A) Cobalt chloride was used to induce hypoxia-inducible factor (HIF-1) signaling without altering atmospheric oxygen levels (n = 6). (B) Animals were exposed to <1% oxygen for 8 h at 27 °C in a Bio-bag environmental chamber (n = 5), and (C) Animals were exposed to 0.1% oxygen for 16 h in a hypoxia chamber (n = 6). In each case, slo-2(nf100) and slo-2(nf101) mutant animals are significantly resistant to hypoxia induced death relative to wild-type N2. Loss of slo-1 did not confer resistance to hypoxia-induced death. slo-1(js379);slo-2(nf100) and slo-1(js379);slo-2(nf101) double mutant animals are significantly resistant to hypoxia induced death compared with N2 or the slo-1(js379) single mutant. Error bars are s.e.m. For indicated comparisons: *P < 0.05; **P < 0.01; ***P < 0.001.
Discussion
We have shown that the C. elegans SLO-2b and SLO-2a isoforms are both voltage and Ca2+-dependent potassium channels. Neither of these SLO-2 channels exhibits Cl− sensitivity, as previously reported for the SLO-2a channel. Thus, the N-terminal amino acid differences could not account for this difference, although the N-terminus of SLO-2 allosterically led to a shift in the G-V relationship. Our results suggest that contamination by an endogenous Cl− current present in Xenopus oocytes is likely to have misled the SLO-2a work.7 Endogenous Cl− currents in oocytes have been reported to arise from several Cl− channels that can be activated by Ca2+.21-24
The G-V relationship of the SLO-2b channel could be described well by the Horrigan–Aldrich model, which was developed for describing gating properties of the Slo1 channel. Recently, one crystal structure of the gating ring from the human BK channel in the presence of 50 mM [Ca2+]i (PDB ID code: 3MT5) revealed that one Ca2+ ion was coordinated by residues in the Ca2+ bowl of the RCK2 domain of the Ca2+-bound crystal structure, whereas no Ca2+ was observed in this crystal at the putative RCK1 D367/D362 site.10 Thus, the Ca2+ binding site on RCK1 domains is not supported yet by X-ray structural evidence. It has been proposed that neutralization of the D362A/D367A residues prevents Ca2+-induced conformational transitions rather than Ca2+ binding.13 Alternatively, a recent model from another crystal structure in the absence of Ca2+ has proposed that D367 and E535 form a Ca2+ coordination site (PDB ID code: 3NAF).12 The role of D362/D367 site is also involved in regulating Cd2+ sensitivity.2 Interestingly, in the SLO-2b channel, mutation of the E319 residue that corresponds to D362 in mSlo1 did change Ca2+ sensitivity, in contrast to mutation in the E325 residue that corresponds to D367 in mSlo1 that did not. The E319 site did not sense Cd2+. Although it is possible that the change in apparent affinities we have measured results from simply disrupting the transduction of a process regulated by a Ca2+-binding site located elsewhere, it is equally possible that in SLO-2b E319 is part of a direct Ca2+ coordination site. Our homology model of SLO-2b based on hSlo1 as a template localizes E319 adjacent to E487, which corresponds to E535 in Slo1. Our results with the SLO-2b RCK1 domain E319/E487 Ca2+ coordination site support the model proposed for the Slo1 channel corresponding to E535 as being part of the coordination and exchanging the D367 with an equivalent contribution by the D362, which corresponds to E319 in the SLO-2b channel.
Although the SLO-2 amino acid sequence shows greater homology to the Slack channel (40.8% identity) than to the mSlo1 channel (16.3%), the electrophysiological properties of SLO-2 resemble Slo1 more than Slo2 channels. How the mammalian Slo2 channel evolved to sense Na+ instead of Ca2+ is an intriguing problem that remains to be addressed.
Since the Kd of the Ca2+ dependence of SLO-2b and SLO-2a (30 ~ 58 μM) is significantly higher than mSlo1 (~19 μM) channels and much above the normal physiological range of Ca2+ concentrations, it is intriguing to consider how these channels are activated under normal physiological conditions. Clusters of mSlo1 with Ca2+ channels have been widely reported and local concentrations of free Ca2+ in chromaffin cells have been reported to elevate Ca2+ to 60 μM.25 In C. elegans, SLO-2 channels may utilize a similar strategy to sense local Ca2+ levels. A recent report points out that SLO-2 channels are co-localized and activated by the Ca2+ channel EGL-19 and play a major role in determining the muscle action potential.26
Finally, SLO-2 channels are widely expressed in muscle cells and the cell body of neurons, while the SLO-1 channels are mainly expressed in presynaptic terminals,7,27 suggesting distinct functions for these SLO channels. The role of potassium channels in hypoxia has been widely studied. The overall dependence of the hypoxic state on potassium channels depends on the type of K+ channels and the location of their expression as well as the experimental model used. Excessive K+ efflux and intracellular K+ depletion had been clearly linked to apoptosis in neurons and other cells during hypoxia.28-30 Furthermore, both blockers and overexpression of dominant-negative forms of potassium channel subunits in neurons contribute to attenuation of hypoxia-induced apoptosis.30-32 Consistently, loss of SLO-2 channel function conferred resistance to hypoxia in C. elegans, in contrast to previously described effects.5 This role for loss-of-function of the SLO-2 channel is consistent with the electrophysiological properties and expression pattern of SLO-2 compared to SLO-1 channels, loss-of-function of which failed to show this phenotype. SLO-2 channels have been shown to be involved in mitochondrial potassium transport leading to protection in anesthetic preconditioning, but K channel contributions to hypoxic preconditioning remain unclear.33,34 Taken together, our results provide a revised view of the biophysical characteristics of SLO-2 channels and their relationship to the hypoxic phenotype in C. elegans.
Materials and Methods
Constructs and mutations
Genomic and cDNA sequences of slo-2b were obtained from the worm database (www.wormbase.org). The ESTs (1522e1, 1193) of C. elegans slo-2 were gifts from Professor Yuji Kohara at the National Institute of Genetics, Mishima, Japan. The 5' 1349 bp of the cDNA sequence of slo-2b was obtained by PCR from EST clone 1522e1. The primers were flanked with BamHI and XmaI restriction endonuclease sites, at 5' and 3' respectively. This 5' fragment was inserted into the Xenopus oocyte expression vector pGEM-sh,14 using the BamHI and XmaI sites. The nucleotides 1350-1356 of the slo-2b cDNA represent an endogenous XmaI site. A 3' cDNA fragment was isolated by restriction endonuclease digestion from the EST clone 1193 in the pME18S-FL3 vector, using XmaI and XhoI. This fragment was inserted into the 5' fragment-containing pGEM-sh construct that had been digested with XmaI and XhoI, so that the 5' and 3' cDNA fragments were joined together at the XmaI site. The N-terminal 450bp cDNA encoding sequence of slo-2a was synthesized by the GenScripts Company and flanked by BamHI and NgoMIV endonuclease sites. A NgoMIV endonuclease site mutation was made in the corresponding sequence of slo-2b. Then the corresponding N-terminus of slo-2b constructs was cut from the BamHI/NgoMIV site and replaced by a synthesized N-terminus of slo-2a. Finally, the inserted NgoMIV endonuclease site was deleted by mutagenesis.
The CS736 chimeras were made by replacing the RCK2 domain of slo-2b from amino acid 736 with the Slack RCK2 domain from amino acid 803 to the end of the protein. Mutants were made following previously published procedures.35
Oocyte isolation and culture
Stage VI oocytes from female Xenopus laevis frogs were harvested and used for cRNA injection, as previously described.36,37 Each oocyte was injected with 50 nl of ~1 μg/μl concentration of cRNA. Currents were recorded within 3–5 d.
HEK293 cell culture and transfection
The HEK293 cells were cultured on coverslips that sinked in the diameter 36 mm dish in DMEM culture medium. The SLO-2b were cloned into pcDNA3 vector and transfected 24–48h before recording by following the Invitrogen lipofectamine tranfection protocol.
Electrophysiology
Currents were recorded in the inside-out patch configuration, using an EPC 9 amplifier (HEKA) and the Pulse fit program (HEKA). Single-channel analysis followed previously described procedures.14 Each series of G/V curves were obtained from the same patch, and conductances were normalized to estimates of maximal fitted conductance obtained with 60 μM Ca2+. Individual G/V curves were fitted with a Boltzmann function of the following form:
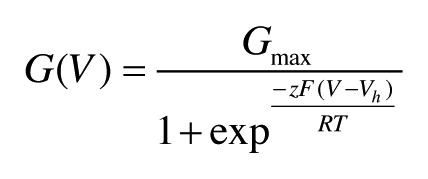 |
where Gmax is the fitted value for maximal conductance at a given Ca2+ concentration. Vh is the voltage of half maximal activation of conductance, and z reflects the net charge moved across the membrane during the transition from the closed to the open state. ΔVh = Vh at 0 -100 μM [Ca2+]i
Allosteric models of activation of BK channels
The Ca2+ and voltage dependence of activation of the SLO-2b channels and SLO-2a could be reasonably well described by the Horrigan–Aldrich model that was developed for Slo1 channels.38 For the scheme used here (Fig. S5A), we assumed that the effects of Ca2+ involved a single Ca2+-dependent equilibrium occurring with each of the four subunits. The system was described by three relatively independent equilibrium constants: L indicates the intrinsic equilibrium constant for the close-open transition; J defines the equilibrium constant for the voltage sensor moving between resting and activation states; K defines the equilibrium constant for interaction with Ca2+. In turn, each process was allosterically coupled to the other two processes by coupling constants. D defines the coupling between voltage sensor movement and channel opening; C defines the coupling between Ca2+ binding and channel opening; E defines the coupling between Ca2+ and voltage sensor movement. The open probability was determined by the equation:
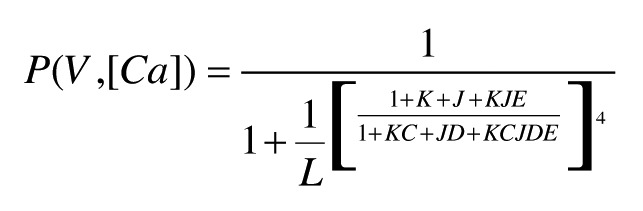 |
where L = L(0)*exp(ZLV/kT), J = J(0)*exp(ZJV/kT), K = [Ca2+]/Kd, where Kd is the dissociation constant of free Ca2+. Hence, at very negative potentials lower than −100 mV and at all Ca2+ concentrations, the normalized conductance is < 0.01, (1 + K)4 >> L(1 + KC)4. The equation that is used to define ZL can be simplified as:
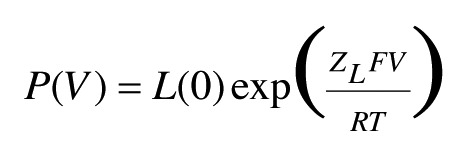 |
Detailed information regarding the Horrigan–Aldrich model has been previously described.4,38 Some parameters were constrained (0 < L<1, 0 < ZL<10, 0 < D < 100, 0 < C <100) when the G-V was fitted with Eqn. 2.
C. elegans methods
Nematode Culture and Strains. C. elegans were maintained using standard methods.39 Strains used were N2 (var. Bristol), slo-1(js379), slo-2(nf100), slo-2(nf101), slo-1(js379);slo-2(nf100) and slo-1(js379);slo-2(nf101).
Assays of severe hypoxia
Cobalt Chloride Treatment: Healthy age matched first day adult animals were used. 500 μL of filter sterilized 100 mM cobalt chloride (Acros Organics) was added to 3-d-old Nematode Growth Media (NGM) plates. Plates were seeded with OP50 bacteria 24 h before addition of cobalt chloride. Fifty animals were incubated on plates for 16 h at 20 °C (for each 50 worm experiment n = 1). Worms were moved to new NGM plates and scored for survival after 24 h. A 1-way analysis of variance (ANOVA) was performed with a significance value of p < 0.05 with Bonferroni’s post hoc test comparing each mutant strain to N2.
Environmental Chamber: Healthy age matched first day adult animals were used. Fifty animals on NGM plates seeded with OP50 were placed in Bio-Bag Environmental Chamber Type A (Becton, Dickinson and Company). Animals were exposed to oxygen levels of less than 1% for 8 h at 27 °C, then removed from the bag and moved to new NGM plates and incubated in room atmosphere at 20 °C. Survival was scored after 24 h. A 1-way analysis of variance (ANOVA) was performed with a significance value of p < 0.05 with Bonferroni’s post hoc test comparing each mutant strain to N2.
Hypoxic Cabinet: Healthy age matched second day adult animals were used. Animals were washed with 1 mL of M9 buffer into 1.5 mL polypropylene tubes. The M9 was replaced three times with 1 mL of M9 that had been bubbled for 30 min with 100% nitrogen gas. Worms were incubated in a Hypoxic Cabinet with an oxygen controller (Coy Laboratory Products) in a final volume of 100 μL of M9 at an oxygen level of 0.1% for 16 h at 25 °C. Animals were removed from the chamber and moved to new NGM plates and incubated in room atmosphere at 20 °C. Survival was scored 24 h after incubation. A 1-way analysis of variance (ANOVA) was performed with a significance value of p < 0.05 with Bonferroni’s post hoc test comparing each mutant strain to N2.
Reagents
KMES, potassium methanesulphonate; KOH, potassium hydroxide; HEPES, 4-(2-hydroxyethyl)-1-piperazineethanesulfonic acid; MgCl2 magnesium chloride; EGTA, ethylene glycol tetraacetic acid; HEDTA, N-(hydroxyethyl)-ethylenediaminetriacetic acid were all purchased from Sigma-Aldrich.
Supplementary Material
Acknowledgments
Z.Z. was supported by American Heart Association Grant 09SDG2290002. D.E.L. was supported by National Institutes of Health Grants R01HL059949 and ROH1HL090882. J.T.A, A.G.D. and J.C.B were supported by RO1AA016837 to J.C.B. We are thankful to Heikki Vaananen and Sophia Gruszecki for isolation of Xenopus oocytes, Professor Yuji Kohara for EST clones, Keith Baker and Divya Padmanabha for advice and use of their hypoxia chamber, Leon Avery and the Caenorhabditis Genetics Center for C. elegans strains and Christopher Lingle, Leon Avery and members of the Logothetis laboratory for helpful discussions and comments on the manuscript and throughout this project. Correspondence should be addressed to Zhe Zhang or Diomedes E. Logothetis, Department of Physiology and Biophysics, Virginia Commonwealth University School of Medicine, Richmond, VA 23298-0551. Email: zzhang5@vcu.edu or delogothetis@vcu.edu
Disclosure of Potential Conflicts of Interest
No potential conflicts of interest were disclosed.
Footnotes
Previously published online: www.landesbioscience.com/journals/channels/article/24492
References
- 1.Butler A, Tsunoda S, McCobb DP, Wei A, Salkoff L. mSlo, a complex mouse gene encoding “maxi” calcium-activated potassium channels. Science. 1993;261:221–4. doi: 10.1126/science.7687074. [DOI] [PubMed] [Google Scholar]
- 2.Zeng XH, Xia XM, Lingle CJ. Divalent cation sensitivity of BK channel activation supports the existence of three distinct binding sites. J Gen Physiol. 2005;125:273–86. doi: 10.1085/jgp.200409239. [DOI] [PMC free article] [PubMed] [Google Scholar]
- 3.Schreiber M, Wei A, Yuan A, Gaut J, Saito M, Salkoff L. Slo3, a novel pH-sensitive K+ channel from mammalian spermatocytes. J Biol Chem. 1998;273:3509–16. doi: 10.1074/jbc.273.6.3509. [DOI] [PubMed] [Google Scholar]
- 4.Zhang X, Zeng X, Lingle CJ. Slo3 K+ channels: voltage and pH dependence of macroscopic currents. J Gen Physiol. 2006;128:317–36. doi: 10.1085/jgp.200609552. [DOI] [PMC free article] [PubMed] [Google Scholar]
- 5.Yuan A, Santi CM, Wei A, Wang ZW, Pollak K, Nonet M, et al. The sodium-activated potassium channel is encoded by a member of the Slo gene family. Neuron. 2003;37:765–73. doi: 10.1016/S0896-6273(03)00096-5. [DOI] [PubMed] [Google Scholar]
- 6.Bhattacharjee A, Kaczmarek LK. For K+ channels, Na+ is the new Ca2+ Trends Neurosci. 2005;28:422–8. doi: 10.1016/j.tins.2005.06.003. [DOI] [PubMed] [Google Scholar]
- 7.Yuan A, Dourado M, Butler A, Walton N, Wei A, Salkoff L. SLO-2, a K+ channel with an unusual Cl- dependence. Nat Neurosci. 2000;3:771–9. doi: 10.1038/77670. [DOI] [PubMed] [Google Scholar]
- 8.Schreiber M, Salkoff L. A novel calcium-sensing domain in the BK channel. Biophys J. 1997;73:1355–63. doi: 10.1016/S0006-3495(97)78168-2. [DOI] [PMC free article] [PubMed] [Google Scholar]
- 9.Xia XM, Zeng X, Lingle CJ. Multiple regulatory sites in large-conductance calcium-activated potassium channels. Nature. 2002;418:880–4. doi: 10.1038/nature00956. [DOI] [PubMed] [Google Scholar]
- 10.Yuan P, Leonetti MD, Pico AR, Hsiung Y, MacKinnon R. Structure of the human BK channel Ca2+-activation apparatus at 3.0 A resolution. Science. 2010;329:182–6. doi: 10.1126/science.1190414. [DOI] [PMC free article] [PubMed] [Google Scholar]
- 11.Wu Y, Yang Y, Ye S, Jiang Y. Structure of the gating ring from the human large-conductance Ca(2+)-gated K(+) channel. Nature. 2010;466:393–7. doi: 10.1038/nature09252. [DOI] [PMC free article] [PubMed] [Google Scholar]
- 12.Zhang G, Huang SY, Yang J, Shi J, Yang X, Moller A, et al. Ion sensing in the RCK1 domain of BK channels. Proc Natl Acad Sci U S A. 2010;107:18700–5. doi: 10.1073/pnas.1010124107. [DOI] [PMC free article] [PubMed] [Google Scholar]
- 13.Yusifov T, Javaherian AD, Pantazis A, Gandhi CS, Olcese R. The RCK1 domain of the human BKCa channel transduces Ca2+ binding into structural rearrangements. J Gen Physiol. 2010;136:189–202. doi: 10.1085/jgp.200910374. [DOI] [PMC free article] [PubMed] [Google Scholar]
- 14.Zhang Z, Rosenhouse-Dantsker A, Tang QY, Noskov S, Logothetis DE. The RCK2 domain uses a coordination site present in Kir channels to confer sodium sensitivity to Slo2.2 channels. J Neurosci. 2010;30:7554–62. doi: 10.1523/JNEUROSCI.0525-10.2010. [DOI] [PMC free article] [PubMed] [Google Scholar]
- 15.Tang QY, Zhang Z, Xia J, Ren D, Logothetis DE. Phosphatidylinositol 4,5-bisphosphate activates Slo3 currents and its hydrolysis underlies the epidermal growth factor-induced current inhibition. J Biol Chem. 2010;285:19259–66. doi: 10.1074/jbc.M109.100156. [DOI] [PMC free article] [PubMed] [Google Scholar]
- 16.Ho VT, Bunn HF. Effects of transition metals on the expression of the erythropoietin gene: further evidence that the oxygen sensor is a heme protein. Biochem Biophys Res Commun. 1996;223:175–80. doi: 10.1006/bbrc.1996.0865. [DOI] [PubMed] [Google Scholar]
- 17.Epstein AC, Gleadle JM, McNeill LA, Hewitson KS, O’Rourke J, Mole DR, et al. C. elegans EGL-9 and mammalian homologs define a family of dioxygenases that regulate HIF by prolyl hydroxylation. Cell. 2001;107:43–54. doi: 10.1016/S0092-8674(01)00507-4. [DOI] [PubMed] [Google Scholar]
- 18.Hajeri VA, Trejo J, Padilla PA. Characterization of sub-nuclear changes in Caenorhabditis elegans embryos exposed to brief, intermediate and long-term anoxia to analyze anoxia-induced cell cycle arrest. BMC Cell Biol. 2005;6:47. doi: 10.1186/1471-2121-6-47. [DOI] [PMC free article] [PubMed] [Google Scholar]
- 19.Padilla PA, Nystul TG, Zager RA, Johnson AC, Roth MB. Dephosphorylation of cell cycle-regulated proteins correlates with anoxia-induced suspended animation in Caenorhabditis elegans. Mol Biol Cell. 2002;13:1473–83. doi: 10.1091/mbc.01-12-0594. [DOI] [PMC free article] [PubMed] [Google Scholar]
- 20.Park EC, Ghose P, Shao Z, Ye Q, Kang L, Xu XZ, et al. Hypoxia regulates glutamate receptor trafficking through an HIF-independent mechanism. EMBO J. 2012;31:1379–93. doi: 10.1038/emboj.2011.499. [DOI] [PMC free article] [PubMed] [Google Scholar]
- 21.Huang F, Rock JR, Harfe BD, Cheng T, Huang X, Jan YN, et al. Studies on expression and function of the TMEM16A calcium-activated chloride channel. Proc Natl Acad Sci U S A. 2009;106:21413–8. doi: 10.1073/pnas.0911935106. [DOI] [PMC free article] [PubMed] [Google Scholar]
- 22.Schroeder BC, Cheng T, Jan YN, Jan LY. Expression cloning of TMEM16A as a calcium-activated chloride channel subunit. Cell. 2008;134:1019–29. doi: 10.1016/j.cell.2008.09.003. [DOI] [PMC free article] [PubMed] [Google Scholar]
- 23.Tsunenari T, Sun H, Williams J, Cahill H, Smallwood P, Yau KW, et al. Structure-function analysis of the bestrophin family of anion channels. J Biol Chem. 2003;278:41114–25. doi: 10.1074/jbc.M306150200. [DOI] [PMC free article] [PubMed] [Google Scholar]
- 24.Qu Z, Wei RW, Mann W, Hartzell HC. Two bestrophins cloned from Xenopus laevis oocytes express Ca(2+)-activated Cl(-) currents. J Biol Chem. 2003;278:49563–72. doi: 10.1074/jbc.M308414200. [DOI] [PubMed] [Google Scholar]
- 25.Prakriya M, Solaro CR, Lingle CJ. [Ca2+]i elevations detected by BK channels during Ca2+ influx and muscarine-mediated release of Ca2+ from intracellular stores in rat chromaffin cells. J Neurosci. 1996;16:4344–59. doi: 10.1523/JNEUROSCI.16-14-04344.1996. [DOI] [PMC free article] [PubMed] [Google Scholar]
- 26.Liu P, Ge Q, Chen B, Salkoff L, Kotlikoff MI, Wang ZW. Genetic dissection of ion currents underlying all-or-none action potentials in C. elegans body-wall muscle cells. J Physiol. 2011;589:101–17. doi: 10.1113/jphysiol.2010.200683. [DOI] [PMC free article] [PubMed] [Google Scholar]
- 27.Wang ZW, Saifee O, Nonet ML, Salkoff L. SLO-1 potassium channels control quantal content of neurotransmitter release at the C. elegans neuromuscular junction. Neuron. 2001;32:867–81. doi: 10.1016/S0896-6273(01)00522-0. [DOI] [PubMed] [Google Scholar]
- 28.Linnik MD, Zobrist RH, Hatfield MD. Evidence supporting a role for programmed cell death in focal cerebral ischemia in rats. Stroke. 1993;24:2002–8, discussion 2008-9. doi: 10.1161/01.STR.24.12.2002. [DOI] [PubMed] [Google Scholar]
- 29.Reeves WB, Shah SV. Activation of potassium channels contributes to hypoxic injury in proximal tubules. J Clin Invest. 1994;94:2289–94. doi: 10.1172/JCI117592. [DOI] [PMC free article] [PubMed] [Google Scholar]
- 30.Yu SP, Yeh CH, Sensi SL, Gwag BJ, Canzoniero LM, Farhangrazi ZS, et al. Mediation of neuronal apoptosis by enhancement of outward potassium current. Science. 1997;278:114–7. doi: 10.1126/science.278.5335.114. [DOI] [PubMed] [Google Scholar]
- 31.Pal S, Hartnett KA, Nerbonne JM, Levitan ES, Aizenman E. Mediation of neuronal apoptosis by Kv2.1-encoded potassium channels. J Neurosci. 2003;23:4798–802. doi: 10.1523/JNEUROSCI.23-12-04798.2003. [DOI] [PMC free article] [PubMed] [Google Scholar]
- 32.Wei L, Yu SP, Gottron F, Snider BJ, Zipfel GJ, Choi DW. Potassium channel blockers attenuate hypoxia- and ischemia-induced neuronal death in vitro and in vivo. Stroke. 2003;34:1281–6. doi: 10.1161/01.STR.0000065828.18661.FE. [DOI] [PubMed] [Google Scholar]
- 33.Wojtovich AP, Sherman TA, Nadtochiy SM, Urciuoli WR, Brookes PS, Nehrke K. SLO-2 is cytoprotective and contributes to mitochondrial potassium transport. PLoS One. 2011;6:e28287. doi: 10.1371/journal.pone.0028287. [DOI] [PMC free article] [PubMed] [Google Scholar]
- 34.Wojtovich AP, DiStefano P, Sherman T, Brookes PS, Nehrke K. Mitochondrial ATP-sensitive potassium channel activity and hypoxic preconditioning are independent of an inwardly rectifying potassium channel subunit in Caenorhabditis elegans. FEBS Lett. 2012;586:428–34. doi: 10.1016/j.febslet.2012.01.021. [DOI] [PMC free article] [PubMed] [Google Scholar]
- 35.Zhang Z, Zhou Y, Ding JP, Xia XM, Lingle CJ. A limited access compartment between the pore domain and cytosolic domain of the BK channel. J Neurosci. 2006;26:11833–43. doi: 10.1523/JNEUROSCI.3812-06.2006. [DOI] [PMC free article] [PubMed] [Google Scholar]
- 36.Zhang Z, Zeng XH, Xia XM, Lingle CJ. N-terminal inactivation domains of beta subunits are protected from trypsin digestion by binding within the antechamber of BK channels. J Gen Physiol. 2009;133:263–82. doi: 10.1085/jgp.200810079. [DOI] [PMC free article] [PubMed] [Google Scholar]
- 37.Jin T, Peng L, Mirshahi T, Rohacs T, Chan KW, Sanchez R, et al. The (beta)gamma subunits of G proteins gate a K(+) channel by pivoted bending of a transmembrane segment. Mol Cell. 2002;10:469–81. doi: 10.1016/S1097-2765(02)00659-7. [DOI] [PubMed] [Google Scholar]
- 38.Horrigan FT, Aldrich RW. Coupling between voltage sensor activation, Ca2+ binding and channel opening in large conductance (BK) potassium channels. J Gen Physiol. 2002;120:267–305. doi: 10.1085/jgp.20028605. [DOI] [PMC free article] [PubMed] [Google Scholar]
- 39.Brenner S. The genetics of Caenorhabditis elegans. Genetics. 1974;77:71–94. doi: 10.1093/genetics/77.1.71. [DOI] [PMC free article] [PubMed] [Google Scholar]
Associated Data
This section collects any data citations, data availability statements, or supplementary materials included in this article.