

Abstract
The pulvinar complex of prosimian primates is not as architectonically differentiated as that of anthropoid primates. Thus, the functional subdivisions of the complex have been more difficult to determine. In the present study, we related patterns of connections of cortical visual areas (primary visual area, V1; secondary visual area, V2; and middle temporal visual area, MT) as well as the superior colliculus of the visual midbrain, with subdivisions of the pulvinar complex of prosimian galagos (Otolemur garnetti) that were revealed in brain sections processed for cell bodies (Nissl), cytochrome oxidase, or myelin. As in other primates, the architectonic methods allowed us to distinguish the lateral pulvinar (PL) and inferior pulvinar (PI) as major divisions of the visual pulvinar. The connection patterns further allowed us to divide PI into a large central nucleus (PIc), a medial nucleus (PIm), and a posterior nucleus (PIp). Both PL and PIc have separate topographic patterns of connections with V1 and V2. A third, posterior division of PI, PIp, does not appear to project to V1 and V2 and is further distinguished by receiving inputs from the superior colliculus. All these subdivisions of PI project to MT. The evidence suggests that PL of galagos contains a single, large nucleus, as in monkeys, and that PI may have only three subdivisions, rather than the four subdivisions of monkeys. In addition, the cortical projections of PI nuclei are more widespread than those in monkeys. Thus, the pulvinar nuclei in prosimian primates and anthropoid primates have evolved along somewhat different paths.
Indexing terms: superior colliculus, visual cortex, middle temporal area, area 17, area 18, primate evolution, thalamus
The present study focuses on determining the cortical and tectal connections with subdivisions of the visual pulvinar in prosimian galagos. Traditionally, the pulvinar complex of primates has been divided into inferior (PI), lateral (PL), and medial (PM) regions (Stepniewska and Kaas, 1997; Stepniewska et al., 1999; Kaas and Lyon, 2007; Jones, 2007). The inferior pulvinar, once thought to be a single nucleus, has been divided into four nuclei in monkeys that can be distinguished by histochemical differences and patterns of projections to areas of visual cortex (for review see Kaas and Lyon, 2007). In monkeys, the most lateral part of PI, the large central lateral nucleus (PIcl), projects to primary and secondary visual areas, V1 and V2, as well as the dorsolateral visual area (DL or V4), whereas a smaller, medial nucleus (PIm) projects to the middle temporal visual area, MT. The posterior (PIp) and central medial (PIcm) nuclei receive inputs from the superior colliculus and project to areas of the dorsal stream of visual processing that are connected with MT. The lateral pulvinar largely consists of a large ventral lateral nucleus (PLvl) that projects to V1, V2, and DL(V4). A dorsomedial nucleus (PLdm) is sometimes distinguished as part of the lateral pulvinar, but its connections with prefrontal and inferior parietal cortex suggest that it more appropriately should be considered part of the medial pulvinar, which has widespread connections that are not strictly visual. An anterior or oral pulvinar is associated with somatosensory cortex and clearly is not part of the visual pulvinar. The visual pulvinar (also called the lateral posterior nucleus or the lateral posterior pulvinar complex) appears to be organized somewhat differently in carnivores, rodents (Jones, 2007), and even tree shrews (Lyon et al., 2003), and common (homologous) nuclei have been difficult to identify.
Understanding of the visual pulvinar organization in primates has largely been based on studies of New and Old World monkeys (see e.g., Allman et al., 1972; Gattass et al., 1978; Lin and Kaas, 1979; Bender, 1981; Ungerleider et al., 1983; Boussaoud et al., 1992; Cusick et al., 1993; Gutierrez et al., 1995; Gutierrez and Cusick, 1997; Stepniewska and Kaas, 1997; Stepniewska et al., 1999, 2000; Gray et al., 1999; Adams et al., 2000; O’Brien et al., 2001; Shipp, 2001; Weller et al., 2002; Cola et al., 2005), where major similarities in architectonic subdivisions and connection patterns are evident. However, little is known about the organization of the visual pulvinar in other primates. Broader comparisons across mammalian taxa might result in a fuller understanding of common and variable features of visual pulvinar organization across the major branches of the primate radiation. Toward this end, we sought to reveal patterns of visual pulvinar connections in a member of the prosimian radiation, the Otolemur garnetti.
The primate order has three major branches, the prosimians, the tarsiers, and the anthropoid primates that include monkeys, apes, and humans. In general, the skull and brain shapes of extant prosimian (strepsirrhine) primates resemble those of the earliest primate fossils (Radinsky, 1977; Jerison, 1979), suggesting that, in some respects, prosimian brains have changed the least in primate evolution. An initial separation of the two main branches of early prosimians into lemuriforms and lorisiforms occurred in Africa 50 – 80 million years ago. The lemuriform ancestor invaded Madagascar to initiate the highly varied radiation of lemurs (Horvath and Willard, 2007), and lorisiforms divided into lorisides and galagosides (Roos et al., 2004). The galagos, including Otolemur garnetti (formerly Galago garnetti), remained in Africa, whereas one of the two lorisid lineages migrated to Asia. Most of what is known about the organization of prosimian brains comes from studies of galagos.
Previously, several papers have described some aspects of pulvinar connections in galagos (Glendenning et al., 1975; Raczkowski and Diamond, 1978, 1980, 1981; Symonds and Kaas, 1978; Carey et al., 1979; Wall et al., 1982). The present results, together with previous findings, allow a more comprehensive understanding of pulvinar organization in galagos as well as a comparison with what is now known about pulvinar organization in monkeys. The major conclusion stemming from this comparison is that the inferior pulvinar of galagos, and perhaps other prosimians, has fewer subdivisions than in monkeys, and cortical connections with various visual cortical areas are not as segregated. The cortical areas investigated in the present study include V1 and V2, areas common to most mammals, and MT, an area characteristic of all primates with no obvious homologue in other mammals (Kaas, 2004). In addition, we describe superior colliculus projections to the pulvinar.
MATERIALS AND METHODS
Animals
Seven adult galagos (Otolemur garnetti) were used for the present study. Pulvinar projections to visual cortex were studied in five animals, and projections from superior colliculus to pulvinar were studied in two. All surgical procedures were carried out in accordance with the NIH Guidelines for the care and use of laboratory animals (NIH publication 86-23) under a protocol approved by the Vanderbilt University Animal Care and Use Committee.
Surgery
Galagos were anesthetized with intramuscular injections of a mixture of ketamine hydrochloride (30 mg/kg) and xylazine (0.5–1.0 mg/kg), with supplementary doses administered as required to maintain a surgical level of anesthesia, or replaced by 2% isoflurane as an inhalation anesthetic. Galagos were placed on a heating pad and secured in a stereotaxic apparatus. Under aseptic conditions, a craniotomy was carried out to expose the dorsolateral occipital cortex and the caudal tips of the intraparietal sulcus (IPS) and lateral sulcus (LS). The dura was then cut and reflected. In two galagos, the left cerebral hemisphere was retracted and partially aspirated in order to visualize the right superior colliculus and allow an access that prevented contamination of cortex with neuroanatomical tracers. Up to four neuroanatomical tracers were pressure injected 1.0 –1.5 mm below the cortical surface and 0.7– 0.8 mm into the superior colliculus by using Hamilton syringes with glass micropipettes attached. Tracers included wheat germ agglutinin-horseradish peroxidase (WGA-HRP; Sigma, St. Louis, MO; 2% in distilled water), cholera toxin b-subunit (CTB; Molecular Probes Invitrogen, Carlsbad, CA; 10% in distilled water), fluoro ruby (FR; Molecular Probes Invitrogen; 10% in distilled water), fast blue (FB; Polysciences Inc., Warrington, PA; 3% in distilled water), and diamidino yellow (DY; Sigma; 2% in distilled water). Injection sites were made by reference to brain surface features. An injection in V1 was made in the caudal most portion of the craniotomy. In some galagos, a dimple on the surface of the brain marks the V1/V2 border. The location of area V2 was approximated as 7–9 mm caudal to the caudal tip of the intraparietal sulcus (IPS) as a landmark. Injections in MT were placed in the region 8 mm ventrolateral from the caudal one-third of the IPS and 7 mm caudal to the dorsal one-third of the lateral sulcus. Superior colliculus injections were made along the medial aspect of the right superior colliculus (upper field representation). The locations of the injection sites in cortex were later established by architectonic criteria or by position relative to at least one obvious architectonic border. After the injections, gelatin film was used to cover the exposed cortex, the skull opening was sealed with an artificial bone flap made of dental cement, and the skin was sutured. The galagos were placed in a recovery cage and carefully monitored during recovery from anesthesia. When fully awake, they were given food and water and, after several hours, returned to the home cage.
Three to six days after surgery, animals were reanesthetized with a lethal dose of sodium pentobarbital (80 mg/kg) and perfused with 0.9% saline, followed by 2% paraformaldehyde in 0.1 M phosphate buffer (pH 7.2) and 2% paraformaldehyde in 0.1 M phosphate buffer with 10% sucrose solution. The brain was removed, and the cortex was separated from the thalamus. The cortex was carefully unfolded and flattened between two glass slides. The flattened cortices and thalamus were placed in a 30% sucrose solution for cryoprotection overnight.
Histology
The flattened cortex was cut parallel to the surface into 40 –50 μm sections on a freezing microtome and divided into three or four sets of sections. One series of section was mounted without further processing for fluorescence microscopy. In cases when WGA-HRP was injected, another series of sections was histochemically processed for tetramethyl-benzidine (TMB) to reveal WGA-HRP (Mesulam, 1978). Another series was processed for cytochrome oxidase (CO; Wong-Riley, 1979) and a third (or fourth) series processed for myelin (Gallyas, 1979) to reveal architectonic features of cortical areas. The thalamus was sectioned in the coronal plane and divided into five series, one of which was mounted without further processing for fluorescence microscopy and the rest processed for TMB, Nissl substance, CO, or myelin.
Anatomical reconstruction
Distributions of neurons labeled with FR, FE, DY, and FB in the thalamus were plotted with a fluorescent Leitz microscope using Igor Pro (WaveMetrics, Inc.). Thalamic sections processed for TMB were drawn at low magnification with a drawing tube attached to a darkfield microscope. Regions of WGA-HRP label were located under darkfield illumination. The locations of blood vessels were also plotted to aid in the alignment of sections. Architectonic borders of the visual pulvinar were identified in the adjacent sections processed for histological stains, and both the section plots and photomicrographs were imported into Adobe Illustrator CS2 (Adobe Systems Inc., San Jose, CA) for alignment with architectonic borders. Architectonic borders of cortical areas were identified and drawn from flattened cortex sections stained for myelin or CO, whereas architectonic borders within the superior colliculus were identified in sections stained for CO. Photomicrographs of the injection sites were aligned to the myelin- and CO-stained sections by using blood vessels and other features common to adjacent brain sections. Cortical injection sites were localized within the V1, V2, and MT architectonic boundaries. Injection sites within superior colliculus were reconstructed relative to the surface view of the superior colliculus. These injections were large enough to involve both superficial and intermediate layers. Photomicrographs that were used for architectonic reconstruction and for data illustration were acquired with a Nikon DXM1200 (Nikon Inc., Melville, NY) digital camera mounted on a Nikon E800 (Nikon Inc., Melville, NY) microscope. The photomicrographs were adjusted for brightness and contrast in Adobe Photoshop (Adobe Systems Inc.), but they were not otherwise altered.
RESULTS
In the present study, we related patterns of thalamocortical and tectothalamic connections to architectonic subdivisions of the pulvinar in prosimian galagos. To reveal these connections, retrograde and bidirectional tracers were injected into cortical areas V1, V2, and MT or into the superior colliculus. The locations and extents of the cortical injections are shown in Figure 1. The superior colliculus injections were all placed in the medial superior colliculus representing the upper visual hemifield (Lane et al., 1973). Typical injection site cores of the bidirectional tracers CTB and WGA-HRP in area MT of galago 07–45 (Fig. 2) illustrate both the relative lack of horizontal spread of these tracers and patchy intrinsic connections within MT and a few more distant patches of connections with adjoining visual areas. The locations of cortical injection sites within cortical areas were confirmed architectonically. Other injection sites were identified in coronal sections through the superior colliculus. All labeled neurons and terminations in the thalamus were related to architectonically identified subdivisions of the pulvinar and other nuclei.
Figure 1.
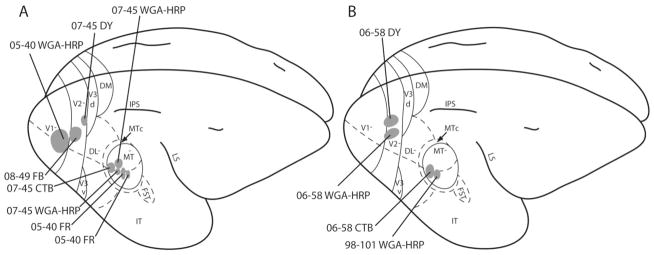
Summary of the injection sites. The type of tracers used, and the location and spread of the tracers from the cases are indicated on the schematized dorsolateral view of galago brains (A,B). The injection cores are shaded, with case number and tracer indicated.
Figure 2.

Representative injection cores in cortical sections cut parallel to the surface. Locations of the injection sites and the spread from case 07–45 are indicated on a schematized galago brain (A) and on a brain section stained for myelin to reveal MT and middle superior temporal area (MST; B). Both tracers used here, CTB and WGA-HRP, are bidirectional, and the extent of the spread and the anterogradely labeled terminals are shown in C and D, respectively. The arrows indicate common blood vessels that were used to align the adjacent sections. Scale bar = 5 mm in A; = 1 mm D (applies to B–D).
The identifying architectonic features of visual areas V1, V2, and MT and the pulvinar complex that allowed us to localize injection sites and transported label are noted below, followed by descriptions of the labeling pattern in the pulvinar after cortical and superior colliculus injections. The architecture of the superior colliculus of galagos in CO preparations has been described by Wu et al. (2005).
Architectonic subdivisions of V1, V2, and MT
To localize injection sites most accurately in visual areas V1, V2, and MT in galagos, we artificially flattened cortex, cut sections parallel to the cortical surface, and processed sets of sections for myelin or CO. As demonstrated in previous studies with this approach (see, e.g., Cusick and Kaas, 1988; Krubitzer and Kaas, 1990; Collins et al., 2001; Lyon and Kaas, 2002; Xu et al., 2004; Kaskan and Kaas, 2007), area 17, or V1, is easily identified by its pattern of CO-dense blobs (Fig. 3C), as in other primates. In addition, a marked reduction in myelination is apparent rostral to the V1/V2 border in myelin-stained sections through the middle cortical layers (Fig. 3B). The rostral border of V2 is more difficult to define architectonically in galagos. Sometimes, there is a faint banding pattern of CO-dense and CO-poor stripes as in anthropoid primates, but this feature is an unreliable marker (Collins et al., 2001). Here, we estimated the width of V2 from previous microelectrode mapping studies as having a maximum width of 3 mm (Rosa et al., 1997). Thus, injection cores within 3 mm of the V1 border were considered to be within V2. Finally, MT has been consistently identified in galagos and other primates as an oval of cortex that is CO and myelin dense (Fig. 3A,C). However, MST can also be CO dense (Kaskan and Kaas, 2007), and the most rostral one-third of the CO-dense region in Figure 3C is likely to be MST. All the injections were in the caudal two-thirds of the CO-dense oval and, thus, in MT.
Figure 3.

Architectonic features of V1, V2, and MT. A: Myelin-stained section of cortex sectioned parallel to the pia showing a densely myelinated MT. The extent of MT is indicated by the dashed line. B: Myelin stained section of flattened cortex sectioned parallel to the pia showing V1 and V2. A thin myelinated band marks the V1/V2 border. The estimated rostral extent of V2 is marked by the dashed line. C: A CO preparation of sections from flattened cortex showing V1, V2, and MT. The borders of the cortical areas are indicated by the dashed lines. Scale bars = 1 mm.
Architectonic subdivisions of visual cortex and the locations of injection sites
In all cases, thalamocortical connections were revealed by injections of tracers in cortical areas V1, V2, or MT. To localize the injections accurately in these areas and ascertain the spread of tracer at the injection site, we separated cortex from the rest of the brain, flattened the cortex, cut sections parallel to the cortical surface, and processed sections for injection sites. The advantages of this procedure are clear, but this separation of cortex from white matter made it difficult to determine whether injections ever involved the white matter as well as the cortex. Injection volumes were small and injections were consistently made at depths of 1.0 –1.5 μm, so little or no involvement of white matter was likely. Nevertheless, consistent results across areas and the large foci of labeled neurons can most reliably be treated as reflecting transport of the tracers from the cortical injection sites, as in other such studies, whereas small groups of labeled cells that differ in locations across cases should be considered more cautiously.
Architecture of the visual pulvinar
In brain sections stained for Nissl substance, myelin, or CO, three divisions of the pulvinar complex can be distinguished in galagos. As in other primates, the brachium of the superior colliculus (BrSC) separates at least most of the inferior pulvinar complex, PI, from the rest of the pulvinar (Fig. 4). Cortical connection patterns and architectonic features indicate that parts of the medial nuclei of the inferior pulvinar complex (PIm) extend somewhat above the BrSC into the territory formerly considered to be the lateral pulvinar (Kaas and Lyon, 2007), but this is less certain in the architectonically less well differentiated pulvinar of galagos. The superior pulvinar of galagos, above the brachium, consists of a lateral nucleus, PL, with projections to V1, and a medial nucleus, PM, with other cortical connections (Symonds and Kaas, 1978). PL is more densely packed with Nissl-stained cells than PM (Fig. 4A) and is less myelinated (Fig. 4B). In CO preparations, PL stains less darkly than PM (Fig. 4C). However, these distinctions can be subtle, and the exact border between PL and PM can be difficult to distinguish. Although brain sections processed for acetylcholinesterase and calbindin clearly reveal subdivisions of the inferior pulvinar in monkeys, these preparations have been less informative in galagos (Collins et al., 2005b). In our preparations, PI does not appear to be homogeneous, but we have not been able to identify subdivisions reliably. However, connection patterns do provide evidence for such subdivisions (see below). Here we use terminology adopted from Symonds and Kaas (1978) and refer to medial divisions of the inferior pulvinar as PIm and the larger central-lateral division as PIc. These terms were also applied to the inferior pulvinar of owl monkeys (Lin and Kaas, 1979).
Figure 4.
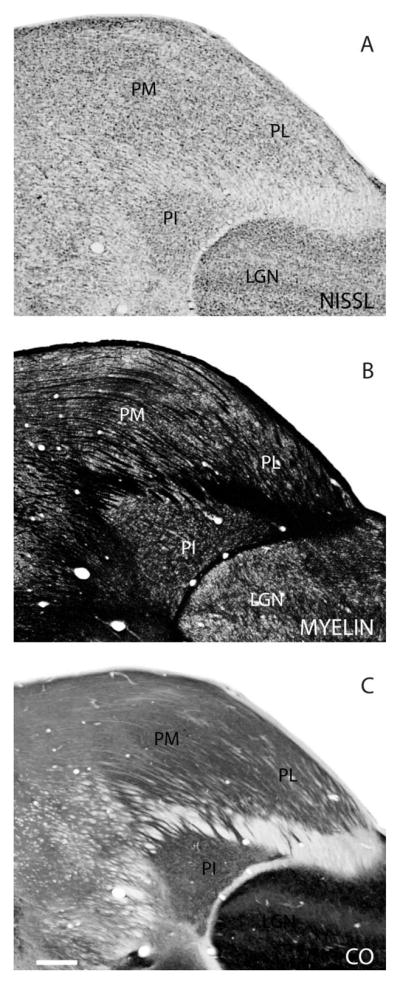
Architectonic features of the pulvinar. The three major subdivisions of the visual pulvinar in galagos, PL, PM and PI, shown in Nissl (A), myelin (B), and CO (C) preparations of coronal brain sections. Scale bar = 0.5 mm.
Thalamocortical connections
Injections in V1
Pulvinar connections with V1 have been previously described in some detail, so V1 was targeted in only a single case in the present study. The injection of WGA-HRP was located in the dorsolateral portion of V1 representing the central 5° of vision (Fig. 1). A second, smaller injection was made in V1 of the calcarine sulcus just under the injection site in surface V1. This second injection was in cortex representing 30 – 40° of peripheral vision of the lower visual quadrant according to published physiological maps of V1 of galagos (Rosa et al., 1997). The injections of the bidirectional tracer densely labeled neurons and terminals in the lateral geniculate nucleus (LGN), the inferior pulvinar, and the lateral pulvinar (Fig. 5). The two injections labeled two locations in the LGN, two locations in PL, and two locations in the lateral two-thirds of PI (PIc). An additional focus of labeled neurons and axon terminals was in PIm. The dense clusters of neurons and labeled terminals for one of the brain sections shown in Figure 5 are shown as a photomicrograph in Figure 6.
Figure 5.

Pulvinar connections of V1 in galago 05–40. A: The injection site is indicated on the dorsolateral view of a representative galago brain and appears to be confined to the central 5° of the visual field in V1. B: Coronal thalamic sections are arranged in an anterior (section 115) to posterior (section 143) progression. Dots represent the locations of retrogradely labeled cell bodies. Shaded regions on the thalamus sections represent the locations of dense anterograde label. Labeled cells are concentrated primarily in PL, PI, and LGN. Scale bar = 1 mm.
Figure 6.
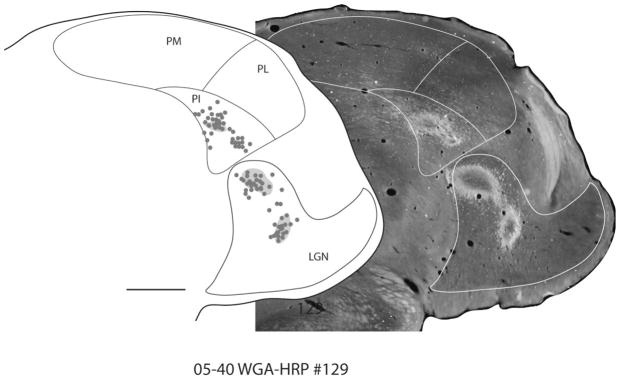
Representative coronal section showing retrograde label in the thalamus. A photomicrograph of section 129 from case 05–40 is placed beside its drawn plot (left). The architectonic borders of the pulvinar and LGN are indicated in white in the photomicrograph. Dense clusters of neurons and labeled terminals are observed in PI and LGN. Scale bar = 1 mm.
Our results on V1 connections are consistent with previous findings (Symonds and Kaas, 1978). The LGN projects to V1, and the lateral two-thirds of PI (the central nucleus of the inferior pulvinar, PIc, of Symonds and Kaas, 1978) projects topographically to V1. Previous evidence indicates that more central vision is represented medially in the LGN, dorsally in PIc, and ventrally in PL. In addition, the medial portion of PI (the medial nucleus of the inferior pulvinar, PIm, of Symonds and Kaas, 1978) projects to V1, but it is uncertain whether this projection is topographic (Fig. 5, section 138).
Injections in V2
Five injections in four cases were made in V2. In case 07–45, a DY injection was near the rostral border of V2 (Fig. 7A), in the lower field representation, at approximately 5–10° eccentricity. Possibly, the injections included the caudal margin of the third visual area (V3). DY-labeled cells were present in the anterior portions of PL and PI (Fig. 7B). As it was difficult to determine the border between the superior pulvinar and PI, the region within and just dorsal to the brachium of the superior colliculus may be part of PI. The DY-labeled cells in PI were in a large cluster in the middle of PI and another in a medial portion of the pulvinar that is dorsal to the brachium. These two clusters of cells may, respectively, correspond to central (PIc) and medial (PIm) nuclei of PI in monkeys. Most anteriorly labeled neurons appear to be in PL. In a second case (08–49), a FB injection was placed in V2 along the V1 border and slightly into the representation of the lower visual field (Fig. 7A). The injection labeled a large cluster of neurons in central PI (PIc; Fig. 7C) that might have involved PIm as well as PIc. The cluster also extended into PL. A few labeled neurons were in the LGN. In a third case, 06–58, both the WGA-HRP (5°) and the DY (10°) injections spread slightly into V1, possibly accounting for the WGA-HRP- and DY-labeled cells in the LGN (Fig. 8). The few WGA-HRP-labeled cells and terminations that remained on the dorsal margin of the LGN were unexpected. There were high concentrations of WGA-HRP-labeled terminations and cells in the central portion of PI, possibly including PIc and PIm. Other labeled cells were in PL. The DY-labeled cells were also mainly in the central portion of PI. Some labeled cells might have been in ventral PL, but they are more likely to be in parts of PI (PIc) that extend above the brachium. In a fourth case (08–61), a FB injection was placed in the lower field representation of V2 (not shown), at approximately 20 – 40° eccentricity (Rosa et al., 1997). FB-labeled cells were primarily central in anterior PI (PIc). The few labeled cells in lateral PI increased in concentration posteriorly. A few labeled cells were in the anterior portion of PL.
Figure 7.

Pulvinar connections of V2 in galagos 07–45 and 08–49. The injection sites, indicated on the dorsolateral view of a representative galago brain (A), were placed in the lower field representation of V2. Coronal thalamus sections are arranged in an anterior-to-posterior progression, with the sections from 07–45 in the first row (B) and sections from 08–49 in the second (C). Triangles represent the DY-labeled cells, and crosses represent the FB-labeled cells. The brachium of superior colliculus is outlined by the dashed lines. DY cells were concentrated mainly in the anterior portion of PL and PI. FB cells were concentrated in central PI. Scale bar = 1 mm.
Figure 8.

Pulvinar connections of V2 in galago 06–58. The injection sites, indicated on the dorsolateral view of a representative galago brain, were placed in the lower field representation of V2 (A). B: Coronal thalamus sections are arranged in an anterior (section 135)-to-posterior (section 163) progression. Triangles represent the DY-labeled cells, and circles represent the WGA-HRP-labeled cells. The brachium of superior colliculus is outlined by the dashed lines. Both injections have some V1 involvement, as labeled cells are present in the LGN. WGA-HRP- and DY-labeled cells were concentrated in central PI. C: Sections developed to show the WGA-HRP label appear in the lower row. Scale bar = 1 mm for thalamus sections.
Although two injections possibly included the border region of V1, all five injections labeled neurons in central PI, with the region of labeled neurons extending into and somewhat above the brachium of the superior colliculus. Most of the labeled neurons are in the region likely to be PIc, although PI could also be involved. The results suggest that parts of PI extend dorsally into and somewhat above the brachium of the superior colliculus, as in monkeys. Rostral PL likely also projects to V2. Finally, rostral V2 apparently receives little or no input from the LGN, suggesting that the labeled neurons in the LGN after injections in caudal V2 were the result of injections involving V1.
Injections in MT
MT was injected with tracers in four cases. The injections were in caudal to central MT, representing the central 10 –20° and 30° eccentricities. Injections placed along the horizontal meridian involved both the upper and the lower fields of MT.
In case 98–101, an injection of WGA-HRP was placed in the ventral midportion of MT representing the horizontal meridian, and a small part of the upper visual quadrant at ~10° eccentricity (Fig. 9B). Very few labeled cells were observed in PL, and no labeled cells were present in PM. The labeled cells in PL were within or just dorsal to the BrSC, and it is possible that these cells were within the portion of PI that extends dorsal to the BrSC rather than within PL. Other WGA-HRP-labeled cells were mainly in the medial (PIm) and lateral portions of PI (PIc), with almost none in the middle of PI. A more caudal injection of CTB in case 06–58 (Fig. 9C) was largely in the representation of the upper visual field, with some spread into the lower visual field. The distribution pattern of CTB-labeled cells in PI was similar to the labeling pattern of the upper field injection in 98–101, in that most of the labeled cells were clustered in the medial (PIm) and lateral (PIc) portions of PI, with very few in the middle. There were CTB-labeled cells in PL, including those well dorsal to the BrSC.
Figure 9.

Pulvinar connections of MT in galagos 98–101 and 06–58. A: The injection sites, indicated on the dorsolateral view of a representative galago brain, were placed in the upper field representation of MT. The CTB injection in case 06–58 spread somewhat into the lower field. Coronal thalamus sections are arranged in an anterior-to-posterior progression, with the sections from 98–101 in the first row (B) and sections from 06–58 in the second (C). Circles represent the WGA-HRP-labeled cells, and arrowheads represent the CTB-labeled cells. Locations of WGA-HRP anterograde label and CTB anterograde label are indicated by the ovals on the thalamus sections. The brachium of superior colliculus is outlined by the dashed lines. Both injections labeled cells in the medial and lateral portion of PI, with very few labeled cells in the middle portion of PI. Scale bar = 1 mm.
Case 07–45 had three closely spaced injections within the representation of the central 10° of the visual field along the horizontal meridian in MT (Fig. 10). Labeled cells were observed in both PL and PI. Again, labeled neurons were concentrated in both lateral (PIc) and medial (PIm) portions of PI, suggesting the existence of at least two nuclei that project to MT. The distributions of labeled cells from these injection sites in MT are consistent with previous evidence (Symonds and Kaas, 1978) that central vision is represented dorsally along the PI/PL junction in PI. The two injections in case 05–40 (Fig. 11) were in central MT, in the representation of the horizontal meridian at 20 –30° eccentricity. Both PL and PI had FR- and DY-labeled cells. Labeled cells were mostly clustered toward the middle of PI (PIc), although, at the posterior levels, labeled cells are observed throughout PI (PIp). Other labeled neurons were in PL.
Figure 10.

Pulvinar connections of MT in galago 07–45. A: The FR (circles), CTB (arrowheads), and WGA-HRP (squares) injection sites, indicated on the dorsolateral view of a representative galago brain, were placed within the central 10° of the visual field representation along the horizontal meridian of MT. B: Coronal thalamus sections are arranged in an anterior (section 117)-to-posterior (section 147) progression. Locations of CTB anterograde label are indicated by the ovals on the thalamus sections. The brachium of superior colliculus is outlined by the dashed lines. FR (circles)-, CTB (arrowheads)-, and WGA-HRP (squares)-labeled neurons were concentrated mainly in the lateral and medial portions of PI. Scale bar = 1 mm.
Figure 11.

Pulvinar connections of MT in galago 05–40. A: The FR (circles) and DY (triangles) injection sites, indicated on the dorsolateral view of a representative galago brain, were placed within the central 10° of the visual field representation of MT, along the 20 –30° of horizontal vision. B: Coronal thalamus sections are arranged in an anterior (section 116)-to-posterior (section 156) progression. Locations of CTB anterograde label are indicated by the ovals on the thalamus sections. FR (circles)- and DY (triangles)-labeled neurons were concentrated mainly in the middle portion of PI. Scale bar = 1 mm.
In summary, injections in MT labeled cells in both PL and PI but only occasionally cells in PM. The patches of labeled cells in PI suggested the existence of at least two regions projecting to MT, a middle to lateral region (PIm and PIc) and a medial region (PIp). In the lateral region (PIc), injections in the caudal part of MT representing central vision (CTB; Fig. 10) labeled neurons dorsolaterally in PI, whereas injections centered in MT (Fig. 11), which corresponds to paracentral vision, labeled neurons displaced medially from the lateral border of PI. The distribution patterns of labeled neurons in medial (PIm) and posterior (PIp) PI suggested the existence of little or no retinotopic organization.
Projections of the superior colliculus to the pulvinar
Afferents from the superior colliculus to the pulvinar were labeled with two injections in two cases. In both cases, the injections were placed medially in the middle portion of the superior colliculus, representing paracentral vision of the upper visual quadrant (Fig. 12B,E). In both cases, the injections labeled axons and axon terminals in ventrolateral PI (Fig. 12A,C,D,F). The labeled fibers were confined to the most posterior part of PI (PIp), and there was a suggestion of two foci of terminations, one very lateral and a smaller one slightly more medial. No labeled terminations were apparent in medial (PIm) or lateral (PIc) PI, PL, or PM.
Figure 12.

A–F: Projections of the superior colliculus to the pulvinar. In cases 07–105 and 07–111, FR injections were placed in the medial region of the superior colliculus (B,E). Locations of labeled axons and axon terminals are illustrated in A and B for 07–105 and 07–111, respectively. The brachium of superior colliculus is outlined by the dashed lines. C and F are high-powered photomicrographs of the FR-labeled axons and axon terminals from the superior colliculus injections. Scale bars = 1 mm.
DISCUSSION
Although the organization of the pulvinar complex is reasonably well understood in New and Old World monkeys, this is not the case in prosimian primates. Our approach in the present study was to determine the connection patterns of the pulvinar complex of prosimian galagos with three visual areas that have been well defined in both prosimian galagos and monkeys, areas V1, V2, and MT (Kaas, 1997). Aspects of the connections of these three areas with the pulvinar complex have been known for some time from early studies (Raczkowski and Diamond, 1978, 1980, 1981; Symonds and Kaas, 1978; Carey et al., 1979; Wall et al., 1982; Diamond et al., 1992), but results were not interpreted in the context of our current understanding of the organization of the pulvinar complex in anthropoid primates. Here we compare the pulvinar connections of V1, V2, and MT in galagos and monkeys in an effort to deduce similarities and differences in pulvinar organization. We start with a brief review of current understandings, followed by a synthesis of present and previous findings in galagos and a new interpretation of pulvinar organization in prosimian primates.
Pulvinar organization in monkeys
Traditionally, the pulvinar of primates has been divided into medial, lateral, and inferior divisions, in part on the basis of cytoarchitectonic differences and in part because of a conspicuous fiber band, the brachium of the superior colliculus, which extends mediolaterally to separate the inferior pulvinar from the superior medial and, to some extent, lateral divisions (Walker, 1938; Olsewski, 1952). More recently, a more extensive understanding of the organization of the pulvinar complex has developed from a series of studies involving electrophysiological maps of retinotopy (Allman et al., 1972; Gattass et al., 1978; Bender, 1981), cortical and other connections (Lin and Kaas, 1979, 1980; Ungerleider et al., 1983; Cusick et al., 1993; Gutierrez and Cusick, 1997; Adams et al., 2000; Stepniewska et al., 2000; O’Brien et al., 2001; Shipp, 2001; Weller et al., 2002), and especially histochemical and immunohistochemical procedures (Cusick et al., 1993; Gutierrez et al., 1995, 2000; Gray et al., 1999; Adams et al., 2000; Cola et al., 2005; Kaas and Lyon, 2007).
Our depiction of the organization of the pulvinar complex in monkeys (Fig. 13) is based on summary figures of Kaas and Lyon (2007) and Stepniewska (2003). The medial pulvinar, PM, is not considered further here, because its connections are with frontal, temporal, and parietal areas of cortex that are not predominantly visual. An adjoining dorsomedial portion of the pulvinar, sometimes considered part of the lateral pulvinar, is placed here in the PM because of its connection with frontal and parietal cortex. The lateral pulvinar proper, PL, sometimes called the ventrolateral nucleus of the lateral pulvinar (PLvl), constitutes the PL here. PL contains a single retinotopic representation of the contralateral visual hemifield (see, e.g., Gattass et al., 1978; Ungerleider et al., 1983) and has dense interconnections with early visual areas (V1, V2, and possibly V3), and visual areas of the ventral stream of visual processing, DLc(V4) and ITc. The organization of the inferior pulvinar is more complex. We currently distinguish four nuclei in the inferior pulvinar. Previously, a large “central” nucleus was distinguished as occupying the most lateral part of the inferior pulvinar (Lin and Kaas, 1979). More recent studies in monkeys have clearly revealed that the central nucleus, PIc, has two chemoarchitectonically distinct divisions with different cortical connections (Stepniewska and Kaas, 1997). A larger central lateral nucleus (PIcl) occupies most of the previous central nucleus, whereas a narrow central medial nucleus (PIcm) has connections that functionally align it more with medial divisions of the inferior pulvinar. PIcl constitutes the second large retinotopically organized nucleus of the pulvinar complex, and its cortical connections with V1, V2, DLc, and ITc match those of PL. PIcm and the other two nuclei of the inferior pulvinar, the medial (PIm) and posterior (PIp) nuclei, have connections with MT; visual areas adjoining MT, such as MST, MTc, and FST; and other areas (DLr and DM) of the dorsal stream of visual processing (see, e.g., Cusick et al., 1993; for review see Kaas and Lyon, 2007). Although these three nuclei have overlapping patterns of cortical connections, they are histochemically distinct. Furthermore, histochemical characteristics and patterns of cortical connections indicated that the brachium of the superior colliculus is only a rough guide to the location of the dorsal boundary of the inferior pulvinar. In places, PIp, PIm, and PIcl all extend somewhat above the brachium such that these nuclei are divided by the brachium.
Figure 13.

Summary diagram of connections of the visual pulvinar in monkeys and galagos. PL and PIcl in monkeys (A) and galagos (B) have similar projections to V1 and V2. PIm in galagos projects to both V1 and MT, whereas PIm in monkeys project only to MT. PIp in both galagos and monkeys receives inputs from the superior colliculus and areas related to MT and projects to MT. Although we have indicated that dorsal parts of the illustrated visual areas represent the lower visual quadrant, and ventral parts represent the upper visual quadrant (except for PM), connection patterns are intended to include all of each visual area, not just the ventral portions where arrows terminate.
Previous concepts of pulvinar organization in galagos
Overall, the configuration of the pulvinar complex in galagos differs from that in monkeys in that the lateral pulvinar is mainly superior to the inferior pulvinar. Thus, early investigators combined the medial and lateral divisions of the pulvinar into a single superior division (Glendenning et al., 1975; Raczkowski and Diamond, 1978, 1980; Symonds and Kaas, 1978; Diamond et al., 1992). However, connection patterns with visual cortex were concentrated in the lateral part of the superior pulvinar, and Symonds and Kaas (1978) concluded from connection patterns with V1 that this lateral part is retinotopically organized. In the following sections, we refer to this lateral portion of the superior pulvinar as the PL, even when we are referring to results of early studies that were attributed to the superior pulvinar. Symonds and Kaas (1978) also divided the inferior pulvinar into a large central nucleus, IPc, with a retinotopic organization that was deduced from the dense projections from V1, and a smaller medial nucleus, IPm, with sparse, less well-focused projections from V1. We use these terms in the following discussion and attribute previously described connections to medial PI to PIm and the lateral two-thirds of PI to PIc. Because only the most posterior part of PI receives dense inputs from the superior colliculus, we distinguish this portion as the posterior nucleus of the inferior pulvinar, PIp.
Pulvinar organization in prosimians and homologues with monkeys
Unfortunately, it has not been as straightforward to deduce the nuclear organization of the pulvinar complex in prosimian galagos as in New and Old World monkeys. This is primarily because the nuclei within the inferior pulvinar, to the extent that they exist, are not obvious in galagos in the same histological preparations that reveal nuclei in monkeys. In owl monkeys, for example, three nuclei were apparent in the inferior pulvinar even in sections stained for Nissl substance (cells) or myelin (fibers; Lin and Kaas, 1979), and other histochemical preparations reveal four clear subdivisions. This is not the case in sections stained for Nissl or myelin in galagos (Fig. 3). Brain sections processed for acetylcholinesterase, calbindin, CO, and the antigen for the antibody Cat-301 have all proved useful for distinguishing nuclei of the inferior pulvinar in monkeys (Cusick et al., 1993; Gutierrez et al., 1995; Gutierrez and Cusick, 1997; Stepniewska et al., 1999, 2000; Gray et al., 1999; Adams et al., 2000; O’Brien et al., 2001; Cola et al., 2005; Collins et al., 2005b), but this has not been true in galagos. In all these preparations, pulvinar nuclei were not well differentiated in galagos (unpublished results). Another difference is that nuclei of the inferior pulvinar in monkeys have distinctly different patterns of connections, but this is not so apparent in galagos. Despite these difficulties, we conclude that the inferior pulvinar of galagos, and likely of other prosimian primates, contains at least three nuclei, and these can be homologized with nuclei of the inferior pulvinar of monkeys, although the cortical connections are not exactly the same. Results supporting our conclusions are reviewed below.
Pulvinar projections to V1 in galagos and other primates
Our single injection of a tracer in V1 (area 17) of a galago was in a dorsolateral portion representing central vision. As expected, neurons were labeled in the medial portion of the dorsal lateral geniculate nucleus, representing central vision, as well as in both the PL and the PI pulvinar. No labeled neurons were in the PM. The most posterior part of the pulvinar was unlabeled. These results are consistent with those of previous studies of pulvinar connections with V1 in galagos. Symonds and Kaas (1978) described projection patterns to the pulvinar from 3H-proline injected into V1 and concluded that the major connections of V1 were with PL and IPc. Moreover, columns of terminal label in the pulvinar that stemmed from restricted injections in V1 suggested that lines of isorepresentation run from ventrorostral to dorsocaudal in the lateral pulvinar and in the central nucleus of the inferior pulvinar. These projection columns did not extend into the most posterior part of the inferior pulvinar. Comparable results, described in less detail, have been reported again for galagos (Raczkowski and Diamond, 1980) and for prosimian lemurs, Microcebus (Cooper et al., 1979). Surprisingly, lesions of the inferior or superior pulvinar in galagos did not reveal projections to V1 (Glendenning et al., 1975).
Evidence from V1 connections supports the conclusion that a large, retinotopically organized nucleus constitutes all or most of the lateral pulvinar (PL) of galagos, and this nucleus corresponds to the large retinotopic nucleus, PLvl, that constitutes most of the lateral pulvinar of monkeys (Kaas and Lyon, 2007). PLvl projects to V1 in monkeys, as well as V2, DLc(V4), and ITc, but sparsely and variably to MT (Adams et al., 2000). Another large nucleus, PIc, of the inferior pulvinar also projects in a retinotopic pattern to V1 of galagos. This nucleus seems to be the homologue of PIcl of monkeys, or perhaps PIcl plus PIcm, as PIc of galagos also projects to MT, as does PIcm of monkeys. Finally, even the most medial part of PI in galagos projects to V1, whereas comparable parts of PI in monkeys may not. Although V1 appears to provide some projections to PIm in macaque monkeys (Gutierrez and Cusick, 1997), these terminations were revealed by large injections, and few labeled neurons were found. Overall, PIm in galagos likely corresponds to PIm or PIm plus PIcm of monkeys, as PIcm targets areas associated with MT (MTc, MST, and FST; Boussaoud et al., 1992; Weller et al., 2002; Kaskan and Kaas, 2007; Kaas and Lyon, 2007) and MT (Stepniewska et al., 1999, 2000).
Pulvinar projections to V2
Our five injections in V2 of galagos labeled neurons in both PL and PIc. Some of the labeled neurons were in medial PI and could have been in PIm. Previously, Raczkowski and Diamond (1980) injected HRP into V2 (area 18) of two galagos and labeled neurons in the regions of both PL and PIc. In monkeys, PLvl and PIcl both project to V2, supporting the conclusion that these nuclei are homologues of PL and PIc of galagos. Three of the five injections in V2 also labeled neurons in the LGN, suggesting some involvement of the injection cores with V1 or that LGN projects somewhat to V2 in galagos. In monkeys, a few LGN neurons are thought to project to V2 (Bullier and Kennedy, 1983).
Pulvinar projections to MT
Our injections of tracers in MT of galagos consistently labeled neurons over much of PI, with foci of labeled neurons sometimes extending into or above the brachium of the superior colliculus, possibly into the territory of PL. Other labeled neurons were in PL, but they varied in density from only a few to large numbers. The reasons for this variation are not clear, but it seems reasonable to conclude that both PI and PL project to MT. In addition, separate medial and lateral locations in PI project to MT, providing evidence that both PIm and PIc project to MT. Finally, the most posterior portion of PI, our proposed PIp nucleus, projects to MT, as in monkeys (Lyon and Kaas, 2007). Previously, Wall et al. (1982) noted that MT of galagos projects to both PI and PL and concluded that two divisions of PI, PIm and PIc, receive inputs from MT. If the homology between PIc of galagos and PIcl of monkeys is correct, then a major difference is that PIc of galagos projects to V1, V2, and MT, whereas PIcl of monkeys projects to V1 and V2 but at best sparsely to MT (Adams et al., 2000). However, PIcm of monkeys projects to MT but not to V1 and very sparsely to V2. Thus, PIc of galagos resembles a combination of PIcm and PIcl of monkeys in cortical connections. In early studies, PIcm and PIcl were included in a PIc nucleus of monkeys, because they were myeloarchitectonically and cytoarchitectonically indistinguishable (Lin and Kaas, 1979). The present results suggest that a simple central nucleus, PIc, characterized the pulvinar of early primates, and that PIc differentiated into PIcl and PIcm only in the branch of primates leading to present-day anthropoids. Present-day tarsiers appear to have architectonically distinct PIcm and PIcl divisions (Collins et al., 2005a), so early haplorrhine primates over 60 million years ago, the common ancestors of tarsiers and anthropoids (monkeys, apes, and humans), would have had PIcm and PIcl divisions. MT injections also labeled neurons in the posterior part of PI, indicating that the region we call PIp in galagos projects to MT. In monkeys, PIp may provide a few projections to MT (Stepniewska et al., 1999; Kaas and Lyon, 2007), but they are not always reported (Cusick et al., 1993). PIp projections in monkeys also include those to cortical areas associated with MT, such as FST, MST, and MTc.
Superior colliculus projections to the pulvinar
In the present study, injections of a tracer into the medial part of the superior colliculus that represents the upper visual field labeled axons and axon terminals in the ventral part of the most posterior brain sections through the inferior pulvinar. Labeled terminations were not found more anteriorly, in the more anterior PIm or PIc regions, or in PL or PM. Previously, Glendenning et al. (1975) described degenerating axon terminals throughout the most posterior portion of PI in galagos after large lesions of the superior colliculus. Few, if any, degenerating axons were noted in the superior pulvinar or in more anterior parts of the inferior pulvinar. Thus, it seems clear that PIp of galagos receives the bulk of the superior colliculus inputs to the pulvinar. Here, we provide evidence that PIp provides some of the projections to MT of galagos. This conclusion is supported by projections to MT and to more ventral temporal cortex that were revealed by lesions of the most posterior part of PI in galagos (Glendenning et al., 1975). However, after further studies with cortical injections, Raczkowski and Diamond (1981) concluded that the main connections of the tectorecipient zone of PI were with temporal cortex ventral to MT, rather than MT. In monkeys, the superior colliculus projects densely to PIp and PIcm (Lin and Kaas, 1979; Stepniewska et al., 2000), both of which are subdivisions of PI that project sparsely to MT and more densely to FST that is just ventral to MT (Boussaoud et al., 1992; Kaas and Lyon, 2007).
SUMMARY
Our main conclusions are reflected in Figure 13. Primary visual cortex (V1) of galagos receives retinotopically organized inputs from PL and the central nucleus of PI (PIc). These two nuclei also project to V2. Because these connections are similar to PL and PIcl of monkeys, we propose that PL and PIc of galagos are homologous with PL and PIcl of monkeys. Despite this apparent homology, there are some differences. PIc of galagos projects to MT, but PIcl of monkeys does not. However, the former PIc region of monkeys (Lin and Kaas, 1979) has been divided into PIcm and PIcl nuclei on the bases of marked differences in histochemical appearance and cortical connections. Most notably, PIcl densely expresses acetylcholinesterase, but PIcm does not (Stepniewska and Kaas, 1997). In addition, PIcl projects to cortical areas more involved in ventral stream (Ungerleider and Mishkin, 1982) processing (V1, V2, DLc or V4, and IT), whereas PIcm projects to areas more involved in dorsal stream processing (MT, MTc, FST, DLv, and DM; see Kaas and Lyon, 2007). Thus, it seems possible that a single PIc nucleus of early primates failed to differentiate into two nuclei in present-day prosimians but did differentiate into PIcm and PIcl in present-day monkeys and other anthropoids (apes and humans). In the process, PIcl lost projections to MT while gaining input from the superior colliculus, and PIcm lost connections to V1 and V2. In addition, we propose that PIm of galagos and PIm of monkeys are homologous, in that they have the same relative position in the pulvinar complex, and both have connections with MT. PIm of galagos also projects to V1. Thus, we propose that the ancestors of present-day anthropoids lost PIm projections to V1, whereas prosimians did not. Finally, we propose that the most posterior parts of PI, the PIp nuclei in galagos and monkeys, are homologous on the bases of inputs from the superior colliculus, a lack of projections to V1 and V2, and projections to the MT region. Although PIp projections to MT have been demonstrated here and in previous studies (Raczkowski and Diamond, 1980), the densest cortical projection from PIp in galagos appears to be in cortex immediately ventral to MT (Raczkowski and Diamond, 1980). This region of cortex is now known to include the dorsal and ventral visual areas of the fundus of the superior temporal sulcus of monkeys, FSTd and FSTv (Kaas and Morel, 1993), which are major targets of PIp in monkeys (Kaas and Lyon, 2007). PIp may have lost some or most of its connections with MT in galagos. Overall, the likely outcome was that early primates had a visual pulvinar that had five divisions (PL, PM, PIc, PIm, and PIp) that were poorly differentiated architectonically and had overlapping cortical projections. These divisions were retained in present-day strepsirrhine prosimians, whereas PIc divided into PIcl and PIcm in the common ancestors of present-day tarsiers and anthropoid primates. The resulting four nuclei of the inferior pulvinar became architectonically and histochemically more differentiated and functionally specialized by becoming more specific in their cortical targets, while expanding superior colliculus inputs to include PIcm.
Acknowledgments
Grant sponsor: National Eye Institute; Grant number: EY 02686 (to J.H.K.).
We thank Laura Trice for her technical support.
Abbreviations
- BrSC
brachium of the superior colliculus
- DL(V4)
dorsolateral visual area
- DLc
dorsolateral caudal visual area
- DLv
dorsolateral ventral visual area
- DM
dorsomedial visual area
- FST
fundus of the superior temporal sulcus
- FSTd
fundus of the superior temporal sulcus dorsal
- FSTv
fundus of the superior temporal sulcus ventral
- IPS
intraparietal sulcus
- ITc
inferior temporal caudal cortex
- LGN
lateral geniculate nucleus
- LS
lateral sulcus
- MGN
medial geniculate nucleus
- MT
middle temporal visual area
- PI
inferior pulvinar
- PIc
inferior pulvinar central nucleus
- PIcl
inferior pulvinar central lateral nucleus
- PIcm
inferior pulvinar central medial nucleus
- PIm
inferior pulvinar medial nucleus
- PIp
inferior pulvinar posterior nucleus
- PIvl
inferior pulvinar ventral lateral nucleus
- PL
lateral pulvinar
- PLdm
lateral pulvinar dorsomedial nucleus
- PLvl
lateral pulvinar ventrolateral nucleus
- PM
medial pulvinar
- V1
primary visual area
- V2
secondary visual area
- V3
tertiary visual area
LITERATURE CITED
- Adams MM, Hof PR, Gattass R, Webster MJ, Ungerleider LG. Visual cortical projections and chemoarchitecture of macaque monkey pulvinar. J Comp Neurol. 2000;419:377–393. doi: 10.1002/(sici)1096-9861(20000410)419:3<377::aid-cne9>3.0.co;2-e. [DOI] [PubMed] [Google Scholar]
- Allman JM, Kaas JH, Lane RH, Miezin FM. A representation of the visual field in the inferior nucleus of the pulvinar in the owl monkey (Aotus trivirgatus) Brain Res. 1972;40:291–302. doi: 10.1016/0006-8993(72)90135-7. [DOI] [PubMed] [Google Scholar]
- Bender DB. Retinotopic organization of macaque pulvinar. J Neurophysiol. 1981;46:672– 693. doi: 10.1152/jn.1981.46.3.672. [DOI] [PubMed] [Google Scholar]
- Boussaoud D, Desimone R, Ungerleider LG. Subcortical connections of visual areas MST and FST in macaques. Vis Neurosci. 1992;9:291–302. doi: 10.1017/s0952523800010701. [DOI] [PubMed] [Google Scholar]
- Bullier J, Kennedy H. Projection of the lateral geniculate nucleus onto cortical area V2 in the macaque monkey. Exp Brain Res. 1983;53:168–172. doi: 10.1007/BF00239409. [DOI] [PubMed] [Google Scholar]
- Carey RG, Fitzpatrick D, Diamond IT. Layer I of striate cortex of Tupaia glis and Galago senegalensis: projections from thalamus and claustrum revealed by retrograde transport of horseradish peroxidase. J Comp Neurol. 1979;186:393– 437. doi: 10.1002/cne.901860306. [DOI] [PubMed] [Google Scholar]
- Cola MG, Seltzer B, Preuss TM, Cusick CG. Neurochemical organization of chimpanzee inferior pulvinar complex. J Comp Neurol. 2005;484:299–312. doi: 10.1002/cne.20448. [DOI] [PubMed] [Google Scholar]
- Collins CE, Stepniewska I, Kaas JH. Topographic patterns of v2 cortical connections in a prosimian primate (Galago garnetti) J Comp Neurol. 2001;431:155–167. [PubMed] [Google Scholar]
- Collins CE, Hendrickson A, Kaas JH. Overview of the visual system of Tarsius. Anat Rec A Discov Mol Cell Evol Biol. 2005a;287:1013–1025. doi: 10.1002/ar.a.20263. [DOI] [PubMed] [Google Scholar]
- Collins CE, Xu X, Khaytin I, Kaskan PM, Casagrande VA, Kaas JH. Optical imaging of visually evoked responses in the middle temporal area after deactivation of primary visual cortex in adult primates. Proc Natl Acad Sci U S A. 2005b;102:5594–5599. doi: 10.1073/pnas.0501762102. [DOI] [PMC free article] [PubMed] [Google Scholar]
- Cooper HM, Kennedy H, Magnin M, Vital-Durand F. Thalamic projections to area 17 in a prosimian primate, Microcebus murinus. J Comp Neurol. 1979;187:145–167. doi: 10.1002/cne.901870109. [DOI] [PubMed] [Google Scholar]
- Cusick CG, Kaas JH. Surface view patterns of intrinsic and extrinsic cortical connections of area 17 in a prosimian primate. Brain Res. 1988;458:383–388. doi: 10.1016/0006-8993(88)90483-0. [DOI] [PubMed] [Google Scholar]
- Cusick CG, Scripter JL, Darensbourg JG, Weber JT. Chemoarchitectonic subdivisions of the visual pulvinar in monkeys and their connectional relations with the middle temporal and rostral dorsolateral visual areas, MT and DLr. J Comp Neurol. 1993;336:1–30. doi: 10.1002/cne.903360102. [DOI] [PubMed] [Google Scholar]
- Diamond IT, Fitzpatrick D, Conley M. A projection from the parabi-geminal nucleus to the pulvinar nucleus in Galago. J Comp Neurol. 1992;316:375–382. doi: 10.1002/cne.903160308. [DOI] [PubMed] [Google Scholar]
- Gallyas F. Silver staining of myelin by means of physical development. Neurol Res. 1979;1:203–209. doi: 10.1080/01616412.1979.11739553. [DOI] [PubMed] [Google Scholar]
- Gattass R, Oswaldo-Cruz E, Sousa AP. Visuotopic organization of the cebus pulvinar: a double representation the contralateral hemifield. Brain Res. 1978;152:1–16. doi: 10.1016/0006-8993(78)90130-0. [DOI] [PubMed] [Google Scholar]
- Glendenning KK, Hall JA, Diamond IT, Hall WC. The pulvinar nucleus of Galago senegalensis. J Comp Neurol. 1975;161:419– 458. doi: 10.1002/cne.901610309. [DOI] [PubMed] [Google Scholar]
- Gray D, Gutierrez C, Cusick CG. Neurochemical organization of inferior pulvinar complex in squirrel monkeys and macaques revealed by acetylcholinesterase histochemistry, calbindin and Cat-301 immunostaining, and Wisteria floribunda agglutinin binding. J Comp Neurol. 1999;409:452– 468. doi: 10.1002/(sici)1096-9861(19990705)409:3<452::aid-cne9>3.0.co;2-i. [DOI] [PubMed] [Google Scholar]
- Gutierrez C, Cusick CG. Area V1 in macaque monkeys projects to multiple histochemically defined subdivisions of the inferior pulvinar complex. Brain Res. 1997;765:349–356. doi: 10.1016/s0006-8993(97)00696-3. [DOI] [PubMed] [Google Scholar]
- Gutierrez C, Yaun A, Cusick CG. Neurochemical subdivisions of the inferior pulvinar in macaque monkeys. J Comp Neurol. 1995;363:545–562. doi: 10.1002/cne.903630404. [DOI] [PubMed] [Google Scholar]
- Gutierrez C, Cola MG, Seltzer B, Cusick C. Neurochemical and connectional organization of the dorsal pulvinar complex in monkeys. J Comp Neurol. 2000;419:61– 86. doi: 10.1002/(sici)1096-9861(20000327)419:1<61::aid-cne4>3.0.co;2-i. [DOI] [PubMed] [Google Scholar]
- Horvath JE, Willard HF. Primate comparative genomics: lemur biology and evolution. Trends Genet. 2007;23:173–182. doi: 10.1016/j.tig.2007.02.007. [DOI] [PubMed] [Google Scholar]
- Jerison HJ. Brain, body and encephalization in early primates. J Hum Evol. 1979;8:615– 635. [Google Scholar]
- Jones EG. Thalamus. New York: Cambridge University Press; 2007. [Google Scholar]
- Kaas JH. Theories of visual cortex organization in primates. In: Kaas JH, Rockland KS, editors. Cerebral. New York: Plenum Press; 1997. pp. 91–126. [Google Scholar]
- Kaas JH. Early visual areas: V1, V2, V3, DM, DL, and MT. In: Kaas JH, Collins CE, editors. The primate visual system. Boca Raton, FL: CRC Press; 2004. pp. 139–153. [Google Scholar]
- Kaas JH, Lyon DC. Pulvinar contributions to the dorsal and ventral streams of visual processing in primates. Brain Res Rev. 2007;55:285–296. doi: 10.1016/j.brainresrev.2007.02.008. [DOI] [PMC free article] [PubMed] [Google Scholar]
- Kaas JH, Morel A. Connections of visual areas of the upper temporal lobe of owl monkeys: the MT crescent and dorsal and ventral subdivisions of FST. J Neurosci. 1993;13:534–546. doi: 10.1523/JNEUROSCI.13-02-00534.1993. [DOI] [PMC free article] [PubMed] [Google Scholar]
- Kaskan PM, Kaas JH. Cortical connections of the middle temporal and the middle temporal crescent visual areas in prosimian galagos (Otolemur garnetti) Anat Rec. 2007;290:349–366. doi: 10.1002/ar.20440. [DOI] [PubMed] [Google Scholar]
- Krubitzer LA, Kaas JH. Cortical connections of MT in four species of primates: areal, modular, and retinotopic patterns. Vis Neurosci. 1990;5:165–204. doi: 10.1017/s0952523800000213. [DOI] [PubMed] [Google Scholar]
- Lane RH, Allman JM, Kaas JH, Miezin FM. The visuotopic organization of the superior colliculus of the owl monkey (Aotus trivirgatus) and the bush baby (Galago senegalensis) Brain Res. 1973;60:335–349. doi: 10.1016/0006-8993(73)90794-4. [DOI] [PubMed] [Google Scholar]
- Lin CS, Kaas JH. The inferior pulvinar complex in owl monkeys: architectonic subdivisions and patterns of input from the superior colliculus and subdivisions of visual cortex. J Comp Neurol. 1979;187:655–678. doi: 10.1002/cne.901870403. [DOI] [PubMed] [Google Scholar]
- Lin CS, Kaas JH. Projections from the medial nucleus of the inferior pulvinar complex to the middle temporal area of the visual cortex. Neuroscience. 1980;5:2219–2228. doi: 10.1016/0306-4522(80)90138-4. [DOI] [PubMed] [Google Scholar]
- Lyon DC, Kaas JH. Evidence from V1 connections for both dorsal and ventral subdivisions of V3 in three species of New World monkeys. J Comp Neurol. 2002;449:281–297. doi: 10.1002/cne.10297. [DOI] [PubMed] [Google Scholar]
- Lyon DC, Jain N, Kaas JH. The visual pulvinar in tree shrews I. Multiple subdivisions revealed through acetylcholinesterase and Cat-301 chemoarchitecture. J Comp Neurol. 2003;467:593– 606. doi: 10.1002/cne.10939. [DOI] [PubMed] [Google Scholar]
- Mesulam MM. Tetramethyl benzidine for horseradish peroxidase neurohistochemistry: a non-carcinogenic blue reaction product with superior sensitivity for visualizing neural afferents and efferents. J Histochem Cytochem. 1978;26:106–117. doi: 10.1177/26.2.24068. [DOI] [PubMed] [Google Scholar]
- O’Brien BJ, Abel PL, Olavarria JF. The retinal input to calbindin-D28k-defined subdivisions in macaque inferior pulvinar. Neurosci Lett. 2001;312:145–148. doi: 10.1016/s0304-3940(01)02220-0. [DOI] [PubMed] [Google Scholar]
- Olsewski W. Determination of blood coagulability and checking and establishing of standards for coagulation time determined simultaneously by different methods. Przegl Lek. 1952;8:319–325. [PubMed] [Google Scholar]
- Raczkowski D, Diamond IT. Connections of the striate cortex in Galago senegalensis. Brain Res. 1978;144:383–388. doi: 10.1016/0006-8993(78)90165-8. [DOI] [PubMed] [Google Scholar]
- Raczkowski D, Diamond IT. Cortical connections of the pulvinar nucleus in Galago. J Comp Neurol. 1980;193:1– 40. doi: 10.1002/cne.901930102. [DOI] [PubMed] [Google Scholar]
- Raczkowski D, Diamond IT. Projections from the superior colliculus and the neocortex to the pulvinar nucleus in Galago. J Comp Neurol. 1981;200:231–254. doi: 10.1002/cne.902000205. [DOI] [PubMed] [Google Scholar]
- Radinsky LB. Early primate brains: facts and fiction. J Hum Evol. 1977:679–686. [Google Scholar]
- Roos C, Schmitz J, Zischler H. Primate jumping genes elucidate strepsirrhine phylogeny. Proc Natl Acad Sci U S A. 2004;101:10650–10654. doi: 10.1073/pnas.0403852101. [DOI] [PMC free article] [PubMed] [Google Scholar]
- Rosa MGP, Casagrande VA, Preuss TM, Kaas JH. Visual field represnetation in striate and prestriate cortices of a prosimian primate (Galago garnetti) Washington, DC: The American Physiological Society; 1997. pp. 3193–3217. [DOI] [PubMed] [Google Scholar]
- Shipp S. Corticopulvinar connections of areas V5, V4, and V3 in the macaque monkey: a dual model of retinal and cortical topographies. J Comp Neurol. 2001;439:469– 490. doi: 10.1002/cne.1363. [DOI] [PubMed] [Google Scholar]
- Stepniewska I. The pulvinar complex. In: Kaas JH, Collins CE, editors. The primate visual system. Boca Raton, FL: CRC Press; 2003. pp. 53–80. [Google Scholar]
- Stepniewska I, Kaas JH. Architectonic subdivisions of the inferior pulvinar in New World and Old World monkeys. Vis Neurosci. 1997;14:1043–1060. doi: 10.1017/s0952523800011767. [DOI] [PubMed] [Google Scholar]
- Stepniewska I, Qi HX, Kaas JH. Do superior colliculus projection zones in the inferior pulvinar project to MT in primates? Eur J Neurosci. 1999;11:469– 480. doi: 10.1046/j.1460-9568.1999.00461.x. [DOI] [PubMed] [Google Scholar]
- Stepniewska I, Qi HX, Kaas JH. Projections of the superior colliculus to subdivisions of the inferior pulvinar in New World and Old World monkeys. Vis Neurosci. 2000;17:529–549. doi: 10.1017/s0952523800174048. [DOI] [PubMed] [Google Scholar]
- Symonds LL, Kaas JH. Connections of striate cortex in the prosimian, Galago senegalensis. J Comp Neurol. 1978;181:477–512. doi: 10.1002/cne.901810304. [DOI] [PubMed] [Google Scholar]
- Ungerleider LG, Mishkin M. Analysis of visual behavior. In: Ingle DJ, Goodale MA, Mansfield RJW, editors. Two cortical visual systems. Cambridge, MA: MIT Press; 1982. pp. 549–586. [Google Scholar]
- Ungerleider LG, Galkin TW, Mishkin M. Visuotopic organization of projections from striate cortex to inferior and lateral pulvinar in rhesus monkey. J Comp Neurol. 1983;217:137–157. doi: 10.1002/cne.902170203. [DOI] [PubMed] [Google Scholar]
- Walker AE. The thalamus of the chimpanzee: IV. Thalamic projections to the cerebral cortex. J Anat. 1938;73:37–93. [PMC free article] [PubMed] [Google Scholar]
- Wall JT, Symonds LL, Kaas JH. Cortical and subcortical projections of the middle temporal area (MT) and adjacent cortex in galagos. J Comp Neurol. 1982;211:193–214. doi: 10.1002/cne.902110208. [DOI] [PubMed] [Google Scholar]
- Weller RE, Steele GE, Kaas JH. Pulvinar and other subcortical connections of dorsolateral visual cortex in monkeys. J Comp Neurol. 2002;450:215–240. doi: 10.1002/cne.10298. [DOI] [PubMed] [Google Scholar]
- Wong-Riley M. Changes in the visual system of monocularly sutured or enucleated cats demonstrable with cytochrome oxidase histochemistry. Brain Res. 1979;171:11–28. doi: 10.1016/0006-8993(79)90728-5. [DOI] [PubMed] [Google Scholar]
- Wu CW, Bichot NP, Kaas JH. Somatosensory areas S2 and PV project to the superior colliculus of a prosimian primate, Galago garnetti. Somatosens Mot Res. 2005;22:221–231. doi: 10.1080/08990220500262661. [DOI] [PubMed] [Google Scholar]
- Xu X, Collins CE, Kaskan PM, Khaytin I, Kaas JH, Casagrande VA. Optical imaging of visually evoked responses in prosimian primates reveals conserved features of the middle temporal visual area. Proc Natl Acad Sci U S A. 2004;101:2566–571. doi: 10.1073/pnas.0308745101. [DOI] [PMC free article] [PubMed] [Google Scholar]