Abstract
Human rhinoviruses were imaged under physiological conditions by dynamic force microscopy. Topographical images revealed various polygonal areas on the surfaces of the 30-nm viral particles. RNA release was initiated by exposure to a low-pH buffer. The lengths of the RNAs that were released but still connected to the virus capsid varied between 40 and 330 nm, whereas RNA molecules that were completely released from the virus were observed with lengths up to 1 μm. Fork-like structure elements with 30-nm extensions were sometimes resolved at one end of the RNA molecules. They possibly correspond to the characteristic multi-stem-loop conformation, the internal ribosomal entry site, located at the 5′ region of the genome. This study demonstrates that dynamic force microscopy can be used to study viral RNA release in situ under physiological conditions.
Human rhinoviruses (HRVs) are a main cause of common cold infections. They are small icosahedral particles with an RNA genome enclosed within the protein capsid. The virion is composed of 60 copies each of four viral coat proteins (VP1 through VP4) arranged on an icosahedral lattice (21). The 102 HRV serotypes have a protein shell, with three capsid proteins exposed at the surface and one capsid protein (VP4) in intimate contact with the genomic viral RNA (for a review on human rhinoviruses, see reference 22). After binding to the cell surface and internalization via receptor-mediated endocytosis, the RNA is released from the virion in endosomes and is subsequently delivered to the cytosol by a poorly understood mechanism. For the minor group of HRVs, this process is catalyzed by the low endosomal pH (20). The HRV genome is an RNA molecule of about 7,100 nucleotides with positive (messenger sense) polarity; it carries a covalently linked small protein (VpG) at its 5′ end and poly(A) at its 3′ end. The 5′ nontranslated region is about 500 bases long and is highly structured (11). It is unknown whether VpG is somehow involved in RNA release or if it imparts any directionality on the process.
Cryo-electron microscopy images of empty capsids showed that, upon uncoating, the star-shaped dome at the fivefold axis undergoes an iris-like movement, thereby opening a pore large enough to allow transit of the RNA (8). However, for HRVs, RNAs in the process of exiting have never been observed. We thus asked whether the viral RNAs could be imaged under physiological conditions by atomic force microscopy (AFM) during the process of extrusion.
AFM (1) is a powerful tool for the investigation of biological processes at the single-molecule level in a native environment (2). AFM was successfully used to investigate the morphologies of different viruses under physiological conditions (16) and to monitor RNA release from tobacco mosaic virus (3). However, in the latter study, all images of RNA and viruses were acquired with dried samples.
Different AFM modes can be used for imaging biological samples under physiological conditions. Topographical imaging was mainly achieved by contact-mode AFM, in which the cantilever is in touch with the sample incessantly during scanning (18). However, contact-mode imaging turned out to be less suitable for weakly attached samples, because biomolecules are often pushed away by the AFM stylus during scanning (12). To overcome this disadvantage, dynamic force microscopy (DFM) methods such as tapping-mode AFM, and more recently, magnetic AC mode AFM (MACmode AFM) (5) have been used for imaging soft and weakly attached biological samples (14, 17). For DFM, the cantilever oscillates and touches the sample only intermittently at the end of its downward movement, which reduces the contact time and minimizes friction forces. An alternating magnetic field drives the oscillation of a magnetically coated cantilever for MACmode AFM, whereas acoustic excitation is used for tapping-mode AFM. For this study, we used MACmode AFM to investigate the release of genomic RNA molecules from single HRV type 2 (HRV2) particles under physiological conditions.
MATERIALS AND METHODS
Materials.
Mica was obtained from Groepl, Tulln, Austria. All chemicals (e.g., buffer salts) were purchased from Merck, Darmstadt, Germany. RNase A (7,000 U/ml) was obtained from Qiagen, Vienna, Austria.
HRV2 immobilization.
HRV2, originally obtained from the American Type Culture Collection, was prepared in HeLa-H1 cells grown in suspension culture and was purified by sucrose density gradient centrifugation essentially as described previously (10). Ten microliters of ∼1-mg/ml HRV2 in a buffer containing 50 mM Tris-HCl and 5 mM NiCl2 (pH 7.6) was deposited onto freshly cleaved mica for 15 min, resulting in a densely packed HRV2 monolayer. Less coverage of the surface was obtained by reducing the HRV2 concentration. Unattached viruses were removed by washing the monolayer three times with the same buffer.
AFM imaging.
Topographical images were acquired with a magnetically driven dynamic force microscope (MACmode PicoSPM; Molecular Imaging, Tempe, Ariz.) and magnetically coated MacLevers (Molecular Imaging) in a commercial fluid cell. The lateral scan frequency of 1.3 Hz resulted in a total recording time of 7 min per image. All images shown represent raw data of height images, without filtering. The nominal spring constant of the cantilever was 0.1 N/m. For gentle imaging, the peak-to-peak oscillation amplitude was set to 5 nm at a 7-kHz oscillation frequency. The feedback loop was adjusted to 20% amplitude reduction in order to obtain stable images.
Induction of RNA release and characterization of RNA.
After HRV2 was immobilized at a low coverage on mica, the pH in the liquid cell was reduced to 4.1. After 2 h, it was readjusted to pH 7.6 by replacement of the liquid with the original buffer, and images were acquired. Control incubations were done in the presence of RNase A at a final concentration of 0.5 mg/ml, resulting in a complete disappearance of the RNA molecules.
RESULTS AND DISCUSSION
Topography imaging of HRV2.
A prerequisite for obtaining high-quality AFM images of biological samples is the tight immobilization of the specimen to a flat surface. Physical adsorption from a solution onto mica, a highly hydrophilic aluminosilicate, was used in all the experiments described here. By using bivalent cations as a bridge between the negatively charged mica and the virus, we obtained stable binding. Several bivalent cations, such as Mg2+, Ni2+, and Co2+, were tested. Ni2+, at 5 mM in 50 mM Tris-HCl (pH 7.6), yielded the most stable images of the adsorbed viruses. Repeated imaging over many hours showed no damage or displacement of the sample; this indicates that the viruses were tightly bound to the mica surface.
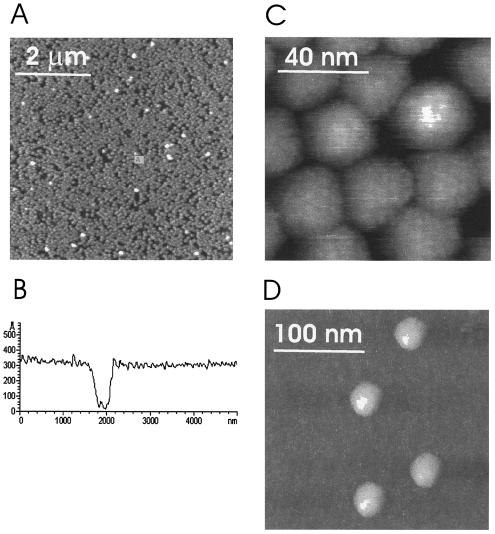
In addition to carefully selected buffer conditions, the image parameters were of special importance. Small oscillation amplitudes of the cantilever (5 nm), together with a minimal amplitude reduction (20%), resulted in a minimal energy input during imaging, thus preventing disruption of the sample and allowing stable imaging of the viruses (13). Figure 1A shows regularly arranged viruses in a densely packed monolayer. An almost complete coverage of HRV2 on mica was obtained. The height of the virus layer determined from the cross-sectional profile, using an uncovered spot on mica as a reference, was 31 ± 3 nm (Fig. 1B), which agrees very well with values derived from X-ray and electron cryomicroscopy measurements (9, 25). The high-magnification image in Fig. 1C shows the tight packing of regularly arranged viruses. The close apposition of the virions appears to result in some structural deformation, indicating that the immobilization onto mica together with lateral packing forces of the monolayer can lead to local distortions of the virus capsids. A regularly spaced pattern was observed on almost all viral particles, which might reflect the known protrusions on the surface of the viral capsid.
FIG. 1.
Topography images of HRV2 immobilized on mica. (A) Densely packed HRV2 monolayer. Dark regions correspond to holes, and white spots are virus particles bound on top of the first layer. The image scan size was 6 μm. (B) Cross-sectional profile of a homogeneous virus monolayer containing a large defective hole. Using uncovered mica as a reference, we determined the height of the monolayer to be 31 ± 3 nm. (C) Small scan size image of a densely packed HRV2 monolayer. The close apposition of the virions results in some structural deformation of the capsids. On most of the capsids, a regular pattern of ∼3 nm can be observed. The image scan size was 100 nm. (D) Separated virions show polygonal areas without deformation of the capsid. The image scan size was 250 nm.
The surface coverage was reduced by decreasing the virus concentration in the immobilization buffer and leaving the other adsorption conditions unchanged. Individual virions at a low coverage appeared as undeformed particles of 30 nm in height (Fig. 1D), indicating that the lateral forces acting in the densely packed layer, not the force applied by the AFM tip during imaging, were solely responsible for the observed deformation. Virus capsids did not appear strictly globular in shape, but rather the projection of the particles exhibited some straight borders akin to their polygonal surface features that were also observed by electron cryomicroscopy (25). Independent of the surface coverage of virions on mica, virus particles were stably imaged without any cantilever-induced movement over hours.
Monitoring the release of viral genomic RNA.
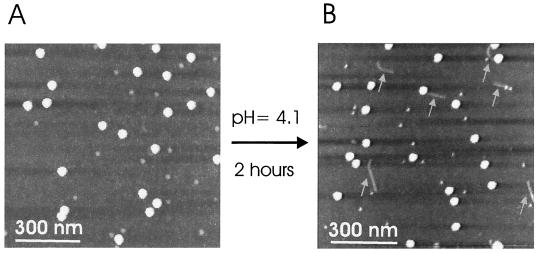
The release of RNA from the HRV2 capsid is triggered in vivo by the low-pH environment (pHs of <5.6) in endosomal carrier vesicles and late endosomes (20). This process was also studied in vitro by the exposure of isolated virions to a low-pH environment (15). In order to induce the process of RNA release, HRV2 bound to mica (Fig. 2A) was exposed to a pH of 4.1 for 2 h. Images were then taken again to investigate eventual changes in viral morphology. Indeed, single short RNA molecules were frequently observed (Fig. 2B, arrows), with a height of about 1 nm. They were either disparate from the virus or still connected to it. Apparently, the latter molecules had not entirely left the viral shell and were thus viewed directly during the process of extrusion. No such RNA molecules were observed when the sample was imaged immediately after the cell buffer had been replaced with the low-pH buffer.
FIG. 2.
RNA release at low pH. (A) Single virions adsorbed onto mica and imaged in a pH 7.6 buffer. The scan size was 900 nm. (B) The pH of the buffer was changed to 4.1 and maintained for 2 h. Images were acquired again at pH 7.6. Virus particles are observed together with RNA molecules (arrows), either separated from the virus capsid or still connected. The scan size was 900 nm.
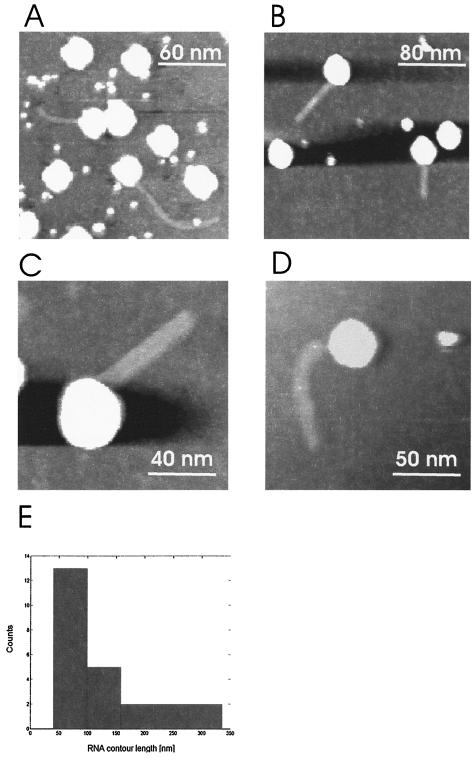
Snapshot images of RNA molecules during extrusion are shown in Fig. 3, with smaller scan areas. Single virions at different stages of RNA release were observed. Virus capsids appeared with heights of 25 to 35 nm, and the heights of the RNA molecules varied between 1 and 1.5 nm, which is in quite good agreement with the reported height of RNA measured by tapping-mode AFM (6). In contrast, the horizontal dimensions of objects were always overestimated due to the well-known tip-convolution effect in AFM images (23, 24). Accordingly, the observed lateral dimension of an object with a diameter of, e.g., 1.5 nm (as for RNA) will result in an image of 11 nm (based on a radius of the AFM tip of 20 nm). This corresponds well to the average diameter of RNA observed for this study, which was ∼10 nm. Due to this effect, the lateral diameters of single objects always appear larger than is in fact the case; nevertheless, the vertical dimension is not influenced by the finite tip apex. Therefore, for roughly spherical particles such as icosahedral viruses, the vertical heights of the particles give remarkably accurate values for their true diameters.
FIG. 3.
Partially released RNA molecules. (A) Bent RNA molecules in connection with the virus capsid. Virus particles are observed as bright spots with heights of about 31 nm. The smaller bright dots with 10-nm diameters are presumably debris of the virus capsid. The scan size was 200 nm. (B) Regularly shaped virus particles with straight RNA molecules still connected to the virus capsids. The scan size was 250 nm. (C) Single virus particle with an attached, straight RNA molecule observed at a scan size of 100 nm. (D) Bent RNA molecule protruding from the virus capsid observed at a 150-nm scan size. (E) Distribution of the contour lengths of RNA molecules connected to the virus capsids. In total, the contour lengths of 24 RNA molecules were used to construct the histogram.
RNA molecules in the process of extrusion were either in a straight conformation (Fig. 3B and C) or in a bent conformation (Fig. 3A and D). The fact that single-stranded RNA molecules can appear both as bent molecules and as straight molecules is corroborated by investigations of isolated RNAs (6). The distribution of the lengths of RNA molecules still connected to the virus capsids was analyzed, as shown in Fig. 3E. Their lengths ranged from 40 to 330 nm, with a pronounced frequency of occurrence between 40 and 100 nm. All RNAs observed in this study appeared either as straight filamentous molecules or as bent molecules, with both types lacking secondary structure.
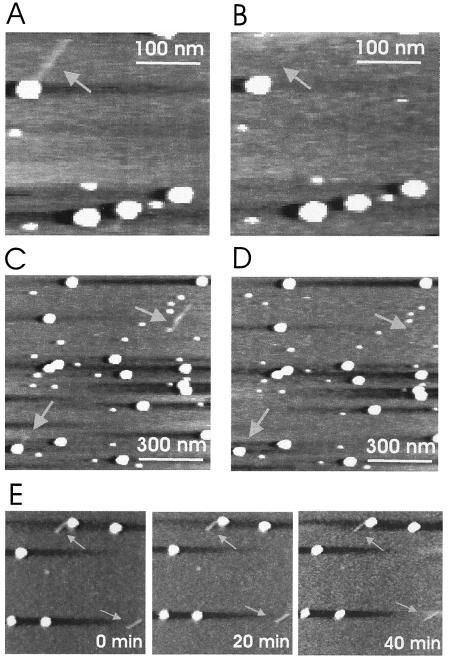
In order to demonstrate that the fibers protruding from the virus capsids were indeed RNA molecules, RNase A was gently injected into the liquid cell of the AFM. A comparison of the images prior to (Fig. 4A and C) and after (Fig. 4B and D) injection of the enzyme shows that the fibers disappeared upon enzymatic treatment (arrows). This unambiguously identifies the elongated structures as RNA molecules. This result was achieved with both partially (Fig. 4A and B) and completely (Fig. 4C and D) released RNA. Since the degradation of the RNA was faster than the time needed to acquire an AFM image, we were not able to monitor the enzymatic digestion of RNA in a time-resolved manner.
FIG. 4.
Enzymatic digestion of released RNA. (A) RNA molecule in the process of extrusion (arrow) after incubation at pH 4.1. The scan size was 300 nm. (B) Same scan area as for panel A after gentle injection of RNase A into the liquid cell and incubation for 10 min. (C) Completely (upper right arrow) and partially (lower left arrow) released RNA molecules appear after incubation at pH 4.1. The scan size was 900 nm. (D) After injection of RNase A into the liquid cell, the RNA molecules disappeared. (E) Time series of images showing completely and partially released RNA molecules. The images were acquired in the absence of RNase and demonstrate that the imaging process in no way displaced or modified the fibers (arrows).
In order to show that the disappearance of the fibers was indeed caused by the RNase, images of the sample were acquired at 0, 20, and 40 min without RNase injection. As shown in Fig. 4E, these images were identical, thus excluding the possibility that the fibers might have been removed by mechanical shearing.
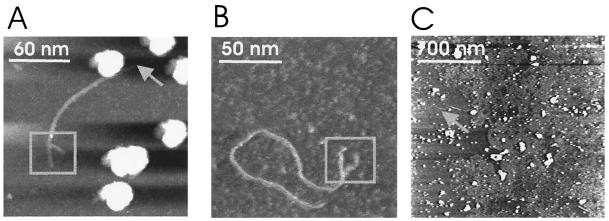
In those cases in which the RNA was completely separated from the virus capsid, and therefore released in its entirety, a fork-like structure was occasionally seen at one end of the molecule (Fig. 5A and B). This branch extended about 30 nm and was only seen on RNA molecules that were not connected to the virus capsid. The most prominent structural element of the RNA genome is the internal ribosome entry site (IRES) at the 5′ end. It has a characteristic cloverleaf structure with at least five larger stem-loops (11) and is involved in the initiation of polyprotein synthesis. The largest stem-loop, domain IV of the IRES, comprises roughly 80 bp. Assuming a length of 0.3 nm/bp (4, 7), it is expected to be on the order of 24 nm, which corresponds well to the length of the fork-like structure seen here. We therefore suggest that these structures in our images may correspond to the characteristic structural elements located at the 5′ terminus of the RNA genome.
FIG. 5.
Fully released RNA molecules. (A) RNA molecules completely released from virus capsids were occasionally obtained with a fork-like structure at one end of the RNA (box). The length of the fork was ∼30 nm. The scan size was 200 nm. Note that the RNA molecule is not in the process of extrusion but only touches the virus capsid from the side (arrow). (B) Individual RNA molecule separated from the virus capsid and exhibiting a similar fork-like structure (box) to that in panel A. The scan size was 150 nm. (C) Tightly packed RNA molecules on mica obtained upon exposure of the virus to a low pH at a high surface coverage. Several virus particles can be seen as bright white spots, and RNA molecules are tightly packed, forming a layer with a height of 1.5 nm. Isolated RNA molecules were observed only occasionally, exhibiting lengths of ∼1 μm (arrow). The scan size was 2 μm.
Because of the genome size of 7,100 nucleotides, a contour length of roughly 2 μm is expected for entirely released and extended RNA. However, the contour length of totally released RNA molecules, as shown in Fig. 5A and B, is only ∼200 nm. The differences in the observed and expected lengths may be attributed to the fact that the experiments were performed in a buffer solution without RNase inhibitor; hence, the degradation of the RNA certainly occurs. In contrast, longer RNA molecules, with lengths of ∼1 μm, were observed when the RNAs were tightly packed on mica; the high local concentration of the RNAs most likely prevents degradation (Fig. 5C). In this case, the RNA forms a densely packed layer of 1.5 nm in height in which single observable RNA molecules appear only occasionally (Fig. 5C, arrow). However, due to the close apposition of the RNA molecules in those images, no secondary structure elements could be observed.
Conclusion.
Topographical images of the HRV capsid were obtained routinely. The achieved resolution was only half of the resolution of electron cryomicroscopy (19); however, whereas the latter method requires the sample to be frozen in amorphous ice, the AFM measurements were carried out under physiological conditions, i.e., at room temperature and in a buffer solution. Induced by a low-pH environment, single RNA molecules were released from the virions, and snapshot images of this process were acquired. In those cases for which the RNA was still attached to the virus capsid, no secondary structure elements were seen. In contrast, RNA molecules released in their entirety showed fork-like structures, presumably corresponding to the 5′ IRES, at one end of the RNA. Since the fork-like structures were not observed on partially released RNAs, the data suggest that the viral genome is released with the 3′ end leaving the capsid first. This study shows the potential value of DFM for obtaining new insights into the molecular mechanism and dynamics of viral uncoating and RNA release.
Acknowledgments
This work was supported by Austrian Science Foundation project P14549 and the GEN-AU initiative of the Austrian Ministry of Education, Science, and Culture.
REFERENCES
- 1.Binnig, G., C. F. Quate, and C. Gerber. 1986. Atomic force microscope. Phys. Rev. Lett. 56:930-933. [DOI] [PubMed] [Google Scholar]
- 2.Drake, B., C. B. Prater, A. L. Weisenhorn, S. A. Gould, T. R. Albrecht, C. F. Quate, D. S. Cannell, H. G. Hansma, and P. K. Hansma. 1989. Imaging crystals, polymers, and processes in water with the atomic force microscope. Science 243:1586-1589. [DOI] [PubMed] [Google Scholar]
- 3.Drygin, Y. F., O. A. Bordunova, M. O. Gallyamov, and I. V. Yaminsky. 1998. Atomic force microscopy examination of TMV and virion RNA. FEBS Lett. 425:217-221. [DOI] [PubMed] [Google Scholar]
- 4.Fay, M. J., N. G. Walter, and J. M. Burke. 2001. Imaging of single hairpin ribozymes in solution by atomic force microscopy. RNA 7:887-895. [DOI] [PMC free article] [PubMed] [Google Scholar]
- 5.Han, W., S. M. Lindsay, and T. Jing. 1996. A magnetically driven oscillating probe microscope for operation in liquids. Appl. Phys. Lett. 69:4111-4113. [Google Scholar]
- 6.Hansma, H. G., I. Revenko, K. Kim, and D. E. Laney. 1996. Atomic force microscopy of long and short double-stranded, single-stranded and triple-stranded nucleic acids. Nucleic Acids Res. 24:713-720. [DOI] [PMC free article] [PubMed] [Google Scholar]
- 7.Henn, A., O. Medalia, S. P. Shi, M. Steinberg, F. Franceschi, and I. Sagi. 2001. Visualization of unwinding activity of duplex RNA by DbpA, a DEAD box helicase, at single-molecule resolution by atomic force microscopy. Proc. Natl. Acad. Sci. USA 98:5007-5012. [DOI] [PMC free article] [PubMed] [Google Scholar]
- 8.Hewat, E., E. Neumann, and D. Blaas. 2002. The concerted conformational changes during human rhinovirus 2 uncoating. Mol. Cell 10:317-326. [DOI] [PubMed] [Google Scholar]
- 9.Hewat, E. A., and D. Blaas. 1996. Structure of a neutralizing antibody bound bivalently to human rhinovirus 2. EMBO J. 15:1515-1523. [PMC free article] [PubMed] [Google Scholar]
- 10.Hewat, E. A., E. Neumann, J. F. Conway, R. Moser, B. Ronacher, T. C. Marlovits, and D. Blaas. 2000. The cellular receptor to human rhinovirus 2 binds around the 5-fold axis and not in the canyon: a structural view. EMBO J. 19:6317-6325. [DOI] [PMC free article] [PubMed] [Google Scholar]
- 11.Huang, H., A. Alexandrov, X. Chen, T. W. Barnes III, H. Zhang, K. Dutta, and S. M. Pascal. 2001. Structure of an RNA hairpin from HRV-14. Biochemistry 40:8055-8064. [DOI] [PubMed] [Google Scholar]
- 12.Karrasch, S., M. Dolder, F. Schabert, J. Ramsden, and A. Engel. 1993. Covalent binding of biological samples to solid supports for scanning probe microscopy in buffer solution. Biophys. J. 65:2437-2446. [DOI] [PMC free article] [PubMed] [Google Scholar]
- 13.Kienberger, F., R. Moser, H. Schindler, D. Blaas, and P. Hinterdorfer. 2001. Quasi-crystalline arrangement of human rhinovirus 2 on model membranes. Single Mol. 2:99-103. [Google Scholar]
- 14.Kienberger, F., C. Stroh, G. Kada, R. Moser, W. Baumgartner, V. Pastushenko, C. Rankl, U. Schmidt, H. Muller, E. Orlova, C. LeGrimellec, D. Drenckhahn, D. Blaas, and P. Hinterdorfer. 2003. Dynamic force microscopy imaging of native membranes. Ultramicroscopy 97:229-237. [DOI] [PubMed] [Google Scholar]
- 15.Korant, B. D., K. Lonberg Holm, J. Noble, and J. T. Stasny. 1972. Naturally occurring and artificially produced components of three rhinoviruses. Virology 48:71-86. [DOI] [PubMed] [Google Scholar]
- 16.Kuznetsov, Y. G., A. J. Malkin, R. W. Lucas, M. Plomp, and A McPherson. 2001. Imaging of viruses by atomic force microscopy. J. Gen. Virol. 82:1503-1508. [DOI] [PubMed] [Google Scholar]
- 17.Moller, C., M. Allen, V. Elings, A. Engel, and D. J. Muller. 1999. Tapping mode atomic force microscopy produces faithful high-resolution images of protein surfaces. Biophys. J. 77:1150-1158. [DOI] [PMC free article] [PubMed] [Google Scholar]
- 18.Muller, D. J., F. A. Schabert, G. Buldt, and A. Engel. 1995. Imaging purple membranes in aqueous solutions at sub-nanometer resolution by atomic force microscopy. Biophys. J. 68:1681-1686. [DOI] [PMC free article] [PubMed] [Google Scholar]
- 19.Neumann, E., R. Moser, L. Snyers, D. Blaas, and E. A. Hewat. 2003. A cellular receptor of human rhinovirus type 2, the very-low-density lipoprotein receptor, binds to two neighboring proteins of the viral capsid. J. Virol. 77:8504-8511. [DOI] [PMC free article] [PubMed] [Google Scholar]
- 20.Prchla, E., E. Kuechler, D. Blaas, and R. Fuchs. 1994. Uncoating of human rhinovirus serotype 2 from late endosomes. J. Virol. 68:3713-3723. [DOI] [PMC free article] [PubMed] [Google Scholar]
- 21.Rossmann, M. G., E. Arnold, J. W. Erickson, E. A. Frankenberger, J. P. Griffith, H. J. Hecht, J. E. Johnson, G. Kamer, M. Luo, A. G. Mosser, R. R. Rueckert, B. Sherry, and G. Vriend. 1985. Structure of a human common cold virus and functional relationship to other picornaviruses. Nature 317:145-153. [DOI] [PubMed] [Google Scholar]
- 22.Rueckert, R. R. 1996. Picornaviridae: the viruses and their replication, p. 609-654. In B. N. Fields, D. M. Knipe, and P. M. Howley (ed.), Fields virology, 3rd ed., vol. 1. Lippincott-Raven Publishers, Philadelphia, Pa. [Google Scholar]
- 23.Stemmer, A., and A. Engel. 1990. Imaging biological macromolecules by STM: quantitative interpretation of topographs. Ultramicroscopy 34:129-140. [DOI] [PubMed] [Google Scholar]
- 24.Tiner, W. J., V. N. Potaman, R. R. Sinden, and Y. L. Lyubchenko. 2001. The structure of intramolecular triplex DNA: atomic force microscopy study. J. Mol. Biol. 314:353-357. [DOI] [PubMed] [Google Scholar]
- 25.Verdaguer, N., D. Blaas, and I. Fita. 2000. Structure of human rhinovirus serotype 2 (HRV2). J. Mol. Biol. 300:1179-1194. [DOI] [PubMed] [Google Scholar]


