Abstract
Stress magnitude and variability as estimated from large scale finite element (FE) analyses have been associated with compressive strength of human vertebral cancellous cores but these relationships have not been explored for whole vertebral bodies. In this study, the objectives were to investigate the relationship of FE-calculated stress distribution parameters with experimentally determined strength, stiffness, and displacement based ductility measures in human whole vertebral bodies, investigate the effect of endplate loading conditions on vertebral stiffness, strength, and ductility and test the hypothesis that endplate topography affects vertebral ductility and stress distributions. Eighteen vertebral bodies (T6-L3 levels; 4 female and 5 male cadavers, aged 40-98 years) were scanned using a flat panel CT system and followed with axial compression testing with Wood’s metal as filler material to maintain flat boundaries between load plates and specimens. FE models were constructed using reconstructed CT images and filler material was added digitally. Two different FE models with different filler material modulus simulating Wood’s metal and intervertebral disc (W-layer and D-layer models) were used. Element material modulus to cancellous bone was based on image gray value. Average, standard deviation, and coefficient of variation of von Mises stress in vertebral bone for W-layer and D-layer models and also the ratios of FE parameters from the two models (W/D) were calculated. Inferior and superior endplate surface topographical distribution parameters were calculated. Experimental stiffness, maximum load and work to fracture had the highest correlation with FE-calculated stiffness while experimental ductility measures had highest correlations with FE-calculated average von Mises stress and W-layer to D-layer stiffness ratio. Endplate topography of the vertebra was also associated with its structural ductility and the distribution parameter that best explained this association was kurtosis of inferior endplate topography. Our results indicate that endplate topography variations may provide insight into the mechanisms responsible for vertebral fractures.
Keywords: Vertebral bodies, ductility, endplate topography, stiffness, finite elements
INTRODUCTION
According to a recent review by NIH, osteoporosis affects about 44 million Americans, nearly 68% of whom are women [1]. Vertebral fractures as a consequence of osteoporosis pose a tremendous problem, particularly when one considers that 50% of elderly female population is expected to have at least one vertebral fracture [2-4]. Hence, assessment of fracture risk of vertebral bodies is of great importance in the context of osteoporosis.
Bone mineral density (BMD) is commonly used as the clinical standard for assessing vertebral strength. There is no doubt that low bone density is associated with low bone strength and increased risk of fracture. However, BMD alone can explain only a portion of the variation in strength of vertebral bodies, the explained variability ranging between 40-80% [5, 6]. There is also an ambiguity in the use of BMD alone for predicting of fracture risk [7-10] and differentiating fractures between osteoporotic and non-osteoporotic groups [11]. Therefore, a more mechanistic understanding of vertebral fracture and mechanical properties related to fracture is needed.
Computer models based on computed tomography (CT) imaging coupled with in vitro mechanical testing are increasingly being used to assess bone strength [12-16] and to gain a mechanistic understanding of bone fracture. Trabecular shear stress magnitude and variability as estimated from large scale finite element (FE) analyses have been associated with cancellous bone compressive strength in human vertebral bone specimens [17]. However, these relationships have not been established for a whole vertebral body. Furthermore, previous studies have focused on vertebral stiffness and strength, but structural ductility measures remain largely unexplored. The significance of structural ductility, or the ability of a vertebra to sustain post-damage deformation, as a mechanical property relevant to vertebral fracture may be reinforced by two observations: (1) Vertebrae maintain substantial stiffness and strength when loaded a second time after subjecting them to loads beyond ultimate load the first time [15]. (2) Due to the slow progression of clinical vertebral fractures, they often remain unobserved until accidentally observed in x-ray radiograms taken for purposes other than a fracture [18]. These observations suggest that vertebral bone inherently has ability to undergo cycles of damaging loads before a complete collapse and lack of this ability is an important factor in developing a clinical fracture. Therefore, the first objective of the current study was to investigate the relationship of vertebral strength and ductility measures with FE-calculated stress distribution and stiffness properties in whole human vertebral bodies.
One of the major challenges of large scale FE modeling of whole vertebrae based on high-resolution images such as those from microcomputed tomography (μCT) is to accurately model the endplate boundaries and prescribe appropriate boundary conditions for both superior and inferior endplates. To circumvent this problem, some investigations have altogether removed the presence of endplates in the models [16, 19]. The results from the models that include the endplates suggest that cortical endplates are important in understanding the tissue failure in vertebral fracture [20]. Therefore, the second objective was to investigate the relationships of vertebral strength and ductility measures with vertebral endplate loading. Based on the results of the first two objectives, we developed a third aim, namely, to investigate the relationships of vertebral ductility and stress distribution properties of human vertebral bodies with the vertebral endplate topography.
METHODS
CT Scanning
Eighteen thoracic and lumbar (T6-L3) vertebral bodies, extracted from 4 female and 5 male cadavers, aged 40-98 years were used for the current study. The selection of vertebral levels from each spine was based on the availability as some of the vertebrae were already used in other studies. Intervertebral discs and posterior elements were removed. The specimens were scanned using a flat-panel CT system (fpCT) (GE Global Research Center, New York) [21]. The specimens were oriented vertically for the scans with superior vertebral endplate always at the top. A calibrated phantom was included while scanning each specimen. The scanned images were then reconstructed at an isotropic voxel size of 80 μm. The gray levels were converted to Hounsfield Unit (HU).
Mechanical Testing
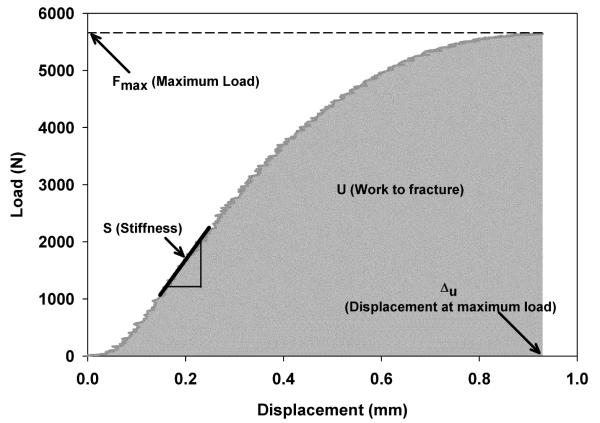
Following CT scans, all the specimens were subject to axial compression to fracture in a servo-hydraulic testing machine (Instron 8500, Canton, MA) [17]. Wood’s metal was employed as filler material to maintain a uniform boundary between the specimens and the load plates of the machine [22]. Load-displacement curves were generated and structural stiffness, strength, work to fracture, failure displacements and strains were calculated. Structural stiffness (S) of whole vertebrae was calculated from the slope of the linear portion of the load-displacement curve (Fig.1). Strength was defined as the maximum load (Fmax) on the load-displacement curve. Work to fracture (U) was calculated as the area under load-displacement curve up to maximum load. Failure displacement (Δu) and failure strain (εu) were defined as corresponding displacement and strain at maximum load respectively.
Figure 1.
A typical load-displacement curve illustrating measurement of mechanical parameters.
Finite Element Modeling
The images were thresholded at 1000 HU (corresponding to air in the container) to filter out background noise. However, no attempt was made to segment soft tissue inside the vertebral body. Voxel based linear large scale finite element models were constructed from the CT images. The voxel size was kept at 80 μm. Custom written code was used to recognize the top and bottom surface of the vertebral endplates. In order to create flat boundaries at the superior and inferior vertebral endplates [22], a thin layer of filler material was digitally added using the custom written code as illustrated in Fig. 2. The filler material layer was such that it was tangential to the topmost and bottommost layer of vertebral bone. The top (or the bottom) axial slice of the vertebra-filler construct was mostly filler layer with at least one bone voxel in it.
Figure 2.
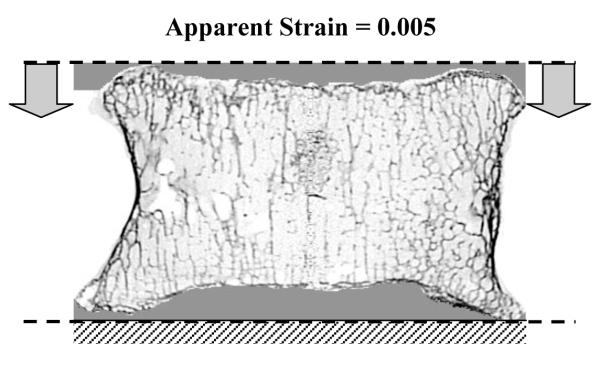
Illustration of digitally added filler material and boundary conditions in the finite element model. Horizontal displacements were constrained at both ends. The dashed lines illustrate the reference planes (tangential to the top-most and bottom-most layers of vertebral body) with respect to which endplate topographies were determined.
For the current study, we used the following relationship for the assignment of elastic modulus for each element in the finite element model based on the methods of Homminga et al. [23] and Bourne and van der Meulen [24]:
where, 8020 is the vertebral trabecular hard tissue modulus in MPa based on nanoindentation results from Hoffler et al [25], 2240 is the HU gray value equivalent for 1.1 g/cc tissue mineral density in our system and GVmax is the maximum gray value observed in the images for each vertebra. η was set to 1.5 [22]. The number 999 in the above equation represents the threshold level of 1000 HU reduced by one integer to avoid elements with zero stiffness.
Two sets of finite element models were then constructed for each vertebra. A modulus of 12.7 GPa was assigned for the filler material in one set corresponding to Wood’s metal (W-layer model) [22], and a modulus of 8 MPa was assigned for the filler material in the other set to simulate intervertebral disc (D-layer models) [20]. All the elements in the model were assigned a Poisson’s ratio of 0.3. Boundary conditions were assigned by constraining the horizontal displacements at both superior and inferior ends and prescribing a displacement equivalent to 0.5% apparent strain in the superoinferior direction (Fig. 2). The apparent strain was based on the average axial vertebral body height as measured from micro-CT images.
The expected value (VMExp), standard deviation (VMSD) and coefficient of variation of von Mises stresses (VMCV) excluding those in the filler were calculated as in previous work [26, 27]. Average von Mises stress per total reaction force (VMExp/FFE) and per apparent uniaxial stress (VMExp/σapp) were also calculated. As indicated in previous work [26, 28], VMExp/σapp can be considered as a measure of trabecular structure to amplify shear stress in the tissue. The ratios of finite element parameters from the W-layer models to those from the D-layer models were calculated for the same vertebrae to examine the effects of filler on stress distributions. For comparison purposes, a fpCT equivalent of bone mineral density (fpCT-BMD) was calculated using the entire vertebral bone volume including endplates and cortical shell [12].
The only difference between W-layer and D-layer models is in the elastic properties of the filler material that was digitally added to the fpCT images to create flat boundaries at the superior and inferior vertebral endplates. The D-layer model, because of the inherent compliance of the simulated disc, is expected to be sensitive to the endplate curvature distributions. However, the extent of this sensitivity would be variable depending on the amount and distribution of the filler on each sample. Therefore, significant association of ductility measures with W-layer to D-layer ratio parameters (see Fig. 4) was thought to be due to variations of vertebral endplate geometry measures such as curvature distributions. To this effect, surface topographical distributions of both superior and inferior endplates for each vertebral bone were determined by calculating the depth of each surface voxel on the respective endplates with respect to a reference plane (Fig. 2). Along with mean, standard deviation, and coefficient of variation, shape factors of inferior and superior endplate surface topographical distribution, viz., skewness (γ1) and kurtosis (γ2) were also determined by the following relations [29]:
where, μ’n=E{Xn}, is the nth moment of X about origin (n=1 gives the mean value of X).
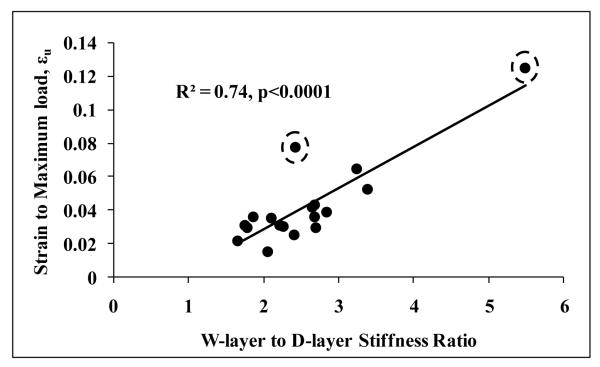
Figure 4.
Strain to maximum load (i.e., displacement adjusted for vertebral height) increases with increasing sensitivity of stiffness to endplate boundary layer. Exclusion of outliers indicated by dashed encircles results in R2 =0.57 and p<0.0008.
Paired t-test was used for comparison of W-layer models with D-layer models. Single and multiple regression models were used to examine the relationships between mechanical properties, FE-calculated parameters and all the calculated endplate surface topographical distribution parameters (mean, standard deviation, coefficient of variation, skewness, and kurtosis) for both superior and inferior endplates. Outlier analyses based on Jackknifed Distances [29] were performed separately for each set of covariates between which relationships were explored. Significance was set at p<0.05.
RESULTS
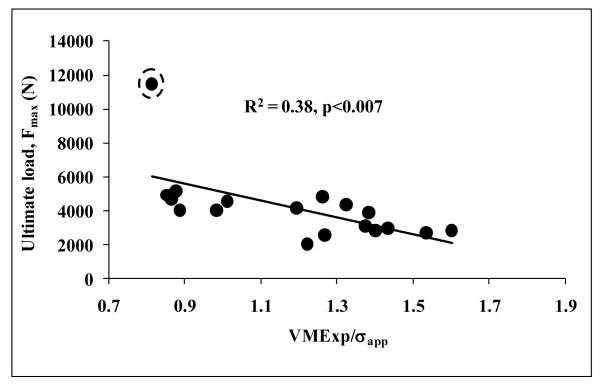
With the exception of average von Mises stress per total reaction force (VMExp/FFE) and average von Mises stress per apparent uniaxial stress (VMExp/σapp), all the other finite element parameters were higher for W-layer models compared to those for D-layer models with p<0.001 for all comparisons (Table 1). However, all the results were highly correlated between the W-layer and D-layer models (0.716<R<0.999). Average von Mises stress per apparent stress (VMExp/σapp) was negatively correlated with all structural and geometry-independent mechanical properties, i.e., structural properties that are normalized by vertebral height and cross sectional area to produce material-like properties (R2=0.28-0.39; p<0.03 for all) (Fig. 3, Table 2). Structural ductility as measured by experimental displacement and strain to maximum load were negatively correlated with coefficient of variation of von Mises stress, VMCV, for W-layer models (R=−0.48, p<0.05; R=−0.57, p<0.02, respectively) but not for D-layer models (p>0.14 and p>0.07).
Table 1.
Comparison of finite element results between W-layer and D-layer models. All the parameters are significantly different between the two models (p-values <0.0001 for all pairs)
| FE parameter | W-Layer | D-Layer |
|---|---|---|
| Stiffness (N/mm) |
5235 ± 3066 | 1965 ± 804 |
| VMExp (MPa) | 0.788 ± 0.339 | 0.359 ± 0.067 |
| VMSD (MPa) | 1.224 ± 0.435 | 0.456 ± 0.084 |
| VMCV | 1.598 ± 0.254 | 1.277 ± 0.120 |
| VMExp/σapp | 1.183 ± 0.257 | 1.412 ± 0.311 |
| VMExp/FFE (mm−2) |
0.00125 ± 0.0046 |
0.0015 ± 0.00055 |
Figure 3.
Vertebral strength decreased with increasing shear (von Mises) stress amplification in the tissue. Average von Mises stress per uniaxial force produced similar results. Exclusion of the outlier indicated by dashed encircles results in R2 =0.48 and p<0.002.
Table 2.
Correlation coefficients between W-layer finite element parameters (W) and mechanical test parameters and ratio of W-layer to D-layer finite element parameters (W/D) and mechanical test parameters. The last row lists the coefficients obtained between BMD and test parameters. Correlation coefficients are listed with p-values as R(p).
| S | Fmax | U | Δ u | ε u | ||
|---|---|---|---|---|---|---|
| SFE | W | 0.68 (0.002) | 0.83 (0.000) | 0.84 (0.000) | 0.78(0.000) | 0.672 (0.002) |
| W/D | 0.28 (0.260) | 0.37 (0.123) | 0.56 (0.017) | 0.81 (0.000) | 0.858 (0.000) | |
| VMExp | W | 0.45 (0.065) | 0.60 (0.008) | 0.72 (0.000) | 0.82 (0.000) | 0.802 (0.000) |
| W/D | 0.29 (0.238) | 0.39 (0.108) | 0.56 (0.016) | 0.80 (0.000) | 0.849 (0.000) | |
| VMSD | W | 0.44 (0.072) | 0.59 (0.009) | 0.67 (0.002) | 0.69 (0.002) | 0.593 (0.009) |
| W/D | 0.28 (0.256) | 0.41 (0.092) | 0.53 (0.024) | 0.70 (0.001) | 0.715 (0.000) | |
| VMCV | W | −0.15 (0.548) | −0.25 (0.313) | −0.33 (0.185) | −0.48 (0.044) | −0.570 (0.0134) |
| W/D | −0.18 (0.467) | −0.17 (0.500) | −0.34 (0.171) | −0.57 (0.015) | −0.671 (0.002) | |
| VMExp/σapp | W | −0.71 (0.033) | −0.62 (0.006) | −0.57 (0.012) | −0.56 (0.001) | −0.486 (0.041) |
| W/D | 0.04 (0.870) | 0.10 (0.678) | −0.10 (0.705) | −0.25 (0.319) | −0.286 (0.251) | |
| VMExp/FFE | W | −0.56 (0.002) | −0.60 (0.009) | −0.47 (0.05) | −0.35(0.159) | −0.169 (0.504) |
| W/D | 0.04 (0.870) | 0.10 (0.678) | −0.10 (0.705) | −0.25 (0.319) | −0.286 (0.251) | |
| fpCT-BMD | 0.55 (0.018) | 0.59 (0.009) | 0.63 (0.005) | 0.63 (0.005) | 0.569 (0.014) |
Both experimental displacement and strain to maximum load exhibited higher correlation with W-layer to D-layer VMCV ratio and W-layer to D-layer stiffness ratio compared to the respective parameters of W layer model. Multiple linear regression models indicated that increased W-layer to D-layer VMCV ratio and fpCT-BMD independently contribute to decreased displacement and strain to maximum load (Table 3). However, W-layer VMCV and fpCT-BMD in the multiple linear regression models did not independently contribute to displacement to maximum load, with fpCT-BMD as the only significant parameter. These results again underlie the importance of W to D layer ratio parameters more than just the W-layer parameters. Experimental strain to maximum load, εu exhibited the highest correlation (positive relationship) with W-layer to D-layer stiffness ratio (R=0.86, p<0.0001) (Fig. 4). However, multiple linear regression models indicated that fpCT-BMD and W-layer to D-layer stiffness ratio do not independently contribute to displacement or strain to maximum load with W-layer to D-layer stiffness ratio remaining as the only significant parameter.
Table 3.
Multiple linear regression models for displacement to maximum load (Δu) and strain to maximum load (εu).
| Model: Δu (R2adj = 0.49; p<0.004) | |||
| Parameter | Coefficient | Partial Correlation coefficient |
Significance |
| Intercept | 2.825 | - | p<0.05 |
| W to D layer VMCV ratio |
−2.178 | 0.56 | p<0.04 |
| fpCT-BMD (mg/cc) |
0.00184 | 0.63 | p<0.02 |
| Model: εu (R2adj = 0.54; p<0.002) | |||
| Parameter | Coefficient | Partial Correlation coefficient |
Significance |
| Intercept | 0.187 | - | p<0.01 |
| W to D layer VMCV ratio |
−0.142 | 0.62 | p<0.008 |
| fpCT-BMD (mg/cc) |
0.0000732 | 0.51 | p<0.04 |
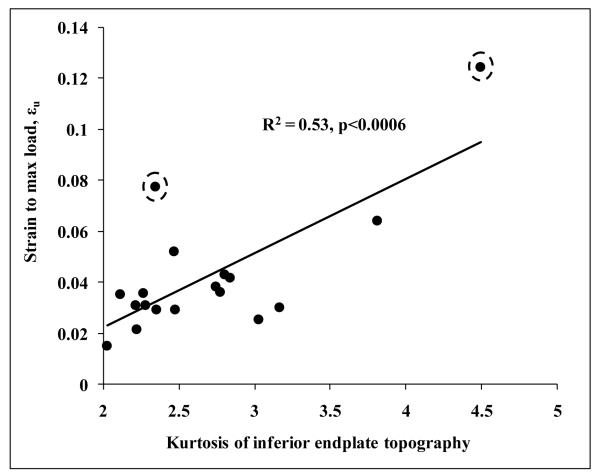
Of all the endplate surface topographical distribution parameters, kurtosis of inferior endplate topography had the highest correlation with W-layer to D-layer stiffness ratio (R=0.82, p<0.001). Kurtosis of the inferior endplate topography was significantly correlated with experimentally determined work to fracture, U (R=0.64, p<0.005), displacement at maximum load, Δu (R=0.73, p<0.0006), and strain at maximum load, εu (R=0.73, p<0.0006) (Fig. 5). Kurtosis of the inferior endplate topography was also significantly correlated with W to D layer ratios of average von Mises stress, VMExp (R=0.82, p<0.0001), and von Mises standard deviation, VMSD (R=0.75, p<0.0003). Multiple regression analysis indicated that W-layer to D-layer VMCV ratio (p<0.018) and kurtosis of inferior endplate topography (p<0.034) independently contributed to strain to maximum load. fpCT-BMD did not contribute in presence of these parameters (p>0.36)
Figure 5.
Experimentally determined strain to maximum load increases with increase in kurtosis of inferior endplate topography. Exclusion of indicated by dashed encircles results in R2 =0.39 and p<0.0098.
DISCUSSION
One of the goals of this study was to seek relationships of trabecular stress magnitude and variability with strength for whole human vertebral bodies. Association of whole vertebral strength and stiffness with average and standard deviation of von Mises stress calculated from FE models is consistent with previous findings from analysis of cancellous bone cores [30] and support the notion that bone strength and stiffness can be controlled through a stress regulated mechanism for whole vertebral bodies. However, we failed to find a significant correlation between VMCV and vertebral stiffness or strength. The variation in VMCV between bones was also small even though the variability of the stress within the bone can be high (Table 1). Together, it may be suggested that a narrow range of stress variability is maintained across specimens at the whole bone level. The increase in VMCV from D-layer to W-layer simulations suggests that interventions that create a stiff boundary layer on the vertebral endplates (as in W-layer model) or changes in intervertebral disc properties that can affect loading of the underlying vertebral endplate may stimulate an adaptive response that can adversely affect bone’s mechanical quality.
The computational parameters that are significantly associated with displacement based ductility measures are different from those significantly associated with strength and stiffness of whole vertebral bodies as evident from results of Table 2. Significant association between the W-layer to D-layer ratio parameters and ductility measures suggests that the differences in the ability of vertebral endplates to distribute stresses are a major determinant of vertebral ductility. One implication of this observation is that investigations of vertebral bone ductility that employ removal of vertebral endplates to achieve uniform load distribution properties are likely to miss important information even though vertebral stiffness and strength are less sensitive to variations in endplate load distributions (Table 2) [31].
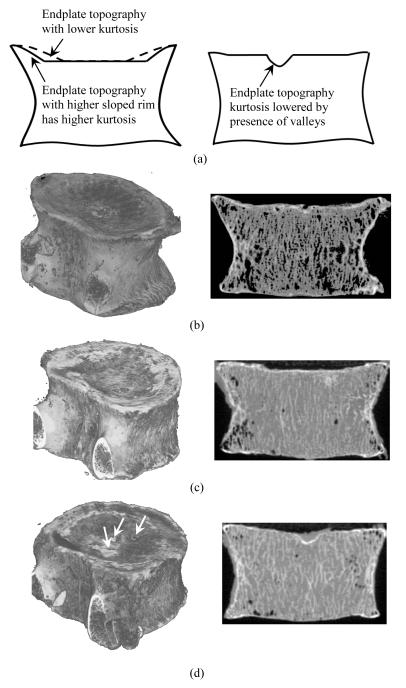
Our observation that ductility measures are associated with W-layer to D-layer ratio parameters is consistent with a previous prediction that endplate curvature influences stress distributions in a vertebral body [32]. In explaining this observation, we found that structural ductility of human vertebrae is sensitive to endplate surface topography (Fig. 5). Kurtosis measures the sharpness of a distribution and is an often discussed parameter in other areas as well where contact area is an important parameter, e.g., tribology [33]. There may be several mechanisms which can alter the kurtosis of endplate topography. For relatively similar sized vertebrae with the cortical rim sloping towards a flat surface at the center, an endplate with a greater slope of the rim and a larger flat central surface area would exhibit higher kurtosis of endplate topography because of a sharper peak (caused by a higher frequency of occurrence) and suppressed tails (caused by a lower frequency of occurrence) of endplate topography distribution. (Fig 6). Vertebral bodies with a taller rim on their endplate may undertake substantial deformation before failure due to bending of the rim in the outward direction, resulting in increased ductility. Consistent with this assertion, previous investigations have reported larger endplate deflections initially at the rim followed by the deformation of central regions during compressive loading of vertebral bodies [34]. Observation of endplate fractures occurring at the base of the rim under this type of loading is also consistent with the proposed mode of deformation [35]. In the case of a generally flat endplate surface with a smaller rim, a low kurtosis of topography distribution is indicative of existence of a small number of deviations (either peaks or deep valleys) from the relatively flat endplate surface (Fig 6). In the case of a smooth but curved (dish-shaped) surface, valleys on the surface would tend to lower (add to the distribution tail) whereas the peaks on the surface would tend to increase (add to the distribution peak) the kurtosis of topography distribution. Upon loading of vertebral bodies, stress concentrations can develop along the peaks and valleys because of a change in cross sectional area in an otherwise flat endplate surface or along the valleys in a dish-shaped surface because of an increased moment arm at the base or the tip and thereby increased stresses around these features. High stresses around these features on the endplate surface may result in localization of the failure and prevent the vertebra from benefiting deformations at other locations. It must be noted that had it been just a difference in degree of curvature (e.g. dish shape versus flat surface), the difference would then have been picked up by a simple measure of variability such as standard deviation of topography distribution. Our finding that kurtosis of the endplate topography distribution is most sensitive to failure to strain suggests that both the sharpness of the distribution peak and the presence of long tails are key to interpret the results as opposed to degree of curvature alone.
Figure 6.
Vertebrae with different inferior endplate surface topographies. (a) Illustration of cross sectional views of endplate topographies with different rim morphology (left) and presence of valleys on a relatively flat surface (right) resulting in kurtosis differences. (b) Kurtosis of inferior endplate topography=3.8. Presence of highly sloped rim and a large flat central surface area results in relatively high kurtosis. (c) Kurtosis of inferior endplate topography=2.3. Low sloped rim results in decrease of flat central surface area and low kurtosis compared to that in figure a. (d) Kurtosis of inferior endplate topography=2.2. Presence of valleys (indicated by arrows) on a relatively flat surface with no significant rim result in a low level of kurtosis.
Together, our data suggest an important role for surface non-uniformities of the endplate in the failure of a vertebra. The formation of the non-uniform surfaces may be a consequence of regional loss of underlying cancellous bone or localized degeneration of the intervertebral discs, however, the exact cause remains to be determined. Due to the limitations of our topography measures, we have not determined the spatial distribution of the actual morphology. We expect to gain further insight into the role the endplate surface irregularities may play in the mechanics of vertebral failure upon completion of such analyses.
It is interesting here to note that topographical parameters of the inferior endplate rather than the superior endplate have a significant association with stiffness, strength or ductility parameters. The inferior endplates have been reported to be stronger and thicker than superior endplates for both lumbar and sacral vertebrae [36]. Further, the cortical shell of the superior endplate gets reinforcement from posterior elements whereas no such adjacent structural support exists at the inferior end of the vertebral body. Hulme et al. [37] observed relatively denser trabecular architecture at the postero-inferior end compared to the postero-superior end of a human vertebral body. These observations suggest a greater involvement of the inferior end plate in load bearing than the superior end plate for a vertebral body and may explain the higher sensitivity of ultimate strains to the inferior than the superior endplate topography.
Finally, the strong association of endplate topography with structural ductility can also be a factor in the design of natural and synthetic vertebral spacers used in spinal fusion and consequently affect implant subsidence [38]. However, it remains to be seen whether the accuracy of measurement of vertebral endplate geometry using the resolution of clinically available imaging modalities will be sufficient for this goal.
One of the limitations of the study is the assumption of linear, elastic, isotropic properties of intervertebral disc for D-layer models. Human intervertebral discs exhibit complex material behavior [39] and stress values and distributions resulting from models including such complexity may differ from those reported in this study. However, the stiffness value used for boundary layer in W-layer models is orders of magnitude higher than that for D-layer models. Therefore, it is unlikely that the trends discussed while comparing W-layer and D-layer models in this study will be significantly different by including complex material models of intervertebral discs. This study is also limited to only axial compression of whole human vertebra. The results may be different for other physiologically relevant modes of loading such as bending and fatigue.
In conclusion, our study has demonstrated the association of strength and stiffness of human whole vertebral bodies with trabecular stress distribution parameters. In addition to the strength and stiffness, structural ductility of whole vertebrae was measured and found to be sensitive to the stiffness properties of filler layers, which roughly represent disc-like versus bone-like materials. Further, ductility measures are significantly influenced by the surface topography of vertebral endplates. Further understanding of the mechanisms underlying vertebral endplate topography variations and their interaction with regional cancellous bone properties may provide insight into the etiology of vertebral fractures.
ACKNOWLEDGEMENT
This publication was, in part, made possible by Grant Number AR049343 from the National Institutes of Health. Its contents are solely the responsibility of the authors and do not necessarily represent the official views of the NIH.
Footnotes
Publisher's Disclaimer: This is a PDF file of an unedited manuscript that has been accepted for publication. As a service to our customers we are providing this early version of the manuscript. The manuscript will undergo copyediting, typesetting, and review of the resulting proof before it is published in its final citable form. Please note that during the production process errors may be discovered which could affect the content, and all legal disclaimers that apply to the journal pertain.
REFERENCES
- [1]. http://www.niams.nih.gov/Health_Info/Bone/Osteoporosis/
- [2].Melton LJ, Lane AW, Cooper C, Eastell R, Ofallon WM, Riggs BL. Prevalence and incidence of vertebral deformities. Osteoporosis International. 1993;3:113–119. doi: 10.1007/BF01623271. [DOI] [PubMed] [Google Scholar]
- [3].Nevitt MC, Ross PD, Palermo L, Musliner T, Genant HK, Thompson DE. Association of prevalent vertebral fractures, bone density, and alendronate treatment with incident vertebral fractures: Effect of number and spinal location of fractures. Bone. 1999;25:613–619. doi: 10.1016/s8756-3282(99)00202-1. [DOI] [PubMed] [Google Scholar]
- [4].Ross PD. Clinical consequences of vertebral fractures. American Journal of Medicine. 1997;103:30S–42S. doi: 10.1016/s0002-9343(97)90025-5. [DOI] [PubMed] [Google Scholar]
- [5].Cheng XG, Nicholson PH, Boonen S, Lowet G, Brys P, Aerssens J, van der Perre G, Dequeker J. Prediction of vertebral strength in vitro by spinal bone densitometry and calcaneal ultrasound. Journal of Bone and Mineral Research. 1997;12:1721–1728. doi: 10.1359/jbmr.1997.12.10.1721. [DOI] [PubMed] [Google Scholar]
- [6].Singer K, Edmondston S, Day R, Breidahl P, Price R. Prediction of thoracic and lumbar vertebral body compressive strength: Correlations with bone mineral density and vertebral region. Bone. 1995;17:167–174. doi: 10.1016/s8756-3282(95)00165-4. [DOI] [PubMed] [Google Scholar]
- [7].McBroom RJ, Hayes WC, Edwards WT, Goldberg RP, White AA. Prediction of vertebral body compressive fracture using quantitative computed-tomography. Journal of Bone and Joint Surgery-American Volume. 1985;67A:1206–1214. [PubMed] [Google Scholar]
- [8].McCubbrey DA, Cody DD, Peterson EL, Kuhn JL, Flynn MJ, Goldstein SA. Static and fatigue failure properties of thoracic and lumbar vertebral bodies and their relation to regional density. Journal of Biomechanics. 1995;28:891–899. doi: 10.1016/0021-9290(94)00155-w. [DOI] [PubMed] [Google Scholar]
- [9].Mosekilde L, Bentzen SM, Ortoft G, Jorgensen J. THE predictive value of quantitative computed-tomography for vertebral body compressive strength and ash density. Bone. 1989;10:465–470. doi: 10.1016/8756-3282(89)90080-x. [DOI] [PubMed] [Google Scholar]
- [10].Ortoft G, Mosekilde L, Hasling C. Estimation of vertebral body strength by dual-photon absorptiometry in elderly individuals - comparison between measurements of total vertebral and vertebral body bone-mineral. Bone. 1993;14:667–673. doi: 10.1016/8756-3282(93)90090-w. [DOI] [PubMed] [Google Scholar]
- [11].Cranney A, Jamal SA, Tsang JF, Josse RG, Leslie WD. Low bone mineral density and fracture burden in postmenopausal women. Canadian Medical Association Journal. 2007;177:575–580. doi: 10.1503/cmaj.070234. [DOI] [PMC free article] [PubMed] [Google Scholar]
- [12].Buckley JM, Loo K, Motherway J. Comparison of quantitative computed tomography-based measures in predicting vertebral compressive strength. Bone. 2007;40:767–774. doi: 10.1016/j.bone.2006.10.025. [DOI] [PMC free article] [PubMed] [Google Scholar]
- [13].Eswaran SK, Gupta A, Adams MF, Keaveny TM. Cortical and Trabecular Load Sharing in the Human Vetebral Body. Journal of Bone and Mineral Research. 2006;21:307–314. doi: 10.1359/jbmr.2006.21.2.307. [DOI] [PubMed] [Google Scholar]
- [14].Kopperdahl DL, Morgan EF, Keaveny TM. Quantitative computed tomography estimates of the mechanical properties of human vertebral trabecular bone. Journal of Orthopaedic Research. 2002;20:801–805. doi: 10.1016/S0736-0266(01)00185-1. [DOI] [PubMed] [Google Scholar]
- [15].Kopperdahl DL, Pearlman JL, Keaveny TM. Biomechanical consequences of an isolated overload on the human vertebral body. Journal of Orthopaedic Research. 2000;18:685–690. doi: 10.1002/jor.1100180502. [DOI] [PubMed] [Google Scholar]
- [16].Pahr DH, Zysset PK. A comparison of enhanced continuum FE with micro FE models of human vertebral bodies. Journal of Biomechanics. 2009;42:455–462. doi: 10.1016/j.jbiomech.2008.11.028. [DOI] [PubMed] [Google Scholar]
- [17].Kim DG, Hunt CA, Zauel R, Fyhrie DP, Yeni YN. The effect of regional variations of the trabecular bone properties on the compressive strength of human vertebral bodies. Annals of Biomedical Engineering. 2007;35:1907–1913. doi: 10.1007/s10439-007-9363-1. [DOI] [PubMed] [Google Scholar]
- [18].Majumdar SR, Kim N, Colman I, Chahal AM, Raymond G, Jen H, Siminoski KG, Hanley DA, Rowe BH. Incidental vertebral fractures discovered with chest radiography in the emergency department - Prevalence, recognition, and osteoporosis management in a chohort of elderly patients. Archives of Internal Medicine. 2005;165:905–909. doi: 10.1001/archinte.165.8.905. [DOI] [PubMed] [Google Scholar]
- [19].Eswaran SK, Bayraktar HH, Adams MF, Gupta A, Hoffmann PF, Lee DC, Papadopoulos P, Keaveny TM. The micro-mechanics of cortical shell removal in the human vertebral body. Computer Methods in Applied Mechanics and Engineering. 2007;196:3025–3032. [Google Scholar]
- [20].Eswaran SK, Gupta A, Keaveny TM. Locations of bone tissue at high risk of initial failure during compressive loading of the human vertebral body. Bone. 2007;41:733–739. doi: 10.1016/j.bone.2007.05.017. [DOI] [PMC free article] [PubMed] [Google Scholar]
- [21].Ross W, Cody DD, Hazle JD. Design and performance characteristics of a digital flat-panel computed tomography system. Medical Physics. 2006;33:1888–1901. doi: 10.1118/1.2198941. [DOI] [PubMed] [Google Scholar]
- [22].Kim DG, Dong XN, Cao T, Baker KC, Shaffer RR, Fyhrie DP, Yeni YN. Evaluation of filler materials used for uniform load distribution at boundaries during structural biomechanical testing of whole vertebrae. Journal of Biomechanical Engineering-Transactions of the Asme. 2006;128:161–165. doi: 10.1115/1.2133770. [DOI] [PubMed] [Google Scholar]
- [23].Homminga J, Huiskes R, Van Rietbergen B, Ruegsegger P, Weinans H. Introduction and evaluation of a gray-value voxel conversion technique. Journal of Biomechanics. 2001;34:513–517. doi: 10.1016/s0021-9290(00)00227-x. [DOI] [PubMed] [Google Scholar]
- [24].Bourne BC, van der Meulen MCH. Finite element models predict cancellous apparent modulus when tissue modulus is scaled from specimen CT-attenuation. Journal of Biomechanics. 2004;37:613–621. doi: 10.1016/j.jbiomech.2003.10.002. [DOI] [PubMed] [Google Scholar]
- [25].Hoffler CE, Moore KE, Kozloff K, Zysset PK, Goldstein SA. Age, gender, and bone lamellae elastic moduli. Journal of Orthopaedic Research. 2000;18:432–437. doi: 10.1002/jor.1100180315. [DOI] [PubMed] [Google Scholar]
- [26].Yeni YN, Hou FJ, Vashishth D, Fyhrie DP. Trabecular shear stress in human vertebral cancellous bone: intra- and inter-individual variations. Journal of Biomechanics. 2001;34:1341–1346. doi: 10.1016/s0021-9290(01)00089-6. [DOI] [PubMed] [Google Scholar]
- [27].Yeni YN, Kim DG, Divine GW, Johnson EM, Cody DD. Human cancellous bone from T12-L1 vertebrae has unique microstructural and trabecular shear stress properties. Bone. 2009;44:130–136. doi: 10.1016/j.bone.2008.09.002. [DOI] [PMC free article] [PubMed] [Google Scholar]
- [28].Yeni YN, Zelman EA, Divine GW, Kim DG, Fyhrie DP. Trabecular shear stress amplification and variability in human vertebral cancellous bone: Relationship with age, gender, spine level and trabecular architecture. Bone. 2008;42:591–596. doi: 10.1016/j.bone.2007.11.011. [DOI] [PMC free article] [PubMed] [Google Scholar]
- [29].Bury K. Statistical Distributions In Engineering. Cambridge University Press; 2006. [Google Scholar]
- [30].Fyhrie DP, Hoshaw SJ, Hamid MS, Hou FJ. Shear stress distribution in the trabeculae of human vertebral bone. Annals of Biomedical Engineering. 2000;28:1194–1199. doi: 10.1114/1.1318928. [DOI] [PubMed] [Google Scholar]
- [31].Buckley JM, Leang DC, Keaveny TM. Sensitivity of vertebral compressive strength to endplate loading distribution. Journal of Biomechanical Engineering-Transactions of the Asme. 2006;128:641–646. doi: 10.1115/1.2241637. [DOI] [PubMed] [Google Scholar]
- [32].Langrana NA, Kale SP, Edwards WT, Lee CK, Kopacz KJ. Measurements and analyses of the effects of adjacent end plate curvatures on vertebral stresses. The Spine Journal. 2006;6:267–278. doi: 10.1016/j.spinee.2005.09.008. [DOI] [PubMed] [Google Scholar]
- [33].Tayebi N, Polycarpou AA. Modeling the effect of skewness and kurtosis on the static friction coefficient of rough surfaces. Tribology International. 2004;37:491–505. [Google Scholar]
- [34].Hulme PA, Ferguson SJ, Boyd SK. Determination of vertebral endplate deformation under load using micro-computed tomography. Journal of Biomechanics. 2008;41:78–85. doi: 10.1016/j.jbiomech.2007.07.018. [DOI] [PubMed] [Google Scholar]
- [35].Zhao FD, Pollintine P, Hole BD, Adams MA, Dolan P. Vertebral fractures usually affect the cranial endplate because it is thinner and supported by less-dense trabecular bone. Bone. 2009;44:372–379. doi: 10.1016/j.bone.2008.10.048. [DOI] [PubMed] [Google Scholar]
- [36].Grant JP, Oxland TR, Dvorak MF. Mapping the structural properties of the lumbosacral vertebral endplates. Spine. 2001;26:889–896. doi: 10.1097/00007632-200104150-00012. [DOI] [PubMed] [Google Scholar]
- [37].Hulme PA, Boyd SK, Ferguson SJ. Regional variation in vertebral bone morphology and its contribution to vertebral fracture strength. Bone. 2007;41:946–957. doi: 10.1016/j.bone.2007.08.019. [DOI] [PubMed] [Google Scholar]
- [38].Lowe TG, Hashim S, Wilson LA, O’Brien MF, Smith DAB, Diekmann MJ, Trommeter J. A biomechanical study of regional endplate strength and cage morphology as it relates to structural interbody support. Spine. 2004;29:2389–2394. doi: 10.1097/01.brs.0000143623.18098.e5. [DOI] [PubMed] [Google Scholar]
- [39].Iatridis JC, Weidenbaum M, Setton LA, Mow VC. Is the nucleus pulposus a solid or a fluid? Mechanical behaviors of the nucleus pulposus of the human intervertebral disc. 30th Annual Meeting of the Scoliosis-Research-Society; Asheville, Nc. 1995. pp. 1174–1184. [DOI] [PubMed] [Google Scholar]


