

Abstract
There is significant interest in the development of methods to validate novel biomarkers for Alzheimer’s disease (AD) diagnosis. Previously, a proteomic panel of cerebrospinal fluid (CSF) biomarker candidates that differentiated AD and non-AD CSF with accuracy higher than 90% was found; information about these CSF proteins can be used to develop multiple reaction monitoring (MRM) based analytical assays, which offer the possibility of quantifying protein expression level changes in samples, as well as, validation among multiple laboratories. Here we report an MRM assay that demonstrates good linearity (average R2 = 0.969) and reproducibility (average coefficient of variance of 6.93%) for the proposed AD CSF biomarkers. MRM quantification results of Aβ1-40, Aβ1-42, retinol-binding protein and cystatin C correlated well with those from ELISA (average R2 = 0.974). Analysis shows that 12 out of 16 selected targets exhibit the same trend in protein expression as that in literature.
Keywords: Alzheimer’s disease (AD), Biomarker, Cerebrospinal fluid (CSF), Targeted proteomics, Multiple reaction monitoring (MRM)
1. Introduction
There is a need for the development of quantitative assays to measure levels of sets of molecules present in a relatively complex mixture. This need is driven by an increasing emphasis on personalized medicine and the measurement of multiplexed biomarkers present in biological fluids such as blood, saliva, cerebrospinal fluid (CSF), and urine. Such markers are being discovered for a variety of diseases including Alzheimer’s disease (AD). AD is the most common type of dementia in the elderly and its prevalence in the United States was more than 5.4 million in 2011 [1]. There has been significant effort to understand the underlying molecular pathology. Currently, treatment is focused on the delay of the progression of patients’ cognitive decline and it is believed that treatments are most effective at the earlier stages of AD [1–3]. As such, it is important to have an accurate diagnosis of AD as early as possible.
Early diagnosis of AD is difficult because of the lack of a suitably accurate antemortem diagnostic method [4] and tests with sensitivity and specificity >80% are of interest [5]. The interest in CSF [6,7] is based on brain proximity and there are many proposed CSF diagnostics markers as well as more that have been proposed after a discovery-proteomics experiment [8,9]. While it is possible to measure the levels of molecules of interest, for example biomarkers, using traditional enzyme-linked immunosorbent assays (ELISA) assays, the development of ELISAs is not well-suited to the confirmation and validation of putative biomarkers for several reasons: ELISAs require the availability of appropriate affinity reagents which are specific to the molecule or epitope of interest; these reagents can be relatively expensive to obtain; and they are not typically multiplexed - each assay is performed individually, which requires more sample to perform analysis of multiple analytes. As a complement to ELISAs, there has been interest in the use of a separations based method to facilitate the confirmation and early validation of biomarker discoveries because such methods are more cost effective to develop and once established, can be easily replicated by other laboratories. Multiple reaction monitoring (MRM) is an approach that combines a liquid phase separation with detection by mass spectrometry to measure the levels of molecules of interest and it can be multiplexed so that a single assay measures the levels of many molecules of interest [10, 11]. MRM is a targeted proteomics technique typically performed on triple quadrupole-based mass spectrometers. Generally, in this method, a certain ion of interest (a precursor ion) is transmitted to the second quadrupole and only a selected fragment ion from the precursor ion is sent to the detector. MRM assays have high sensitivity and high specificity [12]. Further, MRMs are an alternative to immunoassays for protein/peptide quantification because they demonstrate a wide dynamic range [13]. Finally, MRM assays are an ideal tool for the validation of multiple markers because the analysis time is short and they are easily multiplexed [10, 11]. A potential drawback of this approach is the time and effort needed for method development. To address this concern, the use of MRM methods based on MS3 and centralized databases of MRM transitions offers significant promise (MRM3, MRMAtlas) [14, 15] and methods with labeled standards (SISCAPA) [16, 17] can facilitate reproducibility.
One area in which the use of separations-based MRM assays can be particularly important is in the initial validation of putative biomarkers as a follow-on to a discovery-based proteomics experiment [18, 19]. Large-scale proteomics experiments are difficult to replicate precisely between laboratories. MRM assays offer an opportunity to confirm findings from proteomics experiments across laboratories as a complement to ELISA development. Previously, a panel of AD CSF marker candidates, which showed 93% sensitivity and 90% specificity in differentiating AD CSF and non-AD CSF (including normal, neurologic, and demented controls) using 2D gel electrophoresis and matrix assisted laser desorption ionization time of flight tandem mass spectrometry (MALDI TOF/TOF MS), was reported [20]. Here, we report a CSF MRM assay for the validation of many of the proteins in the proposed panel of CSF AD biomarkers. Twenty-four peptides representing the different AD CSF biomarker candidates were successfully included in the method to monitor non-depleted human CSF using nano liquid chromatography MRM tandem mass spectrometry (nLC-MRM/MS). Good analytical performance of this assay was confirmed and the day to day reproducibility of measurements was improved by using regional standards (RSs). RS is our terminology for a set of internal standards (i.e. peptides) different from the analytes of interest, that are spiked into the sample prior to LC separation to facilitate normalization over a set of experiments where the internal standard peptides have an elution profile that is well-distributed over the course of the LC run. Finally, quantitative results from MRMs of select AD biomarker candidates were found to correlate well with those from ELISAs. Therefore, these preliminary results show the potential of the method to be a new AD diagnostic method using multiple AD biomarkers, as well as a robust approach for the fast validation of AD biomarkers previously reported. This is the first report of a nLC-MRM/MS application to comparative human CSF proteomics targeting AD diagnosis.
2. Material and Methods
2. 1 CSF sample preparation
This work has been approved by the University of Delaware Institutional Review Board. A pooled-normal CSF sample was purchased from Biochemed Services (Winchester, VA) and an antemortem CSF sample from a definite AD subject (confirmed by autopsy) was provided by the Institute for Brain Aging and Dementia Tissue Repository (University of California, Irvine, CA) these samples are termed AD and non-AD. Additional antemortem CSF samples from definite AD cases and nonAD samples were provided by the Institute for Brain Aging and Dementia Tissue Repository and the National Neurological Research Specimen Bank at UCLA (samples AD1, AD2, AD3, nonAD1, nonAD2, nonAD3). Samples were shipped on dry ice and stored at −70 °C until needed. Three hundred μL of a CSF sample was loaded onto a 3000 Da cutoff filter (Microcon YM-3, Millipore, Billercia, MA) for buffer exchange. The volume was increased to 500 μL by adding 0.2 M ammonium bicarbonate and the filter unit was centrifuged at 10000 rpm for 30 minutes. This buffer exchange step was repeated twice and the retentate was dried by vacuum centrifugation. The proteins in the retentate were resuspended, denatured and reduced with 15 μL of 6.0 M urea (in 0.1 M ammonium bicarbonate) and 1 μL of 200 mM dithiothreitol (DTT, in 0.1 M ammonium bicarbonate) for 1 hour at room temperature (RT). Then, 2 μL of 200 mM iodoacetamide (in 0.1 M ammonium bicarbonate) was added and the mixture was incubated for 1 hour at RT in the dark. After quenching the remaining iodoacetamide with 2 μL of 200 mM DTT for 1 hour at RT, the solution was mixed with 75 μL of 40 mM ammonium bicarbonate and 5 μL of trypsin (Promega, Madison, WI) dissolved (20 μg in 30 μL) in its dissolution buffer (Promega), for the protein digest. The mixture was incubated for 14 hours at 37 °C and 1 μL of 20% formic acid was added. The digested sample was dried by vacuum centrifugation and then dissolved in 60 μL of 0.1% formic acid. The reconstituted sample was diluted 50× with 0.1% formic acid and (when appropriate) a tryptic digest of yeast alcohol dehydrogenase (1 pmol/μL, Michrom Bioresources, Auburn, CA) was spiked into the diluted sample to 10 fmol/μL as RSs.
2.2 Nano liquid chromatography tandem mass spectrometry and nLC-MRM/MS
A portion (15 μL, if not otherwise specified) of the diluted sample was separated on a Dionex 3000 nLC system (Sunnyvale, CA) with an Acclaim PepMap 100 C18 trap column (300 μm × 5 mm, 5 μm, Dionex) for on-line desalting (2% aqueous acetonitrile solution with 0.1% formic acid, flow rate of 30 μL/min for 5 minutes) and an Acclaim PepMap 100 C18 analytical column (75 μm × 15 cm, 3 μm, Dionex, flow rate of 250 nL/min). Peptides were eluted over a gradient of 2–50% acetonitrile with 0.1% formic acid for 100 min and the eluent was directly introduced into an Applied Biosystems 4000 QTRAP MS (Foster City, CA) through a Nanospray II source (Applied Biosystems, gas1 of 14 psi and spray voltage of 2.8 kV). The MS was operated in data-dependent scan mode with Analyst v1.5 software (Applied Biosystems), set to acquire MS/MS spectra of the five most intense ions in a survey scan (full MS scan or MRM scan). Data were searched within the NCBInr protein database using ProteinPilot software (Applied Biosystems) with either the Paragon algorithm (Applied Biosystems) or the Mascot search engine (v. 2.2, Matrix Science, Boston, MA) for peptide/protein identification (at confidence interval (CI) ≥ 95%) and also verified manually. In the case of the nLC-MRM/MS study, each sample was analyzed twice by two different MRM acquisition methods (“abundant method” and “non-abundant method”) composed of different sets of targets to maximize sensitivity and specificity (abundant targets versus non-abundant targets as indicated in Table 1). All analyses were carried out in triplicate. Target MRM transition candidates, extracted from experimental observations previously reported [20], or generated in silico, were tested. Verified transitions were merged into one of the two MRM acquisition methods based on their peak areas and retention times to prevent undersampling of targets. The list of target biomarker candidates (including MRM transitions) and their corresponding RSs is given in Table 1. Note that the transitions are intended to measure changes in levels of specific peptides from a given protein that are believed to be diagnostic [20] rather than changes in the levels of intact proteins. An additional test was carried out in the presence of RSs to study their influence on target quantification (see Supplemental Table 1, “serial CSF addition” test). For nLC-MRM/MS of Aβ1-40, retinol-binding protein (RBP) and cystatin C (Cys C), MRM transitions representing the individual proteins/peptides were monitored under the same conditions as the analyses of CSF digest samples (see Supplemental Table 2).
Table 1.
Summary of targets in nLC-MRM/MS.
| Target Codes | Targeted Proteins | References | Signature Peptides | Preca (m/z) | Fragb (m/z) | CEc (V) | RTd (min) | ABe/NABf | RSg # |
|---|---|---|---|---|---|---|---|---|---|
| albumin1 | Albumin-1 | 20 | LVNEVTEFAK | 575.3 | 694.4 | 33.8 | 32 | AB | 1 |
| albumin123 | Albumin-1/albumin-2/albumin-3 | AVMDDFAAFVEK | 671.8 | 171.1 | 38.6 | 71 | AB | 6 | |
| albumin3 | Albumin-3 | EFNAETFTFHAD | 714.8 | 838.4 | 40.7 | 62 | NAB | 5 | |
| ACT | α-1-antichymotrypsin | 15 | LYGSEAFATDFQDSAAAK | 946.4 | 1053.5 | 52.3 | 60 | NAB | 5 |
| a-1-antitrypsin12 | α-1-antitrypsin-1/α-1-antitrypsin-2 | 16, 17, 20 | VFSNGADLSGVTEEAPLK | 918.3 | 1030.5 | 50.9 | 60 | NAB | 5* |
| a-1-antitrypsin2 | α-1-antitrypsin-2 | LSITGTYDLK | 555.8 | 201.1 | 32.8 | 40 | AB | 2 | |
| antithrombin III | Antithrombin III | 15 | VAEGTQVLELPFK | 715.9 | 171.1 | 40.8 | 64 | NAB | 6 |
| apo E | Apolipoprotein E | 20, 23 | AATVGSLAGQPLQER | 749.4 | 827.4 | 42.5 | 27 | NAB | 1 |
| apo J1 | Apolipoprotein J-1 | 20 | EILSVDCSTNNPSQAK | 881.9 | 243.1 | 49.1 | 23 | NAB | 1 |
| apo J23 | Apolipoprotein J-2/Apolipoprotein J-3 | ASSIIDELFQDR | 697.3 | 922.4 | 39.9 | 75 | AB | 6 | |
| apo A I | Apolipoprotein A I | 16, 23 | VSFLSALEEYTK | 693.9 | 782.4 | 39.7 | 78 | AB | 6 |
| ceruloplasmin | Ceruloplasmin | 17 | DIASGLIGPLIICK | 735.4 | 229.1 | 41.8 | 77 | NAB | 6 |
| chromagranin A | Chromagranin A | 22, 24 | SGEATDGARPQALPEPMQESK | 733.7 | 945.4 | 35.3 | 22 | NAB | 1 |
| CC 3 | Complement component 3 | 20 | LVAYYTLIGASGQR | 756.4 | 902.5 | 42.8 | 60 | NAB | 5 |
| cystatin C/Cys C | Cystatin C | 24, 25 | ALDFAVGEYNK | 613.8 | 709.3 | 35.7 | 43 | AB | 3 |
| fibrin beta | Fibrin beta | 17, 20 | HQLYIDETVNSNIPTNLR | 709.7 | 827.5 | 34.2 | 52 | NAB | 3 |
| IG HC | Immunoglobulin heavy chain | 17, 20 | NQVSLTCLVK | 581.3 | 820.5 | 34.1 | 36 | NAB | 2 |
| IG LC | Immunoglobulin light chain | 20 | VDNALQSGNSQESVTEQDSK | 712.8 | 893.3 | 34.4 | 20 | NAB | 1 |
| plasminogen NT | Plasminogen | 20 | FVTWIEGVMR | 619.3 | 247.1 | 36 | 69 | NAB | 6 |
| proSAAS | proSAAS | 20 | ILAGSADSEGVAAPR | 707.4 | 227.2 | 40.4 | 21 | NAB | 1 |
| RBP NT/RBP | Retinol-binding protein | 16, 17, 20, 26 | YWGASFLQK | 599.9 | 693.4 | 35 | 68 | NAB | 6 |
| transthyretin1 | Transthyretin-1 | 16, 20 | TSESGELHGLTTEEEFVEGIYK | 819.1 | 189.1 | 39 | 67 | NAB | 6 |
| transthyretin12 | Transthyretin-1/Transthyretin-2 | GSPAINVAVHVFR | 456.3 | 145.1 | 23.1 | 41 | NAB | 2 | |
| VDBP | Vitamin D-binding protein | 17, 20, 26 | KFPSGTFEQVSQLVK | 565.6 | 574.4 | 27.9 | 59 | NAB | 4 |
| RS 1 | Yeast alcohol dehydrogenase | ANGTTVLVGMPAGAK | 694.1 | 631.4 | 39.7 | 28 | Both | 1 | |
| RS 2 | SISIVGSYVGNR | 626.4 | 752.3 | 36.3 | 38 | Both | 2 | ||
| RS 3 | VLGIDGGEGKEELFR | 810.2 | 809.9 | 38.7 | 50 | Both | 3 | ||
| RS 4 | ATDGGAHGVINVSVSEAAIEASTR | 771.6 | 676.5 | 37.0 | 56 | NAB | 4 | ||
| RS 5 | VVGLSTLPEIYEK | 724.8 | 1079.5 | 41.2 | 62 | NAB | 5 | ||
| RS 6 | VAISGAAGGLGSLAVQYAK | 867.3 | 1163.9 | 48.4 | 63 | Both | 6 | ||
Precursor ion in a MRM transition;
Fragment ion in a MRM transition;
Collision energy for a MRM transition;
Retention time;
Abundant targets acquisition method;
Non-abundant targets acquisition method;
Regional standard;
RS 5 was used for the normalization of a-1-antitrypsin12 whose peak area was larger than others nearby.
2.3 LC-MRM/MS of Aβ1-42
10 μg of Aβ1-42 (Covance, Dedham, MA) was dissolved in 400 μL of an aqueous ammonium hydroxide solution (30% as ammonia), additionally diluted 1000 times with water and serially diluted to prepare working solutions at various concentrations (Supplemental Table 2). A working solution was introduced onto a PLRP-S 100Ǻ column (150 × 2.1 mm, 3 μm, Varian, Palo Alto, CA) at a flow rate of 200 μL/min on an Agilent 1100 LC (Santa Clara, CA) and the mobile phase was changed linearly from 0% to 90% acetonitrile in water with an aqueous ammonium hydroxide solution (30% as ammonia), then additionally diluted with water (1000x) for 50 minutes. The column eluent was delivered into an Applied Biosystems QTRAP MS via Turbospray II (Applied Biosystems, gas1 of 20 psi, gas 2 of 20 psi, temperature of 450 °C, and spray voltage of 5200 V). The MS was operated in negative ion data-dependent MRM/MS scan mode with Analyst v1.4.2 software, set to acquire MS/MS spectra of the three most intense ions per MRM scan. MS data were searched within the NCBInr protein database using Mascot; identifications (CI% ≥ 95) were also verified manually. All samples were analyzed in triplicate. Information regarding the Aβ1-42 MRM transition is listed in Supplemental Table 2.
2.4 ELISA and Luminex assays
ELISA kits for Aβ1-40 (Covance), Aβ1-42 (Covance), RBP (Immunology Consultants Laboratory, Newberg, OR), and Cys C (BioVendor, Modrice, Czech Republic) were purchased and used per manufacturer’s instructions. Concentration ranges of individual ELISAs were different (Supplemental Table 2) and colorimetric responses of final solutions were measured at 620 nm (Aβ1-40 and Aβ1-42) or 450 nm (RBP and Cys C) using a SpectraMax M5 microplate reader (Molecular Devices, Sunnyvale, CA). For RBP and Cys C, levels in the definite AD CSF sample and in the pooled normal CSF sample were measured by ELISA where each CSF sample was diluted (10 for RBP and 100× for Cys C) as appropriate for each kit. All samples and all standards were analyzed in triplicate. Luminex assays for Aβ40, Aβ42 were performed according to manufacturer’s instructions.
3. Results
3. 1 Test of nLC-MRM/MS performance
nLC-MRM/MS was used to measure 24 total targets (Supplementary Information Fig. 1). Targets demonstrated peak areas that span about four orders of magnitude in these samples. To measure the quantitative linearity and reproducibility of these assays, we tested the methods with different volumes (5, 10, and 15 μL) of a pooled normal CSF digest sample and measured the resulting changes in peak areas for each target. Such an experiment allows the measurement of different levels of all analytes of interest changing over a known amount. As a result, 23 of 24 MRM target transitions showed good reproducibility and quantitative linearity (average coefficient of variance (CV) 6.93 ± 5.48% and average R2 value 0.969 ± 0.046, Supplemental Table 3 and Supplemental Table 4). Fibrin beta had a particularly weak signal from the 5 μL experiments and did not show good linearity.
3.2 Evaluation of the day to day reproducibility of nLC-MRM/MS and RSs
To evaluate the day to day reproducibility of the method and the potential impact of heavy nLC use between MRM assay measurements, we analyzed the same pooled CSF sample at two times, but separated by an interval of 10 days. The nLC-MS/MS system was used continuously for a week (between tests) and was then not used for an additional three days. When the sample without RSs was tested, seven out of 24 targets produced a statistical difference (p<0.05) in peak areas between the interval (Fig. 1A and Supplemental Table 5). The reproducibility was measured by studying the change in peak areas between the first test (blue bars in Figure 1) and the second test (green bars in Figure 1) considering triplicate measurements at each time. When the sample with RSs was tested, each target peak area was normalized by the peak area of its assigned RS. With the help of this normalization, the number of target transitions with low day to day reproducibility between the same interval decreased from seven to two (Fig. 1B and Supplemental Table 5). At the same time, the number of target transitions which showed CV values (including two different time points, in triplicate/time point) more than 10% was also reduced from ten to four by the RS normalization (see Supplemental Table 6).
Fig. 1.

Evaluation of the day to day reproducibility of nLC-MRM/MS.
Day to day reproducibility tests of the method were carried out with an interval of 10 days between measurements. When the sample was tested without regional standards, seven target peak areas (surrounded by red line) showed lower reproducibility (A). When the sample with regional standards was tested, only two targets (surrounded by red line) showed low reproducibility between the interval in their regional standard-normalized peak areas (B). Standard deviation bars in this figure were calculated from triplicate results of the same sample on the same day.
We also studied the impact of the presence of RSs on MRM quantitation in a set of samples that included a mixture of AD and non-AD CSF. RS-normalized target peak areas were used for the data processing and average R2 value of targets was 0.933 ± 0.019 (Supplemental Table 4) which confirmed that there is no significant impact on MRM quantitation by the inclusion of the RSs.
3.3 AD CSF versus NON-AD CSF
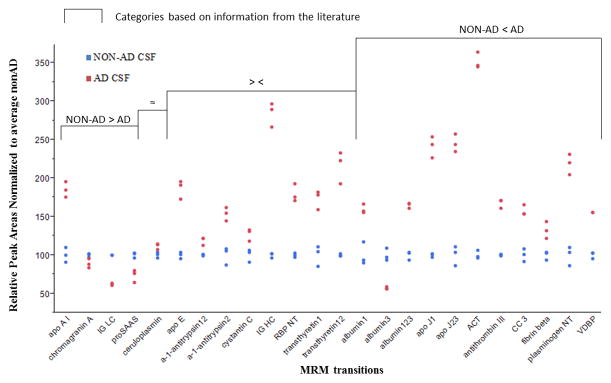
An antemortem, definite AD CSF digest sample and a pooled normal CSF digest sample were analyzed in triplicate by the nLC-MRM/MS method. Both samples used RSs and RS-normalized peak areas of each target were compared. As shown in Fig. 2, 16 of 24 targets are consistent with the literature [20,22–30] regarding their expression in AD versus non-AD CSF; and 12 of these 16 targets produced the same patterns of alteration in AD CSF compared to non-AD CSF – that is, if the literature reports a particular molecule as elevated in AD CSF, we also observed an increase in expression in this study. Also, 43 out of 48 (24 transitions from non-AD CSF and 24 transitions from AD CSF) target transitions showed CV values (within each replicate) less than 10% (See Supplemental Table 7). In a separate study, we performed the same measurement on three additional AD and three additional non-AD CSF samples (Figure 3). Figure 3 shows the average of triplicate measurements from individual CSF samples (AD and nonAD). Here, we observe that the data is also consistent with the literature as well as consistent with previous observations with a single sample. Only two proteins in this case demonstrate observations that are in contrast with literature observations. ApoA1 shows elevated levels in AD CSF compared to nonAD CSF and levels of albumin3 are observed to be lower in AD CSF than nonAD CSF.
Fig. 2.

Comparisons of regional standard-normalized peak areas of individual targets from AD CSF and non-AD CSF.
Regional standard-normalized peak areas of individual targets from a confirmed AD CSF sample and those from a pooled normal CSF sample were obtained (in triplicate) from their nLC-MRM/MS analyses. Targets were categorized by the information of their level alterations in AD CSF compared to non-AD CSF in literature (NON-AD > AD: level-down; ≈: no change; ><: literature reports conflicting information; NON-AD < AD: level-up). Taking aside those with conflicting literature, 12 out of 16 targets were consistent with their categories.
Fig. 3.
Comparisons of additional AD CSF and non-AD CSF samples.
Average of triplicate measures of regional standard-normalized peak areas of individual targets from a three confirmed AD CSF samples and three nonAD CSF samples. Data are normalized to the average nonAD CSF value.
A principal components analysis of the three AD and three nonAD CSF samples based on the MRM observations demonstrates a clear separation of samples with the first component comprising 86.9% of the difference in sample sets and the second component comprising 6.36% of the difference in samples (Supplementary Information Figure 2).
3. 4 Comparison of nLC-MRM/MS with ELISA and Luminex
Four well-known AD biomarker candidates (Aβ1-40, Aβ1-42, RBP and Cys C) were analyzed using MRM and ELISA. When individual biomarker results from both methods were compared, a good linear correlation (average R2 of 0.974 ± 0.029) was observed (Supplementary Information Fig. 3 middle). Good correlation between the methods is seen over only a portion of the concentration range tested. This may be a result of the limited dynamic range of ELISA compared to MRM. A Deming regression was also carried out and produced a similar result with that from linear regression in each biomarker. Additionally, the residual of each mean of triplicate from the Deming regression line was divided by the residual standard deviation (Sy|x) value from each regression. Then, the calculated value (standardized residual value) was plotted against its estimated true value, or the mean of results by MRM and ELISA (Supplementary Information Fig. 3 right). All standardized residual values in residual plots were located within ±1.96 (corresponding to a 95% confidence). MRM quantification results of RBP and Cys C from the definite AD CSF sample and from the pooled normal CSF sample were compared with those from ELISA. As shown in Fig. 4, the trend of measurement of RBP and Cys C in AD CSF compared to non-AD CSF was the same from both methods, although the absolute quantification results were different (Supplemental Table 8). Nonetheless, the concentration ratios (AD/non-AD) from RS-normalized nLC-MRM/MS results of both biomarkers were very similar with their counterparts from ELISA (Supplemental Table 8).
Fig. 4.

Comparisons of nLC-MRM/MS with ELISA using AD and normal CSF.
Quantification results of each biomarker candidate (A: RBP and B: Cys C) were obtained from the analyses of a confirmed AD CSF sample and a pooled normal AD CSF sample using the nLC-MRM/MS method with RSs and ELISA. Relative values are plotted as percentages of the concentration of the biomarker candidate in AD CSF divided by the concentration in non-AD CSF. The values are then normalized to the concentration in non-AD CSF. Absolute values are available in Supplementary Information.
Luminex assays performed on Aβ1-40 and Aβ1-42 and compared to ELISA results confirmed levels of these molecules (Supplementary Information).
4. Discussion
One important aspect of AD CSF biomarker studies is the issue that a specific protein isoform or peptide may be a useful marker while other isoforms or peptides from the same protein may not be indicative of disease [21]. MRM, perhaps more than immunoassays, offers the sensitivity and specificity to distinguish such isoforms and peptides. A second important consideration in proteomic studies is the need to measure peptides that may be present across a wide dynamic range [19].
We studied (data not shown) the reproducibility of the sample preparation methods and observed a CV of 10.1% (n=3) and 10.8% (n=3) based on two synthesized peptides, HSTGAASTANFLR and HSTGAASTANFFR, respectively. Reproducibility and quantitative linearity of the MRM/MS method was also studied (Supplemental Tables 3 and 4) and suggested that variability introduced by sample preparation and the MRM assay itself are similar. We applied regional standards to further enhance day-to-day reproducibility of the assay and tested if the inclusion of RSs affected the quantitative linearity of the targets. Interestingly, the RS-normalized peak area of vitamin D-binding protein (VDBP) was reduced substantially after the interval. This observation is a result of an increase of the peak area of RS4 assigned to VDBP. The reason for this could be explained by 1) the generation of any compound which shares the retention time and the MRM transition of RS4 by degradation from a precursor during storage of the sample or 2) the degradation of compounds during storage of the sample that co-elute with RS4 and are more hydrophobic than RS4.
AD-confirmed CSF and pooled, normal CSF were interrogated by MRM/MS for 24 biomarker candidate targets. There are 8 proteins proposed in the literature as biomarkers for which there are conflicting reports on expression level (both up and down), highlighting the importance of developing MRM assays to quantify and validate biomarkers [20,22–30] and as a complement to ELISAs to help clarify the literature. Taking aside these 8 molecules for which the literature is conflicted, our comparisons between AD CSF and non-AD CSF demonstrate that 12 out of the remaining 16 targets (75%) were consistent with literature (Fig. 2). We are unsure of the reason why four of the targets are not consistent with the literature. The peptide from ceulosplasmin is similar to one from haephaestin which may confound that result and post-translational modifications impacting these peptides could also impact the observations.
For method validation, four well-known AD biomarkers (Aβ1-40, Aβ1-42, RBP and Cys C) were analyzed using MRM and ELISA and their results showed good correlation (Supplementary Information Fig. 3). One challenge with Aβ1-42 MRM assay development is the possibility of carry-over [31–32]. To address this, we employ high pH (pH 11) mobile phases, a high pH-stable monolithic column, and negative ion mode. MRM transitions for RBP and Cys C yielded the same sensitivity and a wider linear dynamic range compared to their respective ELISAs (Supplementary Information Fig. 3) and concentration ratios (AD/non-AD) of RS-normalized MRM results of both markers were the same as those measured by ELISA (Fig. 4).
One issue that can impact variability in MRM quantitation relates to modifications of the target peptides. For example, the albumin3 peptide (EFNATFTFHAD) is non-specifically cleaved and the VDBP peptide (KFPSGTFEQVSQLVK) contains a missed cleavage. While we observed good reproducibility using our sample preparation and MRM method, more careful control for such modifications may be important for broader applicability.
5. Conclusions
A nLC-MRM/MS method monitoring 24 peptides representing AD biomarker candidates from non-depleted human CSF with RSs spiked was developed. It showed good analytical performance as well as good correlation with ELISA. Additionally, its advantages in method development time and dynamic range were confirmed. Therefore, the method presented here has potential not only to facilitate the validation of previously reported multiple AD biomarkers, but also to be a new diagnostic method for AD targeting multiple markers. This is the first report of a nLC-MRM/MS application to comparative human CSF proteomics targeting AD diagnosis.
Supplementary Material
Highlights.
We develop a multiple reaction monitoring (MRM) assay for possible Alzheimer disease biomarkers.
MRM assay offers good linearity for peptide analytes of interest.
MRM assay results are similar to results from ELISA assays.
Acknowledgments
We gratefully acknowledge the National Institutes of Health (R01MH59926, 2P20RR016472, 5P30RR031160), the New York State Office of Science, Technology, and Academic Research, and the Institute for the Study of Aging for support of this work. We thank Diane Wuest for technical assistance.
Abbreviations
- AD
Alzheimer’s disease
- CSF
cerebrospinal fluid
- Aβ
amyloid eta
- MS
mass spectrometry
- 2DE
2D gel electrophoresis
- MALDI-TOF/TOF MS
matrix assisted laser desorption ionization tandem time of flight mass spectrometry
- MRM
multiple reaction monitoring
- nLC-MRM/MS
nano liquid chromatography multiple reaction monitoring tandem mass spectrometry
- RS
regional standard
- ELISA
enzyme-linked immunosorbent assay
- DTT
dithiothreitol
- RT
room temperature
- CI
confidence interval
- RBP
retinol-binding protein
- Cys C
cystatin C
- CV
coefficient of variance
- Sy|x
the residual standard deviation
- VDBP
vitamin D-binding protein
Footnotes
Publisher's Disclaimer: This is a PDF file of an unedited manuscript that has been accepted for publication. As a service to our customers we are providing this early version of the manuscript. The manuscript will undergo copyediting, typesetting, and review of the resulting proof before it is published in its final citable form. Please note that during the production process errors may be discovered which could affect the content, and all legal disclaimers that apply to the journal pertain.
References
- 1.Alzheimer’s Association. [Accessed October 2011];Alzheimer’s disease facts and figures. 2011 http://www.alz.org/downloads/Facts_Figures_2011.pdf.
- 2.Doody RS, Stevens JC, Beck C, Dubinsky RM, Kaye JA, Gwyther L, Mohs LRC, Thal LJ, Whitehouse PJ, DeKosky ST, Cummings JL. Neurology. 2001;56:1154. doi: 10.1212/wnl.56.9.1154. [DOI] [PubMed] [Google Scholar]
- 3.Gifford DR, Cummings JL. Neurology. 1999;52:224. doi: 10.1212/wnl.52.2.224. [DOI] [PubMed] [Google Scholar]
- 4.Arnold SE, Hyman BT, Flory J, Damaiso AR, van Hoesen GW. Cereb Cortex. 1991;1:103. doi: 10.1093/cercor/1.1.103. [DOI] [PubMed] [Google Scholar]
- 5.The Ronald and Nancy Reagan Research Institute of the Alzheimer’s Association. The National Institute on Aging Working Group. Neurobiol Aging. 1998;19:109. [PubMed] [Google Scholar]
- 6.Rohlff C. Electrophoresis. 2000;21:1227. doi: 10.1002/(SICI)1522-2683(20000401)21:6<1227::AID-ELPS1227>3.0.CO;2-L. [DOI] [PubMed] [Google Scholar]
- 7.Romeo MJ, Espina V, Lowenthal M, Espina BH, Petricoin EF, Liotta LA. Expert Rev Proteomics. 2005;2:57. doi: 10.1586/14789450.2.1.57. [DOI] [PubMed] [Google Scholar]
- 8.Blennow K, Hampel H. Lancet Neurol. 2003;2:605. doi: 10.1016/s1474-4422(03)00530-1. [DOI] [PubMed] [Google Scholar]
- 9.Galasko D. J Alzheimers Dis. 2005;8:339. doi: 10.3233/jad-2005-8403. [DOI] [PubMed] [Google Scholar]
- 10.Carr SA, Anderson L. Clin Chem. 2008;54:1749. doi: 10.1373/clinchem.2008.114686. [DOI] [PMC free article] [PubMed] [Google Scholar]
- 11.Paulovich AG, Whiteaker JR, Hoofnagle AN, Wang P. Proteomics Clin Appl. 2008;2:1386. doi: 10.1002/prca.200780174. [DOI] [PMC free article] [PubMed] [Google Scholar]
- 12.Lange V, Picotti P, Domon B, Aebersold R. Mol Syst Bol. 2008;4:222. doi: 10.1038/msb.2008.61. [DOI] [PMC free article] [PubMed] [Google Scholar]
- 13.Hoofnagle AN, Becker JO, Wener MH, Heinecke JW. Clin Chem. 2008;54:1796. doi: 10.1373/clinchem.2008.109652. [DOI] [PMC free article] [PubMed] [Google Scholar]
- 14.Fortin T, Salvador A, Charrier JR, Lenz C, Bettsworth F, Lacoux X, Choquet-Kastylevsky G, Lemoine J. Anal Chem. 2009;81:9343. doi: 10.1021/ac901447h. [DOI] [PubMed] [Google Scholar]
- 15.Picotti P, Lam H, Campbell D, Deutsch EW, Mirzaei H, Ranish J, Domon B, Aebersold R. Nat Methods. 2008;5:913. doi: 10.1038/nmeth1108-913. [DOI] [PMC free article] [PubMed] [Google Scholar]
- 16.Anderson NL, Anderson NG, Haines LR, Hardie DB, Olafson RW, Pearson TW. J Proteome Res. 2004;3:235. doi: 10.1021/pr034086h. [DOI] [PubMed] [Google Scholar]
- 17.Kuhn E, Addona T, Keshishian H, Burgess M, Mani DR, Lee RT, Sabatine MC, Gerszten RE, Carr SA. Clin Chem. 2009;55:1108. doi: 10.1373/clinchem.2009.123935. [DOI] [PMC free article] [PubMed] [Google Scholar]
- 18.Lovestone S, Guntert A, Hye A, Lynham S, Thambisetty M, Ward M. Expert Rev Proteomics. 2007;4:227. doi: 10.1586/14789450.4.2.227. [DOI] [PubMed] [Google Scholar]
- 19.Choi YS, Choe LH, Lee KH. Expert Rev Proteomics. 2010;7:919. doi: 10.1586/epr.10.75. [DOI] [PubMed] [Google Scholar]
- 20.Finehout EJ, Franck Z, Choe LH, Relkin N, Lee KH. Ann Neurol. 2007;61:120. doi: 10.1002/ana.21038. [DOI] [PubMed] [Google Scholar]
- 21.Kazanis K, Dalamaga M, Nounopoulos C, Manolis AS, Sakellaris N, Jullien G, Dionyssiou-Asteriou A. Clin Chim Acta. 2009;408:65. doi: 10.1016/j.cca.2009.07.007. [DOI] [PubMed] [Google Scholar]
- 22.Hu Y, Hosseini A, Kauwe JSK, Gross J, Cairns NJ, Goate AM, Fagan AM, Townsend RR, Holtzman DM. Proteomics Clin Appl. 2007;1:1373. doi: 10.1002/prca.200600999. [DOI] [PubMed] [Google Scholar]
- 23.Puchades M, Hansson SF, Nilsson CL, Andreasen N, Blennow K, Davidsson P. Mol Brain Res. 2003;118:140. doi: 10.1016/j.molbrainres.2003.08.005. [DOI] [PubMed] [Google Scholar]
- 24.Abdi F, Quinn JF, Jankovic J, McIntosh M, Leverenz JB, Peskind E, Nixon R, Nutt J, Chung K, Zabetian C. J Alzheimers Dis. 2006;9:293. doi: 10.3233/jad-2006-9309. [DOI] [PubMed] [Google Scholar]
- 25.Simonsen AH, McGuire J, Podust VN, Davies H, Minthon L, Skoog I, Andreasen N, Wallin A, Waldemar G, Blennow K. Neurobiol Aging. 2008;29:961. doi: 10.1016/j.neurobiolaging.2007.01.011. [DOI] [PubMed] [Google Scholar]
- 26.Zhang J, Sokal I, Peskind ER, Quinn JF, Jakovic J, Kenney C, Chung KA, Millard SP, Nutt JG, Montine TJ. Am J Clin Pathol. 2008;129:526. doi: 10.1309/W01Y0B808EMEH12L. [DOI] [PMC free article] [PubMed] [Google Scholar]
- 27.Carrette O, Demalte I, Scherl A, Yalkinoglu O, Corthals G, Burkhard P, Hochstrasser DF, Sanchez JC. Proteomics. 2003;3:1486. doi: 10.1002/pmic.200300470. [DOI] [PubMed] [Google Scholar]
- 28.Mares J, Kanovsky P, Herzig R, Stejskal D, Vavrouskova J, Hlustik P, Vranova H, Burval S, Zapletalova J, Pidrman V, Obereigneru R, Suchy A, Vesely J, Podivinsky J, Urbanek K. Neurol Sci. 2009;30:1. doi: 10.1007/s10072-008-0005-7. [DOI] [PubMed] [Google Scholar]
- 29.Davidsson P, Westman-Brinkmalm A, Nilsson CL, Lindbjer M, Paulson L, Andreasen N, Sjogren M, Blennow K. Neuroreport. 2002;13:611. doi: 10.1097/00001756-200204160-00015. [DOI] [PubMed] [Google Scholar]
- 30.Zellner M, Veitinger M, Umlauf E. Acta Neuropathol. 2009;118:181. doi: 10.1007/s00401-009-0502-7. [DOI] [PubMed] [Google Scholar]
- 31.Burdick D, Soreghan B, Kwon M, Kosmoski J, Knauer M, Henschen A, Yates J, Cotman C, Glabe C. J Biol Chem. 1992;267:546. [PubMed] [Google Scholar]
- 32.Oe T, Ackermann B, Inoue K, Berna MJ, Garner CO, Gelfanova V, Dean RA, Siemers ER, Holtzman DM, Farlow MR, Blair IA. Rapid Commun Mass Spectrom. 2006;20:3723. doi: 10.1002/rcm.2787. [DOI] [PubMed] [Google Scholar]
Associated Data
This section collects any data citations, data availability statements, or supplementary materials included in this article.