

Abstract
The genetic and environmental contributions to the development of general cognitive ability throughout the first 16 years of life were examined using sibling data from the Colorado Adoption Project. Correlations were analyzed along with structural equation models to characterize the genetic and environmental influences on longitudinal stability and instability. Intraclass correlations reflected both considerable genetic influence at each age and modest shared environmental influence within and across ages. Modeling results suggested that genetic factors mediated phenotypic stability throughout this entire period, whereas most age-to-age instability appeared to be due to nonshared environmental influences.
The roles of genetics and the environment have been central to theories of cognitive ability. Although debate initially centered on whether genes or environments were important to cognitive abilities, over the past 30 years, a more balanced view recognizing that both nature and nurture are important has emerged. When data across all studies are collapsed, genetic influences account for around 50% of the variance (e.g., Bouchard & McGue, 1981). However, when samples of varying ages are examined, genetic influences increase from accounting for roughly 20% of the variance in childhood to accounting for 80% of the variance in adulthood (see Plomin, DeFries, McClearn, & McGuffin, 2001, for a discussion). The shared family environment accounts for significant variance in cognitive ability in childhood, but the proportion of variance it accounts for drops to zero by adolescence. The nonshared environment is significant throughout the life span. Indeed, these findings are some of the most consistent and highly replicated in the psychological literature (e.g., Alarcon, Plomin, Fulker, Corley, & DeFries, 1998; Bouchard & McGue, 1981; Cardon, Fulker, DeFries, & Plomin, 1992; Mackintosh, 1998; Plomin, Fulker, Corley, & DeFries, 1997; Reznick, Corley, & Robinson, 1997; Rice, Carey, Fulker, & DeFries, 1989; Skodak & Skeels, 1949; Snyderman & Rothman, 1998; Wilson, 1983). As a result, few contemporary scientists seriously engage in nature versus nurture debates or dispute the overwhelming finding that cognitive ability involves both genetic and environmental influences.
Given that genetic and environmental influences are found throughout the life span, an important issue is how genetic and environmental factors influence the stability and instability of cognitive development. For example, the beginning of formal education in middle childhood introduces novel social and intellectual pressures. The impact of those pressures may be specific to those middle childhood years. Conversely, genetic and environmental influences may persist across development, underlying similarities in ability.
The genetic and environmental stability and instability of cognitive development have been increasingly studied with child and adolescent populations. Some studies have identified a simplex pattern (Boomsma & Molenaar, 1987; Eaves, Long, & Heath, 1986). In this case, age-specific genetic and environmental influences mediate instability, whereas age-to-age transmission mediates stability. In other words, the stability of cognitive ability is highest at contiguous age points (Cardon et al., 1992; Fulker, Cherny, & Cardon, 1993; Humphreys & Davey, 1988).
Extending this work, a few studies have used a combined approach (as described in the Method section) in which simplex transmission and a unitary general factor are estimated simultaneously (Bartels, Rietveld, Van Baal, & Boomsma, 2002; Bishop et al., 2003; Cherny & Cardon, 1994). In this case, Cherny and Cardon (1994) examined general cognitive ability from ages 1 through 9 years and reported results nearly identical to those of the studies above. Bishop et al. (2003) extended this analysis to the age of 12 and reported that although genetic factors contributed to both stability and instability during infancy and childhood, during the transition to adolescence genetic factors contributed exclusively to stability. The analysis reported by Bartels et al. (2002) included ages 5, 7, 10, and 12 and found that genetics were influential primarily through a common factor contributing exclusively to stability. In addition, Bartels et al. reported that shared environmental factors exerted a significant influence on stability and instability.
Collectively, these studies suggest that genetic effects contribute to stability and instability in measures of general cognitive ability from infancy through late childhood. Shared environmental influences are important in early childhood but are nonsignificant by adolescence. Nonshared environmental influences (including error) contribute largely to instability (see Petrill, 2002, for a more complete discussion). During infancy and early childhood, age-specific genetic influences appear substantial, whereas beginning in middle childhood and early adolescence, a different picture emerges: Genetic overlap appears to predominate. What is unclear is whether this pattern of increasing stability persists into adolescence or whether genetic influences become more age-specific as individual differences in pubertal and adolescent development override the stability achieved in middle to late childhood (see Petrill, Plomin, DeFries, & Hewitt, 2003). The question remains: What is the pattern of genetic and environmental influence on the stability of cognitive skills from early childhood through late adolescence?
The current study used data from the Colorado Adoption Project (CAP) to examine cognitive development from infancy through adolescence. Not only is the adoption sibling design a powerful test of genetic and environmental influences on family resemblance, the CAP is the only longitudinal adoption study in existence that measures cognitive skills from infancy into late adolescence (see Petrill et al., 2003; Plomin et al., 1997). The current analysis included measures from adoptive and matched biological control sibling pairs, collected over the entire period of the CAP, to examine the development of cognitive ability throughout the first 16 years of life.
On the basis of previous results, we hypothesized at least two possible outcomes: First, age-specific genetic influences may operate early during this developmental period, whereas a common genetic factor may operate in the later years. A second possibility is that age-specific genetic factors may reemerge in adolescence as individual differences in pubertal development and the social pressures of adolescence dominate. Shared environmental influences should then be weaker, whereas we hypothesized that unique environmental experiences would mediate changes in general cognitive ability.
Method
Participants
The Colorado Adoption Project (CAP) sample consists of 245 adoptive families and 245 biological control families matched to the adoptive families according to age, education, occupational status of the father, sex of the adopted child, and number of children in the family. A detailed description of the CAP is provided by Plomin and DeFries (1985). Adoptive families were recruited through two Denver-area adoption agencies that made no attempts to systematically place children with particular families on the basis of measures of cognitive ability or personality. Analyses suggest that selective placement is negligible for all cognitive measures included in CAP analyses (Plomin & DeFries, 1985).
The CAP employed the full adoption design, comparing parent-offspring and sibling similarity by adoptive and control group status. The current analysis employed the “sibling” adoption design, thus focusing exclusively on adopted and biological control probands and their siblings. Adoptive siblings are genetically unrelated yet share the same family environment, whereas biological siblings are 50% genetically related (on average) and share the same family environment. Covariance between adoptive siblings implies shared environmental influences. On the other hand, genetic influences are inferred if biological control siblings exhibit greater similarity than do adoptive siblings. Of the 245 adoptive families described above, 141 possessed adoptive siblings (18% same-sex siblings). Of the 245 biological control families, 143 possessed biological siblings (57% same-sex siblings).
Measures
General cognitive ability was assessed in adopted and biological sibling pairs from age 1 to age 16 (see Table 1). At ages 1 and 2, general intelligence was assessed with the Bayley Mental Intelligence Index (Bayley, 1969); at ages 3 and 4, the Stanford–Binet Intelligence Scale (Terman & Merrill, 1973) was used. The Wechsler Intelligence Scale for Children—Revised (Wechsler, 1974) was used at ages 7 and 12. At age 9, a first principal component score from the Colorado Battery of Specific Cognitive Abilities (Kent & Plomin, 1987), a validated telephone-administered measure of specific cognitive abilities, was used. At age 16, cognitive ability was assessed with the Wechsler Adult Intelligence Scale—Revised (Wechsler, 1981). Each child was assessed annually when she or he was 1, 2, 3, 4, 7, 9, 12, and 16 years old. The average age difference between siblings was 4.1 years for adoptive siblings and 3.2 years for biological control siblings. The participant retention rate was over 90% over the 16-year span of the study. Analyses of patterns of missing data (Shafer & Graham, 2002) suggested that data were missing at random. Moreover, because of planned follow-up studies examining transitions to adulthood, special attempts were made to collect data from all CAP children when they reached age 16. This resulted in a response rate for cognitive ability at age 16 that exceeded that at earlier assessment points.
Table 1.
Descriptive Statistics
| Age | Measure | N | M | SD |
|---|---|---|---|---|
| 1 | Bayley Mental Development Index | 691 | 109.34 | 12.48 |
| 2 | Bayley Mental Development Index | 651 | 108.03 | 15.38 |
| 3 | Stanford-Binet | 613 | 106.08 | 15.05 |
| 4 | Stanford-Binet | 608 | 108.19 | 12.59 |
| 7 | WISC-R Full Scale IQ | 605 | 113.01 | 11.48 |
| 9 | Principal cognitive component—phone assessmenta | 555 | 0.01 | 0.99 |
| 12 | WISC-R Full Scale IQ | 625 | 111.08 | 11.35 |
| 16 | WAIS-R Full Scale IQ | 776 | 105.94 | 11.32 |
Note. Stanford–Binet = Stanford–Binet Intelligence Scale; WISC-R = Wechsler Intelligence Scale for Children—Revised; WAIS-R = Wechsler Adult Intelligence Scale—Revised.
Principal component was standardized.
Analyses
Phenotypic analyses
First, phenotypic correlations were calculated to examine patterns of stability and instability. Year-to-year Pearson correlations were calculated on all children taking part in the study.
Behavioral genetic analyses
The genetic and environmental influences on general cognitive ability from age 1 to age 16 were then examined. As a first step, univariate intraclass sibling correlations were calculated to estimate the genetic and environmental influences on cognitive ability at each age. Bivariate intraclass sibling correlations were then used to examine the genetic and environmental influences on cross-age stability. Genetic influences are implied if biological siblings are more similar across age than are adoptive siblings.
To quantify the pattern of genetic and environmental overlap across age, we used a combined common-factor/simplex model (Bishop et al., 2003). Genetic, shared, and nonshared influences were estimated simultaneously. The covariance among cognitive ability assessed from age 1 to age 16 was estimated using the following set of equations. The total variance/covariance for cognitive ability from age 1 to age 16 (P) was decomposed into genetic (A), shared environmental (C), and nonshared environmental (E) variance/covariance matrices. These matrices were simultaneously estimated using the following formulae:
where I = identity matrix, β = simplex transmission across age, Γ = common-factor transmission, and Ψ = age-specific variance.
Figure 1 presents the structure of the genetic variance (A). The genetic variance/covariance of general cognitive ability from age 1 to age 16 was influenced by age-specific genetic variance (ΨA) as well as genetic overlap resulting from simplex transmission (βA) and general-factor transmission (ΓA). To the extent that age-specific genetic effects are large, the Ψ loadings will be significant. To the extent that genetic simplex transmission is important, β loadings will be significant. Finally, to the extent that a common genetic factor is operating, Γ loadings will be significant. The same logic may be used for shared and unique environmental influences across age. In all, there were three sets of Γ, β, and Ψ parameters fit simultaneously to the cognitive outcomes from age 1 to age 16: one set for genetics, one for the shared environment, and one for the nonshared environment.
Figure 1.
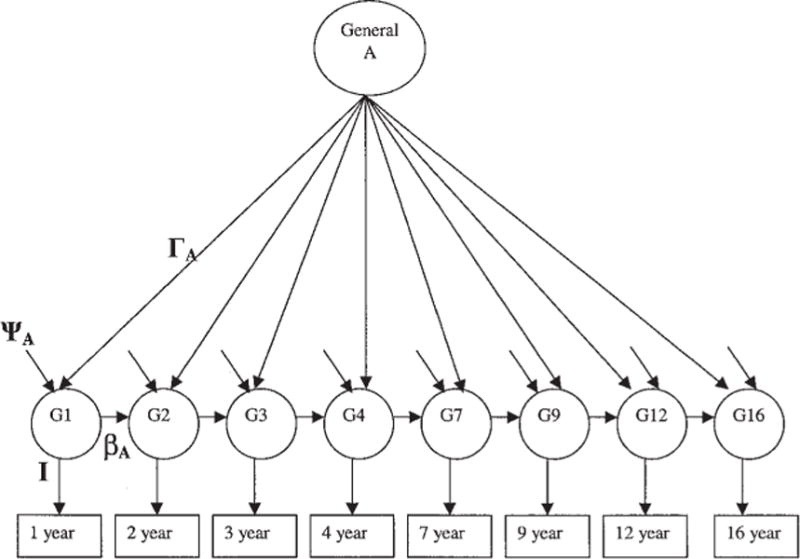
Longitudinal genetic (A) model. Variance in cognitive skills from age 1 to age 16 is influenced by genetic common-factor (ΓA), genetic simplex (βA), and age-specific genetic (ΨA) variance. For the sake of clarity, shared and nonshared environmental influences are not shown, but they were estimated simultaneously with genetic influences using the same common-factor, simplex, and age-specific structure. The paths (I) from G1 through G16 to Year 1 through Year 16 were constrained to unity.
Confirmatory latent factor models were fit to the data using Mx (Neale, Boker, Xie, & Maes, 1999). Raw data were analyzed to make full use of all available data. By comparing the fit of submodels to the full model, we were able to test whether the stability and instability of cognitive ability from age 1 to age 16 were best explained by genetic, shared environmental, or nonshared environmental factors. Furthermore, it was possible to explore whether the stability of cognitive ability from infancy to middle childhood was best explained by a simplex pattern or a common-factor pattern. Goodness of fit was assessed with the likelihood ratio test (Δ − 2LL). The Δ − 2LL statistic tests whether the change in log-likelihood (LL) of a submodel versus the full model is significant according to a chi-square difference test. In addition, Akaike’s information criterion was used (Akaike, 1987). A more highly negative number indicates a better fit to the data.
Results
Phenotypic Analyses
Phenotypic correlations for each child from ages 1 through 16 for general cognitive ability are presented in Table 2. The results suggest significant correlations in cognitive ability between almost every year assessed. For example, ages 2, 3, 4, 7, and 16 are significantly correlated with every other age. Two exceptions are the correlations between ages 1 and 9 and between ages 1 and 12. Despite a general positive manifold in correlations, the correlations also reflect a simplex pattern, with greater similarity between contiguous ages that reduces as the time between assessments increases. Overlaid on this simplex pattern is a trend of increasing correlations from 1 to 16 years. For example, the 1-year correlations increase from .37 between ages 1 and 2, to .51 between ages 2 and 3, to .60 between ages 3 and 4. Similarly, the 3-year correlation between age 4 and age 7 is .48, the 3-year correlation between age 9 and age 12 is .62, and the 4-year correlation between age 12 and age 16 is .80.
Table 2.
Phenotypic Correlations
| Age | Year 1 | Year 2 | Year 3 | Year 4 | Year 7 | Year 9 | Year 12 | Year 16 |
|---|---|---|---|---|---|---|---|---|
| Year 1 (Bayley) | — (691) | |||||||
| Year 2 (Bayley) | .37 (635) | — (651) | ||||||
| Year 3 (SBINET) | .23 (593) | .51 (597) | — (613) | |||||
| Year 4 (SBINET) | .21 (590) | .46 (588) | .60 (586) | — (608) | ||||
| Year 7 (WISC-R) | .23 (577) | .37 (562) | .37 (552) | .48 (543) | — (605) | |||
| Year 9 (SCATPC) | .08a (530) | .28 (511) | .29 (499) | .32 (490) | .60 (526) | — (555) | ||
| Year 12 (WISC-R) | .06a (588) | .34 (569) | .36 (550) | .40 (545) | .72 (577) | .62 (536) | — (625) | |
| Year 16 (WAIS-R) | .15 (574) | .30 (547) | .31 (529) | .38 (521) | .68 (531) | .58 (527) | .80 (553) | — (776) |
Note. Numbers in parentheses are Ns. All correlations are significant at p < .01 except those indicated by superscript a. Bayley = Bayley Mental Development Index; SBINET = Stanford-Binet Intelligence Scale; WISC-R = Wechsler Intelligence Scale for Children—Revised; SCATPC = Specific Cognitive Abilities Test Principal Component; WAIS-R = Wechsler Adult Intelligence Scale—Revised.
Nonsignificant correlations.
Behavioral Genetic Analyses
Same-age and cross-age intraclass sibling correlations
The univariate intraclass correlations presented in Table 3 show greater similarity between biological control siblings than between adoptive siblings, suggesting genetic influence. The adoptive sibling correlations suggested modest shared environmental influences, although only the correlations at ages 3 and 9 were statistically significant.
Table 3.
Same-Age Intraclass Sibling Correlations
| Age | Adoptive siblings | Control siblings |
|---|---|---|
| Year 1 (Bayley) | .11 (87) | .35** (101) |
| Year 2 (Bayley) | .02 (88) | .33** (93) |
| Year 3 (SBINET) | .24** (84) | .37** (90) |
| Year 4 (SBINET) | .04 (86) | .23** (93) |
| Year 7 (WISC-R) | .06 (82) | .29** (93) |
| Year 9 (SCATPC) | .26* (59) | .35** (72) |
| Year 12 (WISC-R) | .11 (90) | .25** (99) |
| Year 16 (WAIS-R) | .07 (128) | .22** (137) |
Note. Numbers in parentheses are numbers of sibling pairs. Bayley = Bayley Mental Development Index; SBINET = Stanford-Binet Intelligence Scale; WISC-R = Wechsler Intelligence Scale for Children-Revised; SCATPC = Specific Cognitive Abilities Test Principal Component; WAIS-R = Wechsler Adult Intelligence Scale—Revised.
p < .05.
p < .01.
Bivariate cross-age interval estimates are presented in Table 4. As with the results found in the univariate case, biologically related siblings were more similar across measurement occasions than were adoptive siblings, suggesting genetic influences on the age-to-age stability of general cognitive ability. A significant adoptive cross-sibling correlation between Year 1 and Year 2 suggests moderate shared environmental influences on the stability of cognitive ability, most consistently in the first 2 years of life.
Table 4.
Cross-Age Intraclass Sibling Correlations
| Age and sibling | Adoptive siblings | Control siblings |
|---|---|---|
| Year 1 Sibling 1 × Year 2 Sibling 2 | .18* (168) | .18* (189) |
| Year 2 Sibling 1 × Year 3 Sibling 2 | −.02 (163) | .24** (177) |
| Year 3 Sibling 1 × Year 4 Sibling 2 | .11 (165) | .38** (181) |
| Year 4 Sibling 1 × Year 7 Sibling 2 | .09 (150) | .14 (175) |
| Year 7 Sibling 1 × Year 9 Sibling 2 | .12 (119) | .32** (137) |
| Year 9 Sibling 1 × Year 12 Sibling 2 | .19* (122) | .21** (141) |
| Year 12 Sibling 1 × Year 16 Sibling 2 | .10 (116) | .15 (142) |
Note. Numbers of double-entered sibling pairs appear in parentheses. Siblings were double counted so that each participant’s data were analyzed at each year (e.g., each sibling’s Year 1 and Year 2 data were analyzed).
p < .05.
p < .01.
Multivariate modeling
Although the data presented in Tables 3 and 4 suggest that genetic influences are important to within-age variability and across-age stability, multivariate modeling allows estimation of the genetic, shared environmental, and nonshared environmental influences on the development of general cognitive ability. The standardized estimates from the full model are presented in Table 5. These estimates suggest a high degree of genetic stability. Age-specific genetic influences were negligible after Year 1, and genetic stability was divided between the general factor and simplex transmission. That is, whenever simplex transmission was high (e.g., at ages 3 and 4), the general factor was low, and vice versa. Shared environmental influences suggest a similar pattern: very low age-specific effects and moderate simplex transmission and general-factor effects. In contrast, age-specific effects were most consistent in the nonshared environmental estimates.
Table 5.
Standardized Parameter Estimates: Full Model
| Source of variance | Age (years)
|
|||||||
|---|---|---|---|---|---|---|---|---|
| 1 | 2 | 3 | 4 | 7 | 9 | 12 | 16 | |
| Genetic (A) | ||||||||
| General factor (ΓA) | .05 | .47 | .00 | .00 | .76 | .24 | .77 | .21 |
| Simplex (βA) | .37 | .98 | .98 | .00 | .48 | .00 | .50 | |
| Age-specific (ΨA) | .39 | .18 | .03 | .00 | .00 | .18 | .00 | .00 |
| Shared environment (C) | ||||||||
| General factor (ΓC) | .10 | .00 | .21 | .00 | .23 | .42 | .26 | .31 |
| Simplex (βC) | .80 | .38 | .70 | .21 | .00 | .01 | .19 | |
| Age-specific (ΨC) | .14 | .00 | .13 | .00 | .00 | .00 | .01 | .00 |
| Nonshared environment (E) | ||||||||
| General factor (ΓE) | .39 | .00 | .00 | .10 | .39 | .12 | .19 | .28 |
| Simplex (βE) | .28 | .04 | .15 | .14 | .00 | .00 | .48 | |
| Age-specific (ΨE) | .30 | .40 | .32 | .43 | .18 | .26 | .29 | .31 |
Note. Age-specific parameters are expressed as variances; general-factor and simplex parameters are expressed in standard deviation units.
These standardized parameter estimates, by themselves, do not provide a clear picture of the overall magnitude of genetic, shared environmental, and nonshared environmental influences. Univariate estimates of heritability, shared environment, and nonshared environment were calculated from the full model by dividing the genetic variance/covariance matrices (A, C, and E, respectively, as calculated using the models presented in the Method section) by the total variance for each measure (P). Heritability and nonshared environment were consistently moderate to high in effect from ages 1 through 16 (see Table 6). Shared environmental influences, in contrast, were small in effect, ranging from .07 to .20.
Table 6.
Univariate Estimates of Heritability (h2), Shared Environment (c2), and Nonshared Environment (e2) From the Full Model
| Age | h2 | c2 | e2 |
|---|---|---|---|
| 1 | .39 | .15 | .46 |
| 2 | .47 | .10 | .43 |
| 3 | .48 | .20 | .32 |
| 4 | .46 | .10 | .45 |
| 7 | .58 | .07 | .35 |
| 9 | .55 | .18 | .28 |
| 12 | .60 | .07 | .33 |
| 16 | .36 | .13 | .51 |
Note. h2, c2, and e2 were derived as follows: h2 = S−1*A*S−1, c2 = S−1*C*S−1, and e2 = S−1*E*S−1, respectively, where S = standard deviation, A = genetic variance/covariance, C = shared environmental variance/covariance, and E = nonshared environmental variance/covariance.
Descriptively, the results presented in Tables 5 and 6 suggest that genetic influences are moderate to large in effect and tend to overlap, nonshared environmental influences are moderate and tend to be age-specific, and shared environmental influences tend to overlap but are small in effect. Six submodels were fit to the data to test the significance of age-to-age stability as well as the significance of the genetic, shared environmental, and nonshared environmental components of this stability (see Table 7). The first two submodels tested whether the stability of cognitive ability was influenced by a general factor or simplex transmission, irrespective of etiology. The first submodel (No simplex transmission) dropped all 21 simplex pathways (7 from genetics, 7 from the shared environment, 7 from the nonshared environment). The second (No common factor) dropped all pathways from the genetic, shared environmental, and nonshared environmental common factors. Both submodels fit significantly worse than the full model, suggesting that the general factor and simplex transmission were important to stability.
Table 7.
General Cognitive Ability From Age 1 to Age 16: Simplex/Common-Factor Model and Submodels
| Model | −2LL | df | Δ − 2LL | Δdf | p for chi-square test | AIC |
|---|---|---|---|---|---|---|
| Full model | 7,379.976 | 2,998 | ||||
| Submodels | ||||||
| No simplex transmission | 7,431.96 | 3,019 | 51.984 | 21 | < .01 | 9.984 |
| No common factors | 7,511.57 | 3,022 | 131.594 | 24 | < .01 | 83.594 |
| No shared environment | 7,397.345 | 3,021 | 17.369 | 23 | ns | −28.631 |
| No specific genetic or genetic simplex transmission | 7,395.485 | 3,013 | 15.509 | 15 | ns | −14.491 |
| No genetic common factor | 7,400.33 | 3,006 | 20.354 | 8 | < .01 | 4.354 |
| No nonshared environmental common factor or nonshared environmental simplex transmission | 7,409.51 | 3,013 | 29.534 | 15 | ns | −0.466 |
Note. −2LL = −2 × Log Likelihood; AIC = Akaike’s information criterion.
The remaining four submodels tested the magnitude of genetic, shared environmental, and nonshared environmental influences on stability as well as instability. First, all shared environmental pathways were dropped from the model (No shared environment). This model did not result in a significant decrease in model fit, suggesting that the shared environment was not significant to either the stability or instability of general cognitive ability. Submodels of the genetic pathways suggested that it was possible to drop all simplex and age-specific pathways (No specific genetic or genetic simplex transmission) without significantly reducing model fit. However, it was not possible to drop the general factor (No genetic common factor). Thus, only the genetic variance relating to the general factor was significant in the current study. Finally, it was also possible to drop all stability pathways (No nonshared environmental common factor or nonshared environmental transmission) from the nonshared environment without significantly reducing model fit. Given that the unique environmental innovation term incorporates experimental error, these parameters cannot be dropped. Collectively, these results support the significance of genetic overlap across years and suggest that age-specific nonshared environmental experiences (and error) are responsible for age-to-age instability.
Genetic correlations (see Table 8) were calculated by standardizing the genetic variance/covariance matrix (A) using h2 as the total variance. These correlations estimate the overlap between the genetic variance found at two measurement occasions. The results are consistent with a large degree of genetic overlap from age 1 to age 16. Between Years 2 and 3 the genetic correlation is .97, and between Years 3 and 4 the genetic correlation is 1.0 (see Table 8). Genetic correlations of this magnitude suggest nearly 100% transmission of genetic influence, which is consistent with the large simplex transmission estimates presented in Table 5. Moreover, aside from Year 1, the genetic correlations among the remaining years are consistently high and stable, irrespective of the number of years between measurement occasions.
Table 8.
Genetic Correlations Derived From the Full Model
| Age | Year 1 | Year 2 | Year 3 | Year 4 | Year 7 | Year 9 | Year 12 | Year 16 |
|---|---|---|---|---|---|---|---|---|
| Year 1 | — | |||||||
| Year 2 | .40 | — | ||||||
| Year 3 | .39 | .97 | — | |||||
| Year 4 | .39 | .97 | 1.00 | — | ||||
| Year 7 | .08 | .71 | .69 | .69 | — | |||
| Year 9 | .07 | .58 | .57 | .57 | .82 | — | ||
| Year 12 | .08 | .71 | .69 | .69 | 1.00 | .82 | — | |
| Year 16 | .08 | .71 | .69 | .69 | 1.00 | .82 | 1.00 | — |
Discussion
The results of the current analysis suggest that the nonshared environment is primarily responsible for instability and genetics are primarily responsible for stability in cognitive performance from age 1 to age 16. An additional aim of the current study was to examine whether this stability persisted into adolescence and whether genes and/or the environment contributed to this stability. The model-fitting results suggested that cognitive abilities in adolescence are significantly correlated with abilities at earlier measurement occasions in childhood and that genes are primarily responsible for this overlap. The nonshared environment (including error) was primarily responsible for instability. Shared environmental influences were nonsignificant in the current study.
An examination of the estimates from the full model (see Table 5), the model-fitting results (see Table 7), as well as the genetic correlations (see Table 8) suggests that simplex transmission may be significant but that it was not possible to distinguish genetic from nonshared environmental contributions to simplex transmission. Moreover, the magnitude of genetic simplex transmission from age 2 to age 3 and from age 3 to age 4 is so high (.98 and .98, respectively) that these parameters may function, in effect, as a general factor. It is difficult to distinguish simplex from general- factor transmission when simplex transmission approaches 1.0 over the course of several years. Despite the lack of clarity concerning the precise mechanism, the current study suggests that genetic influences are primarily responsible for covariance among cognitive skills from age 1 to age 16 and that this covariance is significant and substantial from early childhood through adolescence.
These results build on previous studies though they differ slightly in the characterization of the pattern of genetic and environmental influences throughout this period. Bishop et al. (2003) reported that the genetic contribution from infancy through early childhood included substantial age-specific innovation and mediated change, whereas in late childhood a common genetic factor predominated and contributed to stability. Significant genetic simplex transmission in early childhood was not found in our analyses. Bishop et al. (2003) examined cognitive skills at 1, 2, 3, 4, 7, 9, 10, and 12 years in a simultaneous analysis of CAP and Longitudinal Twin Study (Emde et al., 1992) samples, whereas we examined cognitive skills at 1, 2, 3, 4, 7, 9, 12, and 16 years using the CAP sample. Because results for each study were estimated through a simultaneous analysis of the data, the point estimates for genetic and environmental effects are similar, but they are not the same across both studies. Despite these differences, both analyses are in agreement that the stability of cognitive skills from infancy, through childhood, and into adolescence is due primarily to genetic influences.
In a separate study, Bartels et al. (2002) described a pattern of genetic influence similar to that observed in the current study, yet they also described a considerable effect of shared environment. Though this latter pattern is a considerable departure from the current and previous adoption studies, U.S.-Dutch sample differences as well as adoption-twin study differences may account for the higher estimates of shared environmental influence. Another possible explanation is that there was a greater proportion of same-sex siblings among biological siblings in the CAP than among adoptive siblings. This dissonance may have resulted in an underestimation of adoptive sibling correlations, thus depressing the shared environment. Although we do not have power to examine the potential effects of this difference in the current study, results from the parent-offspring CAP data suggest that adoptive children are unrelated to their adoptive parents except very early in early childhood. Instead, adoptive children are most closely related to their biological parents, yielding heritability estimates similar to those found in the current study using sibling data (Plomin et al., 1997). Another limitation of the current study is that it did not consider the effects of gene-environment correlation and/or Gene × Environment interaction. Given the sample size and the number of variables estimated in the current analyses, it was not possible to address these issues with sufficient power.
Another limitation of the current study is that it used a single measure of cognitive ability at each age. In the current study, we assumed that these measures index general cognitive ability. There remains considerable debate about the structure of general cognitive abilities (see Sternberg & Grigorenko, 2003). However, what is emerging from the behavioral genetic literature is that the overlap among different cognitive abilities is largely due to genetic overlap (see Petrill, 2002). Thus, it is likely that the genetic variance we are measuring in the current study is highly correlated with the genetic variance found in other measures of cognitive ability.
Despite these limitations, the CAP is the only study in existence that can examine the genetic and environmental influences on cognitive skills in an adoptive sample assessed longitudinally from 1 to 16 years. It is also important to consider that the siblings, although possessing test scores at the same chronological age, were tested several years apart. The results of the current study suggest that to the extent that there is genetic variance, it is associated with stability, not instability. Furthermore, to the extent that the environment is important, it contributes primarily to instability and is associated with the nonshared environment. Given the amount of growth from early childhood through adolescence, it is surprising that there is any stability in cognitive ability. A child just learning to speak cannot be assessed with the same measurements as a teenager. Despite the difference in performance measurement, previous studies have validated the use of these measures across early childhood through adolescence (Sattler, 1988). Taken together, genetic influences not only are significant and substantial but are increasingly correlated from birth through adolescence.
Although these data suggest significant covariance in cognitive ability from age 1 to age 16, there is also a great deal of instability, particularly in early childhood. Thus, it is important to point out that although genetic factors are important to understanding why there is stability, these genetic factors do not explain all of the variability in general cognitive ability at a given age.
As the present results suggest, genetic mechanisms play a highly consistent and considerable role in the stability of cognitive ability during the first 16 years of life. This genetic stability is likely to be associated with brain-based, neuroanatomical, and neurophysiological mechanisms. In the context of the stability of general cognitive ability throughout development, a discussion of these neurobiological substrates might prove valuable. The present results also suggest that likely candidates for influencing changes in cognitive performance are age-specific unique environmental experiences. Cooperation between these genetic, or neurobiological, mechanisms and environmental influences suggests that these neurobiological substrates of cognition are flexible and responsive to external stimuli. This flexibility undoubtedly is a feature of the molecular genetic mechanisms that construct this responsive neurobiological system.
The system responsible for cognitive performance is the local and global neural architecture of the brain. A potential mechanism of change and stability within this system is the neuronal mechanism of plasticity (Garlick, 2002). Plasticity is an experience-dependent change in neuronal circuitry (Crutcher, 1986; Katz & Shatz, 1996) that occurs throughout life, though on a larger scale during infancy, childhood, and adolescence (Huttenlocher, 1990). During this early part of life, long-term changes that may occur include the rewiring of existing networks and the establishment of new sets of connections, the results of which include increased capacity and improved efficiency. Changes that occur throughout life, that are the predominant mode of plasticity later in life (Huttenlocher, 1990; Rakic, 1995), involve changes in local circuitry such as modifications in receptors, neurotransmitter release, or the formation of new dendritic or axonal synaptic connections in response to external stimulation (Crutcher, 1986). This dendritic or axonal plasticity strengthens preexisting circuits and improves the efficiency of local neuronal transmission (Tang et al., 1999). Changes in myelination are another neurobiological mechanism that may influence cognitive ability by affecting information transfer along axons. These neural mechanisms ultimately allow subsequent experiences to elicit more meaningful responses and thus may serve to directly impact cognitive ability.
How do these neuronal mechanisms relate to a suggested genetic contribution to stability and subsequent environmentally mediated instability? The stability of neuronal architecture may underlie a baseline level of performance, thus providing the basis for stability. On the other hand, changes in gene expression are ultimately responsible for the temporal and qualitative aspects of neuronal plasticity (Kandel, 2001). Environmentally mediated plasticity, perhaps bound by the presence or absence of particular genes, may serve as the basis for instability in cognitive performance (Crutcher, 1986; Katz & Shatz, 1996). The literature is only beginning to examine individual differences in these mechanisms. These results suggest that the heritable genetic influences on the neurobiological mechanisms underlying intellectual development promote stability across the first 16 years of life.
Acknowledgments
The Colorado Adoption Project (CAP) is supported by Grants HD-10333 and HD-18426 from the National Institute of Child Health and Human Development and Grant MH-43899 from the National Institute of Mental Health. Paul A. Lipton was a postdoctoral fellow at Pennsylvania State University supported by Grant AG00276 from the National Institute on Aging.
Contributor Information
Stephen A. Petrill, Department of Biobehavioral Health, The Pennsylvania State University
Paul A. Lipton, Center for Memory and Brain, Boston University
John K. Hewitt, Institute for Behavioral Genetics, University of Colorado
Robert Plomin, Social, Genetic, and Developmental Psychiatry Research Centre, Institute of Psychiatry, King’s College, London, England.
Stacey S. Cherny, Welcome Trust Centre for Human Genetics, University of Oxford, Oxford, England
Robin Corley, Institute for Behavioral Genetics, University of Colorado.
John C. DeFries, Institute for Behavioral Genetics, University of Colorado
References
- Akaike H. Factor analysis and AIC. Psychometrika. 1987;52:317–332. [Google Scholar]
- Alarcon M, Plomin R, Fulker DW, Corley R, DeFries JC. Multivariate path analysis of specific cognitive abilities data at 12 years of age in the Colorado Adoption Project. Behavior Genetics. 1998;28:255–264. doi: 10.1023/a:1021667213066. [DOI] [PubMed] [Google Scholar]
- Bartels M, Rietveld MJH, Van Baal GCM, Boomsma DI. Genetic and environmental influences on the development of intelligence. Behavior Genetics. 2002;32:237–249. doi: 10.1023/a:1019772628912. [DOI] [PubMed] [Google Scholar]
- Bayley N. Manual for the Bayley Scales of Infant Development. New York: Psychological Corporation; 1969. [Google Scholar]
- Bishop EG, Cherny SS, Corley R, Plomin R, DeFries JC, Hewitt JK. Developmental genetic analysis of general cognitive ability from 1 to 12 years in a sample of adoptees, biological siblings, and twins. Intelligence. 2003;31:31–49. [Google Scholar]
- Boomsma DI, Molenaar PC. The genetic analysis of repeated measures. I. Simplex models. Behavior Genetics. 1987;17:111–123. doi: 10.1007/BF01065991. [DOI] [PubMed] [Google Scholar]
- Bouchard JT, Jr, McGue M. Familial studies of intelligence: A review. Science. 1981;212:1055–1059. doi: 10.1126/science.7195071. [DOI] [PubMed] [Google Scholar]
- Cardon LR, Fulker DW, DeFries JC, Plomin R. Continuity and change in general cognitive ability from 1 to 7 years of age. Developmental Psychology. 1992;28:64–73. [Google Scholar]
- Cherny SS, Cardon LR. General cognitive ability. In: DeFries JC, Plomin R, Fulker DW, editors. Nature and nurture during middle childhood. Cambridge, MA: Blackwell; 1994. pp. 45–46. [Google Scholar]
- Crutcher KA. Anatomical correlates of neuronal plasticity. In: Martinez JL Jr, Kesner RP, editors. Learning and memory: A biological view. Orlando, FL: Academic Press; 1986. pp. 83–123. [Google Scholar]
- Eaves LJ, Long J, Heath AC. A theory of developmental change in quantitative phenotypes applied to cognitive development. Behavior Genetics. 1986;16:143–162. doi: 10.1007/BF01065484. [DOI] [PubMed] [Google Scholar]
- Emde RN, Plomin R, Robinson J, Reznick JS, Campos J, Corley R, et al. Temperament, emotion, and cognition at 14 months: The MacArthur Longitudinal Twin Study. Child Development. 1992;63:1437–1455. [PubMed] [Google Scholar]
- Fulker DW, Cherny SS, Cardon LR. Continuity and change in cognitive development. In: Plomin R, McClearn GE, editors. Nature, nurture, and psychology. Washington, DC: American Psychological Association; 1993. pp. 77–97. [Google Scholar]
- Garlick D. Understanding the nature of the general factor of intelligence: The role of individual differences in neural plasticity as an explanatory mechanism. Psychological Review. 2002;109:116–136. doi: 10.1037/0033-295x.109.1.116. [DOI] [PubMed] [Google Scholar]
- Humpreys LG, Davey TC. Continuity in intellectual growth from 12 months to 9 years. Intelligence. 1988;12:183–197. [Google Scholar]
- Huttenlocher PR. Morphometric study of human cerebral cortex development. Neuropsychologia. 1990;28:517–527. doi: 10.1016/0028-3932(90)90031-i. [DOI] [PubMed] [Google Scholar]
- Kandel ER. The molecular biology of memory storage: A dialogue between genes and synapses. Bioscience Reports. 2001;21:565–611. doi: 10.1023/a:1014775008533. [DOI] [PubMed] [Google Scholar]
- Katz LC, Shatz CJ. Synaptic activity and the construction of cortical circuits. Science. 1996;274:1133–1138. doi: 10.1126/science.274.5290.1133. [DOI] [PubMed] [Google Scholar]
- Kent J, Plomin R. Testing specific cognitive abilities by telephone and mail. Intelligence. 1987;11:391–400. [Google Scholar]
- Mackintosh NJ. IQ and human intelligence. Oxford, England: Oxford University Press; 1998. [Google Scholar]
- Neale MC, Boker SM, Xie G, Maes HH. Mx: Statistical modeling. 5. Medical College of Virginia, Department of Psychiatry; Richmond, VA 23298: 1999. Available from Box 126. [Google Scholar]
- Petrill SA. The case for general intelligence: A behavior genetic perspective. In: Sternberg R, Grigorenko E, editors. The general factor of intelligence: How general is it? Mahwah, NJ: Erlbaum; 2002. pp. 281–291. [Google Scholar]
- Petrill SA, Plomin R, DeFries JC, Hewitt JK, editors. Nature, nurture, and the transition to early adolescence. New York: Oxford University Press; 2003. [Google Scholar]
- Plomin R, DeFries JC. Nature and nurture in infancy and early childhood. 3. Cambridge, England: Cambridge University Press; 1985. [Google Scholar]
- Plomin R, DeFries JC, McClearn JE, McGuffin P. Behavioral genetics. 4. New York: Worth; 2001. [Google Scholar]
- Plomin R, Fulker DW, Corley R, DeFries JC. Nature, nurture, and cognitive development from 1 to 16 years. Psychological Science. 1997;8:442–447. [Google Scholar]
- Rakic P. Corticogenesis in human and nonhuman primates. In: Gazzaniga MS, editor. The cognitive neurosciences. Cambridge, MA: MIT Press; 1995. pp. 127–145. [Google Scholar]
- Reznick JS, Corley R, Robinson J. A longitudinal twin study of intelligence in the second year. Monographs of the Society for Research in Child Development. 1997;62(1, Serial No 249):1–154. [PubMed] [Google Scholar]
- Rice T, Carey G, Fulker DW, DeFries JC. Multivariate path analysis of specific cognitive abilities in the Colorado Adoption Project: Conditional path model of assortative mating. Behavior Genetics. 1989;19:195–207. doi: 10.1007/BF01065904. [DOI] [PubMed] [Google Scholar]
- Sattler JM. Assessment of children. San Diego, CA: Author; 1988. [Google Scholar]
- Shafer JL, Graham JW. Missing data: Our view of the state of the art. Psychological Methods. 2002;7:147–177. [PubMed] [Google Scholar]
- Skodak M, Skeels HM. A follow-up on one hundred adopted children. Journal of Genetic Psychology. 1949;75:84–125. doi: 10.1080/08856559.1949.10533511. [DOI] [PubMed] [Google Scholar]
- Snyderman M, Rothman S. The IQ controversy, the media and publication. New Brunswick, NJ: Transaction; 1988. [Google Scholar]
- Sternberg RJ, Grigorenko EL, editors. The general factor of intelligence: How general is it? Mahwah, NJ: Erlbaum; 2002. [Google Scholar]
- Tang Y, Shimizu E, Dube GR, Rampon C, Kerchner GA, Zhuo M, et al. Genetic enhancement of learning and memory in mice. Nature. 1999;401:63–69. doi: 10.1038/43432. [DOI] [PubMed] [Google Scholar]
- Terman LH, Merrill MA. Stanford-Binet Intelligence Scale: 1972 norms edition. Boston: Houghton Mifflin; 1973. [Google Scholar]
- Wechsler DL. Examiner’s manual: Wechsler Intelligence Scale for Children—Revised. New York: Psychological Corporation; 1974. [Google Scholar]
- Wechsler DL. Examiner’s manual: Wechsler Adult Intelligence Scale—Revised. New York: Psychological Corporation; 1981. [Google Scholar]
- Wilson RS. The Louisville Twin Study: Developmental synchronies in behavior. Child Development. 1983;54:298–316. [PubMed] [Google Scholar]