

Abstract
Lateral flow tests (LFTs) are an ingenious format for rapid and easy-to-use diagnostics, but they are fundamentally limited to assay chemistries that can be reduced to a single chemical step. In contrast, most laboratory diagnostic assays rely on multiple timed steps carried out by a human or a machine. Here, we use dissolvable sugar applied to paper to create programmable flow delays and present a paper network topology that uses these time delays to program automated multi-step fluidic protocols. Solutions of sucrose at different concentrations (10-70% of saturation) were added to paper strips and dried to create fluidic time delays spanning minutes to nearly an hour. A simple folding card format employing sugar delays was shown to automate a four-step fluidic process initiated by a single user activation step (folding the card); this device was used to perform a signal-amplified sandwich immunoassay for a diagnostic biomarker for malaria. The cards are capable of automating multi-step assay protocols normally used in laboratories, but in a rapid, low-cost, and easy-to-use format.
Introduction
Lateral flow tests (LFTs) are an ingenious and easy-to-use format for carrying out rapid point-of-care assays1-5. The wicking materials provide a built-in mechanism for moving fluids, and small pores result in fast diffusion for rapid capture and detection of target analytes. However, as a class of devices, LFTs are limited to assays that can be reduced to a single chemical step. In contrast, most laboratory assays for detection of diagnostic biomarkers, such as small molecules, proteins, antibodies, and nucleic acids, are based on multi-step protocols carried out by a human or a machine. For example, the enzyme-linked immunosorbent assay (ELISA) is a widely-used laboratory-based protocol that involves separate timed steps for sample incubation, target labeling, and amplified signal development, with washes between each step. We are developing point-of-care tests that use conventional LFT materials but reconfigure their shape and connectivity to automate multi-step protocols historically reserved for laboratory settings6-13.
Figure 1 conceptually illustrates how a two-dimensional paper network (2DPN) with built-in timing mechanisms can be used to carry out multi-step assay protocols that involve capture and detection of an analyte. The shape is reminiscent of the branched paper devices pioneered by Whitesides’ group14-17, and now applied widely to perform useful assays based on color change chemistries17-31; but it is “upside down” with respect to the flow direction, and its purpose is entirely different. Rather than splitting a sample among multiple detection zones, this structure delivers multiple fluids to a common leg in a timed sequence. The detection zone represents an analyte capture line analogous to that of a conventional LFT, and the design goal is to deliver sample, reagents, and wash fluids to the detection zone in a timed sequence. Fluids contacted with each leg at a single time point are wicked toward the detection zone, but passive delay mechanisms in each leg control the time that each fluid is released. The fluid with the shortest time delay passes through the detection zone first, followed by delivery of fluid from each leg in a timed sequence. The design goal for the 2DPN is simply to coordinate the sequence of “on” and “off” times to deliver a sequence of fluids, much like the timed pipetting steps used in many laboratory assay protocols.
Figure 1.
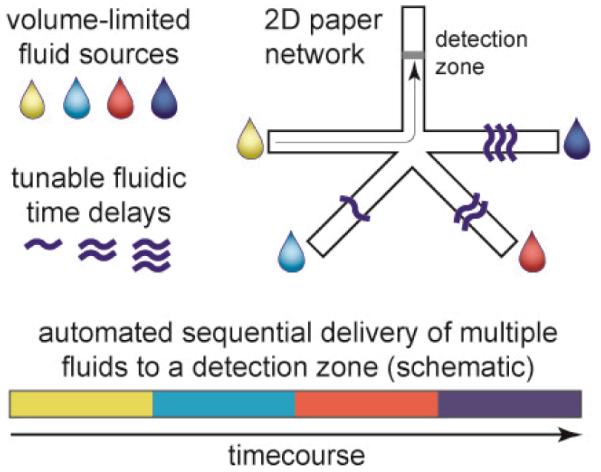
Conceptual illustration of multi-step fluidic programming in a two-dimensional paper network (2DPN). Programming is based on two functions: fluidic time delays that control “on” timing and volume-limited fluid sources that control “off” timing. Each fluid is delivered to a detection zone in a timed sequence. A folding card design is used to contact fluid sources in a single user activation step, and the device automates the multi-step fluidic protocol.
Automated fluidic control in paper devices could enable more sophisticated assays at the POC, but there are very few reports of paper-based mechanisms to control fluid flow. The Whitesides group described manually-activated “push-button” switches for post-fabrication programming of fluid paths prior to a test22, and Li, et al described valves that were activated manually during a test by pushing paper tabs32. The Phillips group used wax treatments to control wicking time in paper; they created strip-based colorimetric timers to indicate assay end-points and fluid delays for simultaneous display of reaction results that require different times25, 26. Chen, et al reported one of the few cases of autonomous switching in paper using fluid-triggered wetting of hydrophobic regions, and they combined delay and trigger elements to perform a two-step sequential delivery33.
We previously described a set of mechanisms for controlling the arrival time and shut off time of reagents in 2D paper networks. For example, we have shown that arrival time can be controlled using inlet legs of various lengths, and volume-limited fluid source pads can be used to control shut-off timing of fluids6, 7, 10, 13. We also showed that the descent of the level of a single fluid source well can be used to control shut-off times as it disconnects from legs of different lengths12. The device in Figure 1 has a different network topology and is based on tunable time delays created in legs of uniform length. Thus, multi-step timed protocols can be programmed by varying the treatment applied to each leg rather than redesign of the geometry itself.
Here, we show that a dissolvable material applied to the paper in solution and dried can be used to create tunable time delays needed to program multi-step protocols in a paper network. We chose to use sugar, specifically sucrose (the main component of table sugar), because sugars are inexpensive, they are a common preservation matrix for dried reagents in existing LFTs (to store dry antibody-gold conjugates), and they are putatively benign to typical assay chemistries (whereas salts would be expected to affect assays). Here, dried sugar creates a time delay that is related to the amount of applied sugar. We show that these paper-based time delays are tunable over a range of times appropriate for point-of-care tests (minutes to nearly an hour) by using different sugar concentrations, and that combining time delays with finite fluid source pads allows automation of timed assay steps. We demonstrate a 4-step assay for signal amplification based on increase in the size of gold nanoparticles for detection of a malarial protein. The same device could be used to carry out other multi-step assay protocols, such as ELISA, including wash steps and signal amplification.
Experimental
Devices were fabricated from common LFT materials cut to shape by a laser cutter (Universal Laser Systems, Scottsdale, AZ). LFT materials included plastic-backed nitrocellulose as the assay strip (Mylar-backed HiFlow Plus 135, HF13504, Millipore, Billerica, MA), cellulose as an absorbent pad (C083, Millipore), and glass fiber pads as fluid sources (Ahlstrom, Helsinki, Finland). Assay devices were fabricated by sticking components onto folding cards made from 0.25 mm thick Mylar film with adhesive coating on one side (10 mil, Fraylock Inc., San Carlos, CA).
Stock sugar solutions were prepared by mixing excess sucrose (#84097, Sigma-Aldrich) in distilled water at room temperature for several days to create a saturated solution; excess sugar was allowed to settle, and dilutions were prepared in distilled water (10%-70% of saturation). At 20°C, the solubility of sucrose in water is 66.7% by mass (2 grams sucrose in 1 gram water)34; sugar concentrations throughout this paper are given as the % of saturation (ϕ) at room temperature (~20°C, e.g., 50% of saturation is ~1 gram sucrose in 1 gram water). Nitrocellulose strips were inserted into a sugar solution until the solution wicked to the desired point on the strip, then excess solution was removed by blotting on tissue paper. For paper networks, sugar solution was wicked into each leg individually, and the strip was removed just before the solution entered the intersection of legs. Sugar was not present in the intersection or main channel. High-concentration sugar solutions required slow insertion to prevent trapping of air in the paper (due to slow penetration of the viscous sugar solutions). Sugar-treated nitrocellulose was dried in a desiccator for several days prior to experiments.
Timing experiments used phosphate buffered saline with 0.05% Tween 20 (PBST) to which food coloring (McCormick, Red) was added. Tween 20 was present above the critical micelle concentration at 20°C (~0.01%), which gives a solution with a surface tension of ~37 mN/m at 20°C35. Commercial nitrocellulose is typically treated with surfactant, so the wicking front may contain surfactant dissolved from the material in addition to that present in the wicking fluid. Fluid fronts were tracked manually from web camera videos (Logitech, Fremont CA) using ImageJ36. For timing experiments, a comb of strips was mounted on an adhesive plastic backing that was enclosed in a plastic case (modified CD jewel case) to reduce evaporation. A trough in the housing was filled with dyed PBST and allowed to sit with the device enclosed to humidify the interior (30-45 minutes); during this time, the device was suspended above the fluid, and flow was initiated by pushing the comb of strips down into the PBST-filled trough using tab on the plastic backing that protruded through an opening in the top of the case.
2DPN devices for flow timing experiments were fabricated in a folding card format using the same methods for delay fabrication described above. To operate the card, fluid was added to each source pad using a pipette, and flow was initiated by folding the card. Adhesive pads (3M Double-Coated Urethane Foam Tape 4026) were used to hold the cards closed. Devices were run in a Petri dish containing wet KimWipes to reduce evaporation. The time course of fluid colour within the detection zone was calculated using ImageJ by creating a stack from video frames, selecting a region of interest (a line across the strip), and performing a “reslice” along the time dimension; thus each pixel line in the time course represented a unit of time. Pixel line size was scaled based on the video frame rate, and timing from this transformation was verified by comparison to original videos.
2DPN devices for the amplified malaria assay were fabricated in folding cards of the same design. A sandwich immunoassay format with signal amplification was used to detect Plasmodium falciparum histidine-rich-protein-2 (PfHRP2), a diagnostic biomarker for malarial infection. Fetal bovine serum (FBS, Certified, One Shot, Invitrogen, Carlsbad, CA) was used as a simulated serum matrix; it was spiked with recombinant PfHRP2 antigen (CTK Biotech, San Diego, CA). The sample was mixed with monoclonal anti-PfHRP2 detection antibody (Immunology Consultants Laboratory, Portland, OR) conjugated to gold nanoparticles (40 nm Immunogold, BBInternational, Cardiff, UK). A gold enhancement solution (Nanoprobes 040260, Nanoprobes, Yaphank, NY) was used for signal amplification, and wash steps were done using Tris-buffered saline with 0.1% Tween 20 (TBST). Signal intensity was measured from videos recorded with the web camera.
Results & Discussion
The wet-out flow through dry paper strips can be slowed by predrying sugar solutions onto the paper. Figure 2A describes the preparation of dried sugar delay zones and the method for measuring the delay time. Paper strips were dipped in sucrose solutions of different concentrations and dried in a desiccator. The concentration of sugar solutions applied to the strips is given as the percent of saturation at room temperature, ϕ; concentrations up to ϕ=70% were used. The set of dry strips, including an untreated strip and a blank (ϕ=0%), were dropped simultaneously into a trough with dyed PBST, and the arrival time at the end of the delay zone (“finish line”) was measured from videos. Figure 2B shows an image during the experiment. For low-concentration delay zones, the flow speed was affected little, creating short delays. For high-concentration delay zones, the fluid flowed slowly until it reached the end of the sugar-impregnated region. As expected, the time to reach the finish line increased with increasing concentration of the applied sugar solution.
Figure 2.

Characterization of time delays created by sugar solutions of different concentration dried on paper strips. A) Method for preparing strips and measuring delay times. Each strip was dipped in a sugar solution and dried in a desiccator. Dry strips were dipped into dyed PBST, and the time required for the fluid to reach the end of the sugar-treated region (finish line) was measured. B) Image during an experiment for a paper comb treated with different sugar solutions on each leg. The finish line is indicated by dashed lines. “B” indicates an untreated strip, and “0%” indicates a strip dipped in DI water (no sugar). C) Quantification of arrival times at the finish line. The symbol ϕ is the percent saturation of the sugar solution (at room temperature) applied to the strips before drying. Axes show the absolute arrival time (left) and the ratio of arrival times (right) for sugar-treated strips relative to the untreated strip “B”. Arrival time for the untreated strip “B” was 44 seconds, and the maximum delay (ϕ=70%) was 53 minutes. The inset shows detail for shorter delay times. Errors were calculated from three experiments (no replicate data for the unfilled point). For data points with small errors, error bars are shown beside the data points. Relative errors (%CV) ranged from 11 to 24%.
Figure 2C shows that the arrival times were tunable across a wide range. For the materials and strip lengths used, arrival times ranged from 44 seconds (ϕ=0%) to 53 minutes (ϕ=70%), which covers an appropriate range for point-of-care assays. The error in arrival time of 11%-24% was comparable to errors for the strip without sugar (12%).
Origin of the time delay in sugar barriers
While the classic Lucas-Washburn (L-W) description of wet-out in a cylindrical pore does not account for the complex dissolution process in sugar-treated strips, it provides a useful framework to discuss the origin of time delays. The L-W equation was originally derived from a balance between the capillary force acting at the fluid front and the viscous resistance to fluid flow,
| (1) |
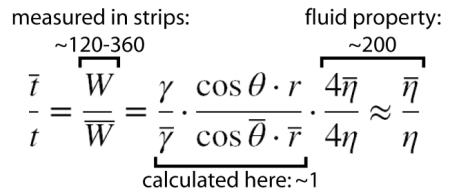
where L is the length the wicking fluid has penetrated the material, γ is the fluid surface tension, cosθ is the contact angle for the three-phase system (here, fluid, solid, air), r is the pore radius (strictly derived for a cylindrical pore), and η is the fluid dynamic viscosity37, 38. Addition of sugar could, in principle, affect each term via changes to fluid properties, wettability, or pore occlusion. The surface tension contribution (γ) is expected to be small since surfactant present in all solutions would be expected to dominate surface tension and hold it constant. The contact angle contribution (cosθ) is expected to be modest since materials form a wetting system in all cases. In contrast, viscosity (η is expected to have a large contribution to wicking times due to the strong dependence of viscosity on sugar concentration (at 20° C, water η=1 mPa·s, saturated sucrose η~200 mPa·s)34. The effect of pore size is difficult to predict since the L-W equation was derived for the case of a single cylindrical pore; wicking in porous membranes follows the functional form well, but the individual terms cannot be interpreted literally. Specifically, the L-W equation includes the pore radius within multiple terms (wetted perimeter, 2πr; volumetric displacement, πr2; viscous resistance, 1/r4) that are geometrically connected for a cylindrical pore and reduce neatly to a 1st order dependence on r. However, the L-W derivation does not account for the properties of complex porous membranes (interconnected, non-uniform pores), and care must be taken not to overinterpret the meaning of r (more in Supplementary Information Section 1).
To identify the relative magnitude of possible contributions to wicking rate (including the unknown dependence on pore size), we designed an experiment to measure wicking into sugar-treated strips with no net dissolution (pore properties fixed and uniform during wet-out). Strips were treated with different sugar solutions (ϕ=0-70%) and dried, as in Figure 2, but the fluid wicked into the strips was a saturated sugar solution instead of buffer (Supp. Fig. S1A); thus, fluid entering the strips was saturated, and dissolution of dried sugar in the pores was suppressed. Surprisingly, all strips wicked the saturated sugar solution at a similar rate (Supp. Fig. S1B) despite large differences in the amount of sugar dried on the strips.
In these experiments pore properties should be unchanging during wet-out (no dissolution), and wicking should follow the basic form of the L-W equation (provided that r is not interpreted literally). To identify the relative contribution of terms, we compared the L-W expressions for two cases:
Case 1. Buffer solution (η~1 mPa·s) wicking into untreated nitrocellulose strips (leftmost strip in Fig. 2)
Case 2. Saturated sucrose solution wicking into sugar-treated nitrocellulose strips (Fig. S1).
For arrival at a given length, the L-W expressions can be combined to give
 |
(2) |
where W represents measured “Washburn coefficients”, and the overbars designate Case 2. For the full range of sugar-treated strips (ϕ=0-70%), the ratio of measured Washburn coefficients for Case 1 and Case 2 was 120-360 (Supp. Fig. S1C). The viscosity ratio of fluids wicked into the strips accounted almost entirely for the observed difference in wicking rates, and the combined contributions of surface tension, contact angle, and pore size were relatively unimportant . A more detailed discussion of these parameters is given in Supplementary Information Section 1. The key observation is that time delay in sugar-treated strips is dominated by the effect of fluid viscosity.
To relate these observations to the case of Figure 2, when dissolution occurs during wet-out, we performed separate experiments with the location of dye reversed to allow visualization of the sugar dissolution pattern. Figure 3 shows images at various times during wet-out for a strip treated with dyed sugar (ϕ = 10%), dried, and wet-out by un-dyed buffer. Two key behaviours can be observed: 1) sugar was rapidly dissolved by the advancing fluid front, which led to a sugar-rich leading edge (red) trailed by relatively sugar-free fluid (white region), and 2) the fluid front was infiltrated by streams of relatively sugar-free fluid, which is consistent with a classic effect known as “viscous fingering” (more below).
Figure 3.
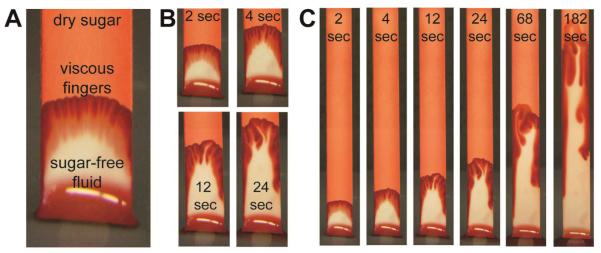
Visualization of wetout in strips with dyed dry sugar showing rapid dissolution and formation of viscous fingers. Sugar solution (ϕ=10%) with added dye was applied to strips and dried, and buffer with no dye was wicked into the strips. A) The dried sugar was rapidly dissolved by the advancing fluid, leading to sugar-rich leading region and a relatively sugar-free trailing region. B) and C) images at different time points showing propagation of viscous fingers. An obvious feature of the fingers is that they coalesce over time.
The strip can be viewed as having two distinct regions: a leading region of saturated sugar wicking through pores containing undissolved sugar (similar to conditions throughout the strip in Case 2 above), and a trailing region of sugar-free fluid wicking through pores free of dried sugar. We constructed a simplified model to estimate the size of the leading region assuming 1) that dried sugar was rapidly dissolved to the point of fluid saturation to create a viscous leading region that grows as the fluid flows up the strip and 2) that this viscous leading region migrates up the strip as an intact bolus (Supp. Fig. S2). The fraction of the wetted region (L) occupied by the viscous bolus (l) scales roughly as l /L ≈ ϕ, and this ratio remains constant during wet-out (Supplementary Information Section 2). The high viscosity in the leading bolus (η ≈ 200 mPa·s) would be the dominant contribution to fluidic resistance for all conditions tested here, and the simplified model predicts delay times that scale roughly as 200*ϕ (Supplementary Information Section 3). Thus, an intact viscous bolus created by complete dissolution would be sufficient to create delays of the magnitude observed (e.g., ratio of arrival times ~140 for ϕ=70%). However, the simplified model does not predict the non-linear dependence on ϕ observed in Figure 2, and it overpredicts time delays, especially for low sugar loading.
As shown in Figure 3, the formation of viscous fingers disrupts the intact viscous bolus and serves to shorten the time delay. Viscous fingering is a classic phenomena caused by a fundamental instability of the interface between a viscous fluid followed by a less viscous fluid under flow; it is a well-studied problem39, 40 made more complex here by dissolution of the viscosity-increasing component. Once a finger advances into the viscous fluid, it provides a self-perpetuating low-resistance pathway for flow. This process shortens the time required for fluid to break through the sugar delay compared to that expected for intact migration of the viscous bolus. We observed that formation of viscous fingers was more rapid at low sugar loadings, which could explain the non-linear dependence shown in Figure 2. Further, viscous fingers shown in Figure 3 have a characteristic width of roughly 1 mm, and we found that formation of viscous fingers could be suppressed in narrow strips. This suggests that time delays could be achieved with less sugar.
Despite the complexity of dissolution and wet-out processes in sugar-treated strips, they provide reproducible time delays that can be tuned across the range appropriate for POC diagnostics.
Sugar barriers as time delays in a paper network
Figure 4 shows a 2DPN designed for sequential delivery of four fluids to a common detection zone. Sequential delivery is based on two principles: 1) flow from each leg is “turned on” at a specific time based on the sugar delay, and 2) each fluid flows until it is “turned off” when the source fluid is depleted. Glass fiber pads (normally used for reagent storage in LFTs) were used because their low capillary force (due to large pore size) allows nearly all fluid to be transferred out of the pad to the 2DPN. We created a folding card format that allows the user to initiate the test by a single folding step (Figure 4A), thus eliminating user timing errors that would arise with multiple fluid applications.
Figure 4.

Folding card design for timed sequential delivery using a 2DPN with sugar time delays and volume-limited fluid source pads. A) Photo of the folding card. The 2DPN with sugar-treated legs was adhered to one leaf of the card, and glass fiber fluid source pads were adhered to the other leaf. B) Schematic of card and fluid sources prior to card activation. The sugar solution applied to each leg is indicated as a percent of saturation at room temperature. Dyed PBST was added to each source pad (11 microliters), and the card was activated by folding. C) Images corresponding to arrival of each fluid at the detection line. White rectangles around the card perimeter are adhesive pads used to hold the card closed. D) Time course of color at the detection line. White arrows indicate transitions between multiple videos used to generate the data; time gaps of <10 seconds between each video are not included in the time course, but these represent a small fraction of the overall time (time gaps were included in all reported numbers). E) Arrival time of each reagent at the detection zone. Errors in arrival time (n=5 devices) are comparable to those for simple strips in Figure 2.
Design for sequential delivery is based on creating delays that allow each fluid source to be depleted before the subsequent delivery step commences (as illustrated in Fig. 1). We found that time delays in a paper network were comparable to those for simple strips (Supplementary Information, Section 4), but selecting time delays in a network device is affected by changing wicking rates over time. For the device of Figure 4, the three delays were chosen by testing different sugar concentrations and observing that no overlap occurred in the delivery of colored fluids. Further discussion of design considerations, including the role of error, is provided in Supplementary Information, Section 5.
Each leg of the 2DPN was treated with a different sugar concentration (including 0% for the first fluid leg), and the device was dried before testing. The 2DPN and absorbent pad were affixed to adhesive zones on one leaf of the card, and reagent pads were affixed to the other leaf (Figure 4B). Dyed PBST was added to each reagent pad, and the card was folded closed to initiate the timed sequence; no user intervention was required after the folding step.
Figure 4C shows images corresponding to the arrival of each fluid at the detection zone. The yellow fluid arrived at the detection zone first (2 minutes) and continued to flow until fluid was depleted from its source pad. At this stage, the difference in progress for each leg could be observed directly; light blue fluid was nearly ready for delivery, red fluid had penetrated its delay by a small amount, and dark blue fluid has penetrated the least. The second frame (5.4 minutes) shows that the yellow fluid flow had ceased, and the light blue fluid had reached the detection zone; subsequent frames show similar delivery of each fluid in turn. Later images show some structure of color within the high concentration delay regions; the self-propagating viscous fingers led to a preferential path for fluid flow through the sugar delay zone. A portion of the sugar often remained in the delay region after fluid breakthrough (and thus not all sugar was carried downstream to the assay).
Figure 4D shows the time course of fluid arrival at the detection zone across the full strip width. Each fluid was displaced effectively by the subsequent fluid, leading to distinct transitions between each fluid (important for wash steps) and providing uniform treatment of the detection zone by each fluid. Figure 4E shows the arrival times and errors for replicate devices (n=5); errors (9-19%) were comparable to those reported for the simple strips in Figure 2.
A multi-step assay for signal amplification
The device design from Figure 4 was used to carry out a multi-step amplified immunoassay. The amplified assay used gold nanoparticles common in LFTs, but the 2DPN added wash steps and application of a gold plating solution that increased the light absorbance of bound gold nanoparticles by increasing their size. This enhancement chemistry (as well as silver deposition on gold) requires several sequential steps. It has been used to increase signal in LFTs via manual assay steps carried out by the user10, 41, 42, and we have automated this chemistry in 2DPN devices based on leg length delays6, 13.
Figure 5A shows the location of sample, reagents, and wash buffer applied to each pad in the 2DPN card; the geometry and sugar delays were the same as those in Figure 4. The assay was deigned to detect a malaria diagnostic biomarker, PfHRP2, spiked into a serum sample. The sample was mixed with the gold-anti-PfHRP2 conjugate (gold-Ab), and this solution was applied to one pad (red); other pads received gold enhancement solution (GE, purple) or wash buffer (light blue). Here, we used liquid reagents, but reagents could be stored dry on each pad so that a user would only need to add sample and buffer to the pads13. Figure 5B shows the component stack for the PfHRP2 assay.
Figure 5.

Automated multi-step malaria assay in a folding card format. A) Card design and reagent locations for the assay. The card design is the same as in Figure 4. The sample (PfHRP2 antigen spiked into fetal bovine serum) was mixed with anti-PfHRP2-gold label (gold-Ab). Gold enhancement (GE) reagent was used to create the amplified gold signal. Each fluid was added to the appropriate pad, and the card was activated by folding it closed. Detection zone: 0.5 μL of 1 mg/mL anti-PfHRP2 antibody spotted on nitrocellulose and dried in a desiccator. Sample/gold: 5.5 μL of 1 μg/mL PfHRP2 antigen in FBS mixed with 5.5 μL anti-PfHRP2-gold in Tris-buffered saline with 1% BSA. Wash fluids: 11 μL of Tris-buffered saline with 0.1% Tween-20 (TBST). GE reagent: 11 μL of commercial reagent. B) Illustration of the amplified sandwich immunoassay. Like ELISA, this amplified chemistry can only be carried out by multiple timed steps. C) Photos of the signal at two time points during the assay. The first image represents signal from gold nanoparticles (endpoint of a typical LFT); the second image shows darkened signal after the GE and final wash step. Non-uniform test line darkness across the strip appears during the first delivery step (sample/gold); since delivery of the first fluid was typically uniform (as in Figure 4), test line non-uniformity was likely caused by the capture line itself. This non-uniformity is typical of strips patterned by our reagent spotting system due to misalignment (strips are cut first, then patterned). D) Time course of darkness at the detection zone. Approximate time periods for delivery of each fluid are indicated by background colors (arrival times approximately 2, 6, 13, and 27 minutes). Normalized test line darkness was calculated by inverting pixel values (larger numbers correspond to darker areas) and normalizing to the full intensity range (zero: darkness of the wetted strip, one: maximum darkness detectable by the camera).
The card was folded to initiate the four assay steps. The gold-Ab-PfHRP2 complex 1) was bound by the capture antibody at the detection zone, followed by 2) a wash to remove unbound label, 3) delivery of the gold enhancement reagent, and 4) a final wash step. These four timed steps were carried out automatically by the device without user intervention during the assay. Figure 5C shows the signal at the detection line at two stages of the assay. After the first two steps (capture of gold-Ab-PfHRP2 complex and wash), the faint pink line represents the endpoint of a typical LFT (no amplification). After the final two steps (gold signal enhancement and final wash), the line was darkened with typical purple-grey color due to increased nanoparticle size. Figure 5D shows the time course of signal measured at the detection line; the background colors indicate the approximate exposure period for each reagent. In the first stage (capture of gold-Ab-PfHRP2 complexes), the signal increased with time, followed by a signal plateau during the first wash step. The third stage (gold signal enhancement) increased the signal, followed by a plateau during the final wash step. Bumps in the signal enhancement phase were due in part to darkness created by the different refractive index of sugar-rich fluids passing through the detection zone. Error in the immunoassay was not characterized, but the step most likely to be affected by timing error is the application of gold enhancement reagent. Since signal during the gold enhancement step increases linearly with time in Figure 5, we would expect errors in signal to be comparable to timing errors. For the device of Figure 4 (same design), measured delivery time errors were 9-19% for the four legs, which is comparable to timing errors in the untreated nitrocellulose.
The demonstration assay in Figure 5 gave a signal enhancement of 2.6-fold, which is about half of that using the gold signal amplification in other 2DPN devices and manually-operated strip tests6, 10, 13. Other amplification chemistries, such as silver enhancement of gold nanoparticles or enzymatic signal amplification used in ELISA, are likely to yield greater sensitivity, and the device in Figure 5 is capable of carrying out the steps for those reactions.
Conclusions
Two basic functions – volume-limited fluid sources and time delays – allow programming of timed fluidic sequences in paper networks. Sugar solutions dried on strips provide fluidic time delays that can be tuned from minutes to nearly an hour with low error. Thus, simple paper networks can be programmed to carry out multi-step assays that are not possible in conventional LFTs without added user steps. The experiments as performed here required loading of four pads with separate liquid reagents. A more practical device would include reagents (and buffer salts) stored dry on each source pad (established practice for LFTs), such that the user would only be required to add water and sample. Fu, et al recently described dry storage of gold-enhancement reagents on pads in a 2DPN13 and strip format with application to the PfHRP2 malaria assay, and Fridley, et al described patterning of gold-enhancement reagents for controlled rehydration in a strip format43. Further, the simplest device would not require any pipetting steps, such that the user adds uncontrolled volumes of sample and water, and the device ensures that accurate volumes are delivered to each pad of the 2DPN. We are now developing methods to automate the pad loading step, such that operation of these devices will be as simple as existing LFTs, but with the advantage of automated multi-step reactions. The basic concept presented here can be applied directly to other immunoassay detection chemistries, such as ELISA, and similar principles can be applied to translate multi-step laboratory protocols, such as nucleic acid tests, to a point-of-care format.
Supplementary Material
Acknowledgements
We gratefully acknowledge the support of NIH Grants RC1EB010593 and R01AI096184 and support from a DARPA DSO Grant HR0011-11-2-0007 to the University of Washington with collaborators at PATH, GE Global Research, and Epoch Biosciences.
Footnotes
Electronic Supplementary Information (ESI) available: [Section 1: parameters contributing to time delay in sugar-treated strips, Section 2. simple model of sugar distribution for complete dissolution, Section 3: simple model of relative resistances for complete dissolution, Section 4: cmparison of delay times in simple strips and paper networks, Section 5: design concepts in paper networks and analysis of delivery times in the assay device].
Notes and references
- 1.Haeberle S, Zengerle R. Lab Chip. 2007;7:1094–1110. doi: 10.1039/b706364b. [DOI] [PubMed] [Google Scholar]
- 2.Mark D, Haeberle S, Roth G, von Stetten F, Zengerle R. Chem. Soc. Rev. 2010;39:1153–1182. doi: 10.1039/b820557b. [DOI] [PubMed] [Google Scholar]
- 3.Posthuma-Trumpie GA, Korf J, van Amerongen A. Anal. Bioanal. Chem. 2009;393:569–582. doi: 10.1007/s00216-008-2287-2. [DOI] [PubMed] [Google Scholar]
- 4.Ngom B, Guo YC, Wang XL, Bi DR. Anal. Bioanal. Chem. 2010;397:1113–1135. doi: 10.1007/s00216-010-3661-4. [DOI] [PubMed] [Google Scholar]
- 5.Weigl B, Domingo G, LaBarre P, Gerlach J. Lab Chip. 2008;8:1999–2014. doi: 10.1039/b811314a. [DOI] [PMC free article] [PubMed] [Google Scholar]
- 6.Fu E, Kauffman P, Lutz B, Yager P. Sens. Actuator B-Chem. 2010;149:325–328. doi: 10.1016/j.snb.2010.06.024. [DOI] [PMC free article] [PubMed] [Google Scholar]
- 7.Fu E, Lutz B, Kauffman P, Yager P. Lab Chip. 2010;10:918–920. doi: 10.1039/b919614e. [DOI] [PMC free article] [PubMed] [Google Scholar]
- 8.Kauffman P, Fu E, Lutz B, Yager P. Lab Chip. 2010;10:2614–2617. doi: 10.1039/c004766j. [DOI] [PMC free article] [PubMed] [Google Scholar]
- 9.Osborn JL, Lutz B, Fu E, Kauffman P, Stevens DY, Yager P. Lab Chip. 2010;10:2659–2665. doi: 10.1039/c004821f. [DOI] [PMC free article] [PubMed] [Google Scholar]
- 10.Fu E, Liang T, Houghtaling J, Ramachandran S, Ramsey SA, Lutz B, Yager P. Anal. Chem. 2011;83:7941–7946. doi: 10.1021/ac201950g. [DOI] [PMC free article] [PubMed] [Google Scholar]
- 11.Fu EL, Ramsey S, Kauffman P, Lutz B, Yager P. Microfluid. Nanofluid. 2011;10:29–35. doi: 10.1007/s10404-010-0643-y. [DOI] [PMC free article] [PubMed] [Google Scholar]
- 12.Lutz BR, Trinh P, Ball C, Fu E, Yager P. Lab Chip. 2011;11:4274–4278. doi: 10.1039/c1lc20758j. [DOI] [PMC free article] [PubMed] [Google Scholar]
- 13.Fu E, Liang T, Spicar-Mihalic P, Houghtaling J, Ramachandran S, Yager P. Anal. Chem. 2012;84:4574–4579. doi: 10.1021/ac300689s. [DOI] [PMC free article] [PubMed] [Google Scholar]
- 14.Martinez AW, Phillips ST, Butte MJ, Whitesides GM. Angew. Chem.-Int. Edit. 2007;46:1318–1320. doi: 10.1002/anie.200603817. [DOI] [PMC free article] [PubMed] [Google Scholar]
- 15.Martinez AW, Phillips ST, Wiley BJ, Gupta M, Whitesides GM. Lab Chip. 2008;8:2146–2150. doi: 10.1039/b811135a. [DOI] [PMC free article] [PubMed] [Google Scholar]
- 16.Bruzewicz DA, Reches M, Whitesides GM. Anal. Chem. 2008;80:3387–3392. doi: 10.1021/ac702605a. [DOI] [PMC free article] [PubMed] [Google Scholar]
- 17.Martinez AW, Phillips ST, Carrilho E, Thomas SW, Sindi H, Whitesides GM. Anal. Chem. 2008;80:3699–3707. doi: 10.1021/ac800112r. [DOI] [PMC free article] [PubMed] [Google Scholar]
- 18.Li X, Tian JF, Garnier G, Shen W. Colloids and Surfaces B-Biointerfaces. 2010;76:564–570. doi: 10.1016/j.colsurfb.2009.12.023. [DOI] [PubMed] [Google Scholar]
- 19.Li X, Tian JF, Shen W. Anal. Bioanal. Chem. 2010;396:495–501. doi: 10.1007/s00216-009-3195-9. [DOI] [PubMed] [Google Scholar]
- 20.Dungchai W, Chailapakul O, Henry CS. Anal. Chim. Acta. 2010;674:227–233. doi: 10.1016/j.aca.2010.06.019. [DOI] [PubMed] [Google Scholar]
- 21.Wang W, Wu WY, Wang W, Zhu JJ. J. Chromatogr. A. 2010;1217:3896–3899. doi: 10.1016/j.chroma.2010.04.017. [DOI] [PubMed] [Google Scholar]
- 22.Martinez AW, Phillips ST, Nie ZH, Cheng CM, Carrilho E, Wiley BJ, Whitesides GM. Lab Chip. 2010;10:2499–2504. doi: 10.1039/c0lc00021c. [DOI] [PubMed] [Google Scholar]
- 23.Martinez AW, Phillips ST, Whitesides GM. Proc. Natl. Acad. Sci. U. S. A. 2008;105:19606–19611. doi: 10.1073/pnas.0810903105. [DOI] [PMC free article] [PubMed] [Google Scholar]
- 24.Abe K, Kotera K, Suzuki K, Citterio D. Anal. Bioanal. Chem. 2010;398:885–893. doi: 10.1007/s00216-010-4011-2. [DOI] [PubMed] [Google Scholar]
- 25.Noh H, Phillips ST. Anal. Chem. 2010;82:8071–8078. doi: 10.1021/ac1005537. [DOI] [PubMed] [Google Scholar]
- 26.Noh N, Phillips ST. Anal. Chem. 2010;82:4181–4187. doi: 10.1021/ac100431y. [DOI] [PubMed] [Google Scholar]
- 27.Ballerini DR, Li X, Shen W. Biomicrofluidics. 2011;5 doi: 10.1063/1.3567094. [DOI] [PMC free article] [PubMed] [Google Scholar]
- 28.Reches M, Mirica KA, Dasgupta R, Dickey MD, Butte MJ, Whitesides GM. ACS Appl. Mater. Interfaces. 2010;2:1722–1728. doi: 10.1021/am1002266. [DOI] [PubMed] [Google Scholar]
- 29.Li X, Tian JF, Shen W. ACS Appl. Mater. Interfaces. 2010;2:1–6. doi: 10.1021/am9006148. [DOI] [PubMed] [Google Scholar]
- 30.Mentele MM, Cunningham J, Koehler K, Volckens J, Henry CS. Anal. Chem. 84:4474–4480. doi: 10.1021/ac300309c. [DOI] [PubMed] [Google Scholar]
- 31.Pollock NR, Rolland JP, Kumar S, Beattie PD, Jain S, Noubary F, Wong VL, Pohlmann RA, Ryan US, Whitesides GM. Sci. Transl. Med. 4 doi: 10.1126/scitranslmed.3003981. [DOI] [PMC free article] [PubMed] [Google Scholar]
- 32.Li X, Tian JF, Nguyen T, Shen W. Anal. Chem. 2008;80:9131–9134. doi: 10.1021/ac801729t. [DOI] [PubMed] [Google Scholar]
- 33.Chen H, Cogswell J, Anagnostopoulos C, Faghri M. Lab Chip. 2012;12:2909–2913. doi: 10.1039/c2lc20970e. [DOI] [PubMed] [Google Scholar]
- 34.Bubník Z, Kadlec P, Urban D, Bruhns M. Sugar technologists manual: Chemical and physical data for sugar manufacturers and users. Dr. Albert Bartens Verlag; Berlin, Germany: 1995. [Google Scholar]
- 35.Rodríguez Niño MR, Rodríguez Patino JM. Journal of the American Oil Chemists’ Society. 1998;75:1241–1248. [Google Scholar]
- 36.Rasband WS. US National Institutes of Health; Bethesda, Maryland, USA: 1997–2010. [Google Scholar]
- 37.Lucas R. Kolloid Z. 1918;23 [Google Scholar]
- 38.Washburn EW. Phys. Rev. 1921;17:273. [Google Scholar]
- 39.Homsy GM. Annu. Rev. Fluid Mech. 1987;19:271–311. [Google Scholar]
- 40.Nittmann J, Daccord G, Stanley HE. Nature. 1985;314:141–144. [Google Scholar]
- 41.Cho IH, Seo SM, Paek EH, Paek SH. J. Chromatogr. B. 2010;878:271–277. doi: 10.1016/j.jchromb.2009.07.016. [DOI] [PubMed] [Google Scholar]
- 42.Cho JH, Han SM, Paek EH, Cho IH, Paek SH. Anal. Chem. 2006;78:793–800. doi: 10.1021/ac051453v. [DOI] [PubMed] [Google Scholar]
- 43.Fridley GE, Le HQ, Fu E, Yager P. Lab Chip. 2012;12:4321–4327. doi: 10.1039/c2lc40785j. [DOI] [PMC free article] [PubMed] [Google Scholar]
Associated Data
This section collects any data citations, data availability statements, or supplementary materials included in this article.