Abstract
This paper is concerned with the prediction of the occurrence of Periventricular Leukomalacia (PVL) that occurs in neonates after heart surgery. The data which is collected over a period of 12 hours after the cardiac surgery contains vital measurements as well as blood gas measurements with different resolutions. The decision tree classification technique has been selected as a tool for prediction of the PVL because of its capacity for discovering rules and novel associations in the data. Vital data measured using near-inferred spectroscopy (NIRS) at the sampling rate of 0.25 Hz and blood gas measurement up to 12 times with irregular time intervals for 35 patients collected from Children's Hospital of Philadelphia (CHOP) are used for this study. Vital data contain heart rate (HR), mean arterial pressure (MAP), right atrium pressure (RAP), blood hemoglobin (Hb), hemoglobin oxygen content (HbO2), oxygen saturation (SpO2) and relative cerebral blood flow (rCBF). Features derived from the data include statistical moments (mean, variance, skewness and kurtosis), trend and min and max of the vital data and rate of change, time weighted mean and a custom defined out of range index (ORI) for the blood gas data. A decision tree is developed for the vital data in order to identify the most important vital measurements. In addition, a decision tree is developed for blood gas data to find important factors for the prediction of PVL occurrence. Results show that in blood gas data, maximum rate of change in the concentration of bicarbonate ions in blood (HCO3) and minimum rate of change in the partial pressure of dissolved CO2 in the blood (PaCO2) are the most important factors for prediction of the PVL. Among vital features the kurtosis of HR and Hb are the most important parameters.
I. INTRODUCTION
Periventricular leukomalacia (PVL) is a neonatal brain injury. The PVL condition causes damage in the ventricles of the brain [1]. Generally motor control problems or other neuro-developmental problems and also cerebral palsy or epilepsy are common in the PVL patients [2], [3]. Recent researches have shown that PVL is very common in neonates before and after cardiac surgery [4]–[6] and so there is a growing interest among clinical researchers to attempt to understand the physiology and pathology of PVL, develop clinical protocols for the prediction and prevention of PVL and also to predict the outcomes of individual patients suffering from PVL [7], [8].
Despite advancement in research in the field of PVL, there are no treatments currently prescribed for PVL. This is due to fact that the origin of PVL and its physiology still remain to be clearly understood. Consequently, all treatment strategies are based in response to pathologies that develop as a consequence of the PVL. In view of the fact that white matter injury in the ventricular parts of the brain can cause variety of deficits and side effects, therefor constant monitoring of PVL infants is necessary to determine the severity of their conditions [9].
Computational intelligence (CI) techniques attract more and more attention from researchers in the biomedical field as a result of their superior performance in comparison with traditional stochastic approaches in prediction, modeling and classification of biomedical signals [10]–[14]. Data mining facilitates data exploration using data analysis methods with sophisticated algorithms in order to discover unknown patterns. The CI techniques include data mining algorithms and techniques such as decision tree (DT) [14]–[16], artificial neural networks (ANNs) [17], support vector machine (SVM), and adaptive neuro-fuzzy inference system (ANFIS) [18].
The main advantages of the decision tree approach are the ability to discover rules hidden in the dataset, the ability to handle both continuous and categorical output variables, and constructing easily interpretable classification rules. Moreover, DT algorithms produce noise robust models and rules because they are constructed based on the maximizing information gain. Also DT algorithms produce reliable and effective results with high accuracy and could handle missing data and are especially appropriate to support decision-making processes in medicine.
In this study, we investigate how DT algorithms are valuable to discover rules from the collected data and help clinicians predict the occurrence of the PVL. The aim is to identify the most important measurements and derived features based on the extracted classification rules. These rules will enable better management of the patients.
II. MATERIALS AND METHODS
A. Data Collection
Data from 35 neonates after neonatal cardiac surgery were collected according to a pre-specified protocol at the Children's Hospital of Philadelphia (CHOP). Subjects of this study are limited to two cases of congenital heart disease, hypoplastic left heart syndrome (HLHS) and transposition of great arteries (TGA), accounting for the fact that these two diseases are considered to have the highest likelihood of PVL occurrence as their postoperative effect. For each patient, vital data collected every 4 seconds contains heart rate (HR), mean arterial pressure (MAP), right atrium pressure (RAP), oxygen saturation (SpO2), hemoglobin (Hb), hemoglobin oxygen content (HbO2) and relative cerebral blood flow (rCBF). Hb, HbO2 and rCBF are collected using near-infrared spectroscopy (NIRS). The NIRS is a spectroscopic method that uses the near-infrared region of the electromagnetic spectrum. Demographic data collected includes sex, type of disease, cardiac bypass duration and deep hypothermic circulatory arrest duration for each patient as well as blood gas measurements. Collected blood gas measurements are presented in Tab. I.
TABLE I.
Collected Blood Gas Data
| Measurement | Description | Unit |
|---|---|---|
| pH | Arterial blood pH | |
| PaCO 2 | Partial pressure of dissolved CO2 | mmHg |
| PaO 2 | Partial pressure of dissolved O2 | mmHg |
| HCO 3 | Concentration of bicarbonate ions | mmol/L |
| O 2 Sat | Arterial oxygen saturation | % |
| Hgb | Hemoglobin concentration | g/dL |
| K + | Ionized Potassium | mmol/L |
| Ca ++ | Ionized Calcium | mmol/L |
| Na + | Ionized sodium | mmol L |
| Hct | Hematocrit | % |
In our previous work [19] we developed a cycle-averaged model of the HLHS heart to study effects of the various parameters on surgical outcome. The developed model provides a very useful tool to better understand the principal factors that drive the HLHS physiology and could be significant for improving patient management. However, there is no physics based model for the blood gas data and also of vital data such as hemoglobin which renders application of CI based techniques particularly attractive for this problem.
B. Feature Extraction
Based on the collected set of physiological parameters a feature pool was developed. The feature pool is different for vital and blood gas measurements. The derived features of vital measurements include: min, max, mean, variation, skewness, kurtosis and trend. Skewness and kurtosis are third and forth order statistical moment of random variable defined by Eq. (1).
| (1) |
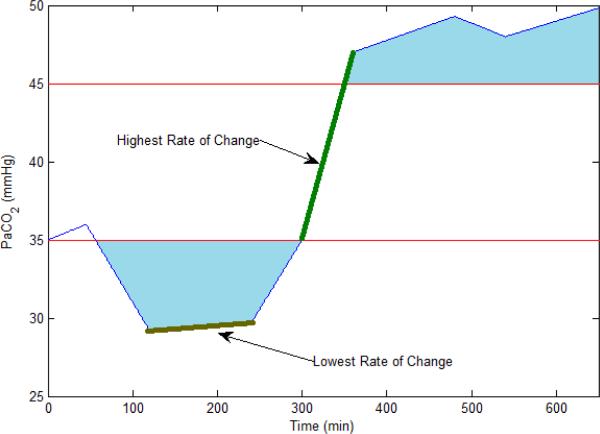
where, n is the order, μ is the mean value of the data and E is the expected value. The derived features from the blood gas data are maximum and minimum values of the rate of change of measurements, time weighted mean, and out of range index (ORI). The rate of blood gas measurement change is defined as the slope of the line connecting two consecutive measurements. Blood gas measurements are discontinuous and to overcome this problem the data is linearly interpolated assuming there is no sudden change happening in the data, a fact confirmed by the clinicians. Time weighted mean is simply calculated using Eq. (2).
| (2) |
where, m is the number of measurements and x is the measured variable. We define the out of range index (ORI) as an area which is bounded by lower or upper normal range of the data and the measurement waveform. The upper and lower limit of the normal range for the measured blood gas data are presented in Tab. II. This index is an important indicator taking into account both the time that variable has been out of range and also the out of range value. The ORI has the unit of the variable it is calculated for multiplied by time. For example the ORI for PaCO2 has units of mmhg.s. Figure (1) shows the defined feature for a data sample.
TABLE II.
Normal Range of Blood Gas Data
| Measurement | Lower Limit | Upper Limit |
|---|---|---|
| pH | 7.34 | 7.44 |
| PaCO 2 | 35 | 45 |
| PaO 2 | 75 | 100 |
| HCO 3 | 22 | 26 |
| O 2 Sat | 95 | 100 |
| Hgb | 14 | 16 |
| K + | 3.5 | 5 |
| Ca ++ | 8.5 | 10.5 |
| Na + | 135 | 145 |
| Hct | 36 | 44 |
Fig. 1.
Plot of features derived from a sample blood gas measurement. The blue area is the ORI index of the PaCO2 for a sample patient.
III. DECISION TREE
The goal of DT is to use a dataset with known attribute-class combinations for generating a tree structure with a set of rules for classification and prediction of the desired event. The DT consists of a root, the internal decision nodes and a set of terminal nodes or leaves, each representing a class. There are two phases in DT induction: tree building and tree pruning.
A. Tree Building
The CART algorithm [20], which uses the recursive partitioning approach to DT rule induction, is employed to develop DT. The algorithm uses a selected criterion to build the tree. It works topdown, seeking at each stage an attribute to split on that which best separates the classes, and then recursively processing the sub problems that result from the split. The algorithm uses a heuristic algorithm for pruning which is based on the statistical significance of the splits.
To split the data, DT maximizes the information gain (IG) of the system (which in turn reduces the information entropy). The IG of an attribute A is used to select the best splitting criterion attribute. The features with the highest IG is selected to build the DT. The IG for attribute A is defined by Eqn. (3):
| (3) |
where, pi is the probability of class i in dataset D, m is the number of classes in this study 2, |Dj| is the number of observations with attribute value j in dataset D, |D| is the total number of observations in dataset D, and ν is number of all attribute values. For example, if attribute S has values {1, 2, 2, 3, 2, 3, 1}, then ν will be 3.
Large number of different values for the output will cause problems in implementing the information gain measure of the data, in this case the gain ratio is used instead [16]. The Gini index (GI) is an impurity-based criterion that measures the divergence between the probability distributions of the target attributes values [21]. The GI is defined by Eqn. (4) and Eqn. (5):
| (4) |
where,
| (5) |
B. Tree Pruning
The tree generated in the tree building phase is usually large, complex, and an over-fit to the training data. Over-fitting is a significant practical difficulty for decision tree learning especially if the training dataset is noisy or if it is not large enough to represent the test dataset. To improve generalization of the classification tree, we prune the tree using a Fishers exact test (FET) based pruning approach as described in [14], [22]. We use 0.05 as the p-value threshold for determining whether or not to prune a node of the developed tree.
IV. RESULTS
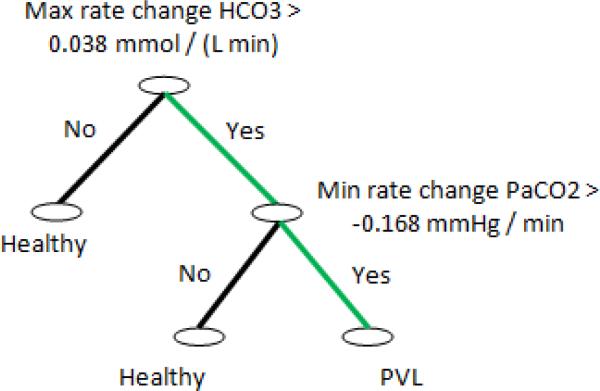
A DT based on the features derived from blood gas data was generated and is shown in Fig. (2). Results show that among all the variables and features the maximum rate of change of HCO3 and the minimum rate of change of PaCO2 are the most important parameters for the PVL occurrence prediction. This result confirms our previous finding presented in [17] which highlighted the role of blood CO2 concentration as an important factor in the PVL prediction. This result also show the importance of the rate of change in blood gas data as an indicator of hemodynamic instability which could lead to PVL. The developed DT also shows that the following rule plays the strongest role in the prediction of PVL based on the blood gas measurements.
| (6) |
where, ∧ is the logical and operator.
Fig. 2.
Result of forming DT for all features derived from blood gas data. Results show that among all variables and features maximum rate of change of HCO3 and minimum rate of change of PaCO2 are the most valuable parameters for predicting PVL. The green path represent the strongest rule in DT decision making.
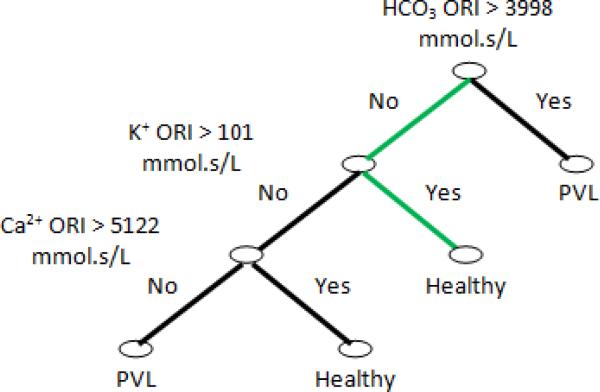
In order to investigate the next important features of blood gas measurements, we drop rate of change features from our feature pool and form a DT based on the remaining feature pool. The resulting DT is shown in Fig. (3) and illustrates the importance of our defined ORI. The results are surprising in that the developed DT shows that an increase in Ca++ and K+ ORI and the condition that HCO3 ORI is high will decrease the probability of PVL occurrence. At this time the exact physiological basis for f this finding is not understood.
Fig. 3.
Result of forming DT from remaining features derived from blood gas data. Results show that K, CA and HCO3 ORI are the most valuable parameters for predicting PVL. The green path represent the strongest rule in DT decision making.
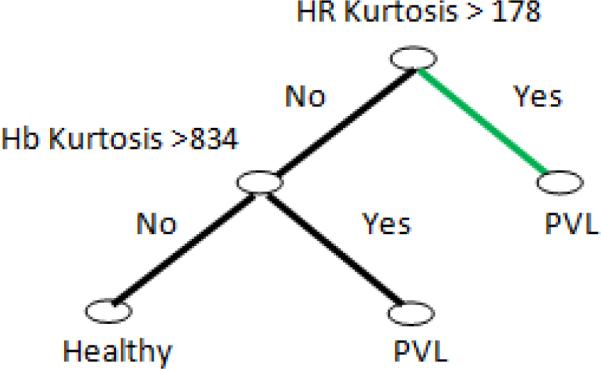
Next, a DT is built from the features of vital measurements and is shown in Figure (4). According to this, the kurtosis of HR and Hb are the most important factors for PVL prediction. In probability theory and statistics, kurtosis is any measure of the “peakedness” of the probability distribution of a real-valued random variable [23]. High kurtosis is associated with more outlying values. Increased HR uncertainty is suggested as a PVL predictor in some references [4]. A possible explanation for this result is that an increase in uncertainty in HR will increase instability in the cardiac output which directly affects the oxygen delivery to the brain. Insufficient and unstable supply of oxygen will severely damage any organ, especially a sensitive organ such as the brain.
Fig. 4.

Result of forming DT from features derived from vital measurements. Results show that kurtosis of HR and Hb are the most important factors for PVL prediction from vital measurements. The green path represents the strongest rule in DT decision making.
V. CONCLUSIONS
In this paper we have applied a Computational Intelligence technique to discover and highlight hidden patterns in the hemodynamic data collected from neonates after heart surgery which may aid in the development of a predictive tool for periventricular leukomalacia (PVL). The PVL is a type of white matter brain injury which is common in neonates after congenital heart surgery. The exact causes of PVL still remain unknown. Our results show that HR and Hb from vital data are the most important vital measurements to look at for the PVL prediction. Moreover, the maximum and minimum values of the rate of change of HCO3 and PaCO2 are the most important parameters from the blood gas data. While the findings of this study seem to be very interesting and important, it still needs more validation from a physiological point of view. Hence, the next step of the current study is to investigate the physiological reasons behind these findings. For example, questions that need investigating include: how does increased uncertainty in Hb result in the PVL occurrence and how does the CO2 will affect the PVL occurrence. Furthermore, additional data is needed to prove the robustness of the developed algorithm to measurement noise and application to special cases.
ACKNOWLEDGMENT
The research reported in this paper is supported by a grant from National Institute of Health (No. 1 R01 NS 72338 01A1). The medical data was provided by Children's Hospital of Philadelphia.
REFERENCES
- 1.Galli KK, Zimmerman RA, Jarvik GP, Wernovsky G, Kuypers MK, Clancy RR, Montenegro LM, Mahle WT, Newman MF, Saunders AM, Nicolson SC, Spray TL, Gaynor JW. Periventricular leukomalacia is common after neonatal cardiac surgery. J Thoracic Cardiovascular Surgery. 2004 Mar;127(3):692–704. doi: 10.1016/j.jtcvs.2003.09.053. [DOI] [PubMed] [Google Scholar]
- 2.Volpe JJ. Neurology of the Newborn. 4th ed. Saunders; 2001. [Google Scholar]
- 3.Volpe JJ. Cerebral white matter injury of the premature infant-more common than you think. Pediatrics. 2003;112:176–180. doi: 10.1542/peds.112.1.176. [DOI] [PubMed] [Google Scholar]
- 4.Gaynor JW. Periventricular leukomalacia following neonatal and infant cardiac surgery. Seminars in Thoracic and Cardiovascular Surgery: Pediatric Cardiac Surgery Annual. 2004;7:133–140. doi: 10.1053/j.pcsu.2004.02.007. [DOI] [PubMed] [Google Scholar]
- 5.McQuillen PS, Goff DA, Licht DJ. Effects of congenital heart disease on brain development. Progress in Pediatric Cardiology. 2010;29(2):79–85. doi: 10.1016/j.ppedcard.2010.06.011. [DOI] [PMC free article] [PubMed] [Google Scholar]
- 6.McQuillen PS, Miller SP. Congenital heart disease and brain development. Annals of the New York Academy of Sciences. 2010;1184:68–86. doi: 10.1111/j.1749-6632.2009.05116.x. [DOI] [PubMed] [Google Scholar]
- 7.Glass HC, Fujimoto S, Ceppi-Cozzio C, Bartha AI, Vigneron DB, Barkovich AJ, Glidden DV, Ferriero DM, Miller SP. White-matter injury is associated with impaired gaze in premature infants. Pediatric Neurololgy. 2008;38(1):10–15. doi: 10.1016/j.pediatrneurol.2007.08.019. [DOI] [PMC free article] [PubMed] [Google Scholar]
- 8.van Haastert IC, de Vries LS, Eijsermans MJC, Jongmans MJ, Helders PJM, Gorter JW. Gross motor functional abilities in preterm-born children with cerebral palsy due to periventricular leukomalacia. Developmental Medicine and Child Neurology. 2008 Sep;50(9):684–689. doi: 10.1111/j.1469-8749.2008.03061.x. [DOI] [PubMed] [Google Scholar]
- 9.Gururaj A, Sztriha L, Bener A, Dawodu A, Eapen V. Epilepsy in children with cerebral palsy. Seizure: the Journal of the British Epilepsy Association. 2003;12:110–114. doi: 10.1016/s1059131102002558. [DOI] [PubMed] [Google Scholar]
- 10.Podgorelec V, Kokol P, Stiglic MM. Searching for new patterns in cardiovascular data. Proc. 15th IEEE Symp. Computer-Based Medical Systems (CBMS 2002) 2002:111–116. [Google Scholar]
- 11.Tan KC, Yu Q, Heng CM, Lee TH. Evolutionary computing for knowledge discovery in medical diagnosis. Artificial Intelligence in Medicine. 2003;27(2):129–154. doi: 10.1016/s0933-3657(03)00002-2. [DOI] [PubMed] [Google Scholar]
- 12.Stasis AC, Loukis EN, Pavlopoulos SA, Koutsouris D. A decision tree-based method, using auscultation findings, for the differential diagnosis of aortic stenosis from mitral regurgitation. Proc. Computers in Cardiology. 2003:769–772. [Google Scholar]
- 13.Dounias G, Linkens D. Adaptive systems and hybrid computational intelligence in medicine. Artificial Intelligence in Medicine. 2004 Nov;32(3):151–155. doi: 10.1016/j.artmed.2004.07.005. [DOI] [PubMed] [Google Scholar]
- 14.Singh A, Guttag JV. A comparison of non-symmetric entropy-based classification trees and support vector machine for cardiovascular risk stratification. Proc. Annual Int Engineering in Medicine and Biology Society, EMBC Conf. of the IEEE. 2011:79–82. doi: 10.1109/IEMBS.2011.6089901. [DOI] [PubMed] [Google Scholar]
- 15.Samanta B, Bird GL, Kuijpers M, Zimmerman RA, Jarvik GP, Wernovsky G, Clancy RR, Licht DJ, Gaynor JW, Nataraj C. Prediction of periventricular leukomalacia. part I: Selection of hemodynamic features using logistic regression and decision tree algorithms. Artificial Intelligence in Medicine. 46(3):201–215, 2009. doi: 10.1016/j.artmed.2008.12.005. [DOI] [PMC free article] [PubMed] [Google Scholar]
- 16.Karaolis MA, Moutiris JA, Hadjipanayi D, Pattichis CS. Assessment of the risk factors of coronary heart events based on data mining with decision trees. IEEE Transactions on Information Technology in Biomedicine. 2010;14(3):559–566. doi: 10.1109/TITB.2009.2038906. [DOI] [PubMed] [Google Scholar]
- 17.Samanta B, Bird GL, Kuijpers M, Zimmerman RA, Jarvik GP, Wernovsky G, Clancy RR, Licht DJ, Gaynor JW, Nataraj C. Prediction of periventricular leukomalacia. part II: Selection of hemodynamic features using computational intelligence. Artificial Intelligence in Medicine. 2009;46(3):217–231. doi: 10.1016/j.artmed.2008.12.004. [DOI] [PMC free article] [PubMed] [Google Scholar]
- 18.Jalali A, Ghaffari A, Ghorbanian P, Nataraj C. Identification of sympathetic and parasympathetic nerves function in cardiovascular regulation using ANFIS approximation. Artificial Intelligence in Medicine. 2011;52(1):27–32. doi: 10.1016/j.artmed.2011.01.002. [DOI] [PubMed] [Google Scholar]
- 19.Jalali A, Nataraj C. A cycle-averaged model of hypoplastic left heart syndrome (HLHS) Proc. Annual Int Engineering in Medicine and Biology Society, EMBC Conf. of the IEEE. 2011:190–194. doi: 10.1109/IEMBS.2011.6090030. [DOI] [PubMed] [Google Scholar]
- 20.Quinlan JR. C4.5: Programs for machine learning. San Francisco. Morgan Kaufmann Publishers Inc.; CA, USA: 1993. [Google Scholar]
- 21.Breiman L, Friedman J, Stone CJ, Olshen RA. Classification and Regression Trees. Wadsworth Int. Group; 1984. [Google Scholar]
- 22.Liu W, Chawla S, Cieslak D, N. C. A . Proceedings of the Tenth SIAM International Conference on Data Mining. Society for Industrial and Applied Mathematics; 2010. A robust decision tree algorithms for imbalanced data sets; pp. 766–777. [Google Scholar]
- 23.Dodge Y, Cox D, Commenges D, Davison A, Solomon P, Wilson S, editors. The Oxford Dictionary of Statistical Terms. 6th ed. Oxford University Press; 2006. [Google Scholar]


