Abstract
It is well established that autoantibodies against desmoglein 3 and desmoglein 1 are relevant in the pathogenesis of pemphigus vulgaris and pemphigus foliaceus, including its endemic form, Fogo Selvagem (FS). Isolated reports have shown that in certain patients with these diseases, autoantibodies against other desmosomal cadherins and E-cadherin may also be present. The goal of this investigation was to determine if FS patients and normal individuals living in endemic areas possess autoantibodies against other desmosomal cadherins and E-cadherin. Testing a large number of FS and endemic control sera by ELISA we find a consistent and specific autoantibody response against desmoglein 1 and other keratinocyte cadherins in these individuals, which is quite different from US controls. Overall, the highest correlations among the autoantibody responses tested are in the endemic controls, followed by FS patients, and lowest in the US controls. These findings suggest that multiple, perhaps cross reactive, keratinocyte cadherins are recognized by FS patients and endemic controls.
Introduction
Both non-endemic pemphigus foliaceus (PF) and Fogo Selvagem (FS), show subcorneal epidermal blisters and pathogenic anti-desmoglein 1 (Dsg1) IgG autoantibodies (Beutner and Jordon, 1964; Beutner et al., 1968; Diaz et al., 1989a; Roscoe et al., 1985; Stanley et al., 1986a; Stanley et al., 1986b). FS patients usually live in rural areas of certain states of Brazil where the prevalence of disease is higher than in urban communities (Diaz et al., 1989b). The disease exhibits a strong association with the HLA-DRB1*0102, 0404 and 1402 alleles (Moraes et al., 1997). It is thought that an environmental antigen(s) may trigger FS (Flores et al., 2009).
One of the relevant target antigens in both PF and FS is the desmosomal cadherin, Dsg1 (Buxton et al., 1993; Stanley et al., 1986a). Desmosomal cadherins are transmembrane glycoproteins that are critical components of the desmosome, one of the keratinocyte intercellular junctions (Desai et al., 2009). They include the desmogleins (Dsg) and desmocollins (Dsc), each with well characterized isoforms; four of Dsg (Dsg1–4) and three of Dsc (Dsc1–3) (Thomason et al., 2010). Desmosomal cadherins are structurally and functionally similar to the classic E-cadherin, which is the molecular component of the adherens junction. Adherens junctions are structurally located in the interdesmosomal regions of the keratinocyte cell surface (Green et al., 2010).
IgG anti-desmosomal autoantibodies from PF and FS sera are routinely detected by indirect immunofluorescence (IF), which for decades have been utilized as a diagnostic test for these diseases. The application of ELISA techniques using recombinant human Dsg1 has improved diagnostic accuracy (Amagai et al., 1999) and made it possible to test large numbers of individuals living in communities where FS is endemic (Qaqish et al., 2009; Warren et al., 2003). ELISA studies have also identified IgG4 anti-Dsg1 autoantibodies as a serological predictor of FS (Qaqish et al., 2009; Warren et al., 2003). Moreover, anti-Dsg1 autoantibodies of the IgM (Diaz et al., 2008) and IgE (Qian et al., 2011) class have also been detected in the sera of a large number of FS patients, suggesting an ongoing environmental trigger. While anti-Dsg1 IgG and IgG4 autoantibodies have been shown to be pathogenic in PF and FS (Rock et al., 1989), there have been reports of autoantibody responses to other members of the cadherin family of proteins in certain pemphigus phenotypes. Dsg3 is diagnostic and pathogenically relevant in pemphigus vulgaris (PV) (Amagai et al., 1991), while Dsc antigens may be relevant in IgA pemphigus (Duker et al., 2009) and certain forms of PV (Mao et al., 2010). Autoantibodies against Dsg4 (Nagasaka et al., 2004) and E-cadherin (Evangelista et al., 2008) have also been described in PV and PF, respectively.
It is accepted that the desmosome, specifically its structural component Dsg1, is the target of pathogenic IgG4 polyclonal autoantibodies generated by FS patients. The IgG response in FS is complex and may result from exposure to environmental antigens and/or to self Dsg1. Moreover, the final pathogenic IgG4 response may evolve via phenomena such as crossreactivity with other desmosomal cadherins and/or epitope spreading. The aim of this study, therefore, was to determine the IgG autoantibody profile for each of the eight keratinocyte cadherins in a large number of subjects from three groups, i.e. FS patients, healthy individuals from US (US controls) and healthy individuals living in an endemic area of FS (endemic controls). We find that a substantial number of FS patients and endemic controls possess autoantibodies not only to Dsg1, but to other keratinocyte cadherins as well. Some of these autoantibody responses show strong correlations in the FS and endemic control groups.
Results
Index value distribution and comparison of 8 antigen/antibody systems in FS patients and two healthy control groups
Sera of 101 FS patients, 106 healthy controls from the US (US controls), and 106 healthy controls from endemic areas (endemic controls) were tested for the presence of IgG autoantibodies to Dsg1, Dsg2, Dsg3, Dsg4, Dsc1, Dsc2, Dsc3, and E-cadherin by ELISA. The distribution of index values for each antigen/antibody system is depicted in box plot format (Figure 1). Median index values are reported in Table 1. To evaluate for significant differences, the data was further analyzed using a 24 pairwise comparison (three groups of sera compared to each other for each of 8 antigen/antibody systems). A Bonferroni correction was used to adjust for multiple comparisons among 24 tests; thus, for an overall alpha of 0.05, only p values below 0.05/24=0.0021 are considered significant (Table 1).
Figure 1.
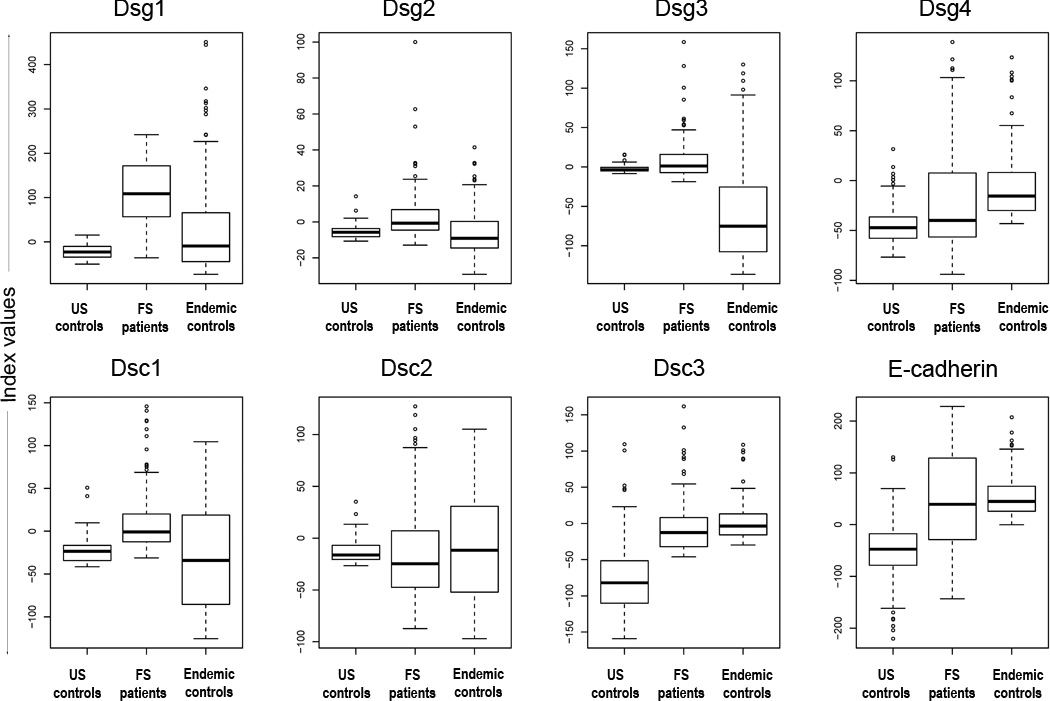
The distribution of index values among US controls, FS patients, and endemic controls. Dsg1 ELISA index values show the greatest separation of FS patients from both sets of controls (p<0.0001), but show no difference between the control groups (p=0.0162). Each box extends from the lower to the upper quartile (25–75%) with the median shown as a thick line within the box. The whiskers extend away from the box to the most extreme data point, which is no more than 1.5 times the length of the box. Data points beyond the whiskers are individually marked.
Table 1.
Comparison of distributions of index values for US controls, FS patients, and endemic controls. Index value medians and p-values for all pairwise comparisons using the Wilcoxon two-sample test are shown.1
| Index value medians | p-values for comparison of index value distributions | |||||
|---|---|---|---|---|---|---|
| US controls |
FS patients |
Endemic controls |
US controls vs. FS patients |
US controls vs. Endemic controls |
FS patients vs. Endemic controls |
|
| Dsg1 | −22.83 | 108.79 | −9.26 | <.0001* | 0.0162 | <.0001* |
| Dsg2 | −5.72 | −0.73 | −9.09 | <.0001* | 0.015 | <.0001* |
| Dsg3 | −3.78 | 1.21 | −75.16 | 0.001* | <.0001* | <.0001* |
| Dsg4 | −47.28 | −39.93 | −15.59 | 0.0088 | <.0001* | <.0001* |
| Dsc1 | −23.51 | −0.86 | −34.13 | <.0001* | 0.1119 | <.0001* |
| Dsc2 | −16.22 | −24.65 | −11.68 | 0.012 | 0.802 | 0.4033 |
| Dsc3 | −82.00 | −12.62 | −3.57 | <.0001* | <.0001* | 0.0007* |
| E-cad | −47.47 | 39.11 | 44.67 | <.0001* | <.0001* | 0.2524 |
The data from which these medians and p-values were derived are depicted in Figure 1. In order to adjust for multiple comparisons with an overall alpha of 0.05, only p-values below 0.05/24=0.0021 are considered statistically significant (marked by an asterisk). Total number of subjects in each group are as follows: US controls (n=106), FS patients (n=101), and endemic controls (n=106).
As expected, we find higher anti-Dsg1 index values in FS patients than in US and endemic controls (median 108.79 vs. −22.83 and −9.26, respectively; p<0.0001). The differences are also significant when comparing index values of FS patients and US controls in 5 of the 7 remaining antigen/antibody systems (Dsg4 and Dsc2 were not significant). Additionally, the differences between index values of FS patients and endemic controls are all significant, except for Dsc2 and E-cadherin responses (p=0.4033 and p=0.2524, respectively).
Comparison of index values of US controls and endemic controls reveals statistically significant differences for 4 antigen/antibody systems (Dsg3, Dsg4, Dsc3 and E-cadherin). There are 3 antigen/antibody systems where the endemic controls have higher index values than US controls, i.e. Dsg4 (median −15.59 vs. −47.28; <0.0001), Dsc3 (median −3.57 vs. −82.00; p<0.0001) and E-cadherin (median 44.67 vs. −47.47; p<0.0001), and 1 where the index values of US controls are higher than endemic controls, i.e. Dsg3 (median −3.78 vs. −75.16; <0.0001). The differences in index values for the remaining antigen/antibody systems were not significant (Dsg1 p=0.0162, Dsg2 p=0.0150, Dsc1 p=0.1119, and Dsc2 p=0.802).
The receiver operator characteristic (ROC) of each of the eight antigen/antibody systems in FS patients and US controls
In order to define the relationships of specificity and sensitivity of each of the eight antigen/antibody systems using the index values obtained in the FS patients and US controls we generated receiver operator characteristic (ROC) curves for each system (Figure 2). ROC curves were generated by plotting sensitivity against 1-specificity as the cutpoint is varied over the entire range of index values from a disease group (in this case FS patients) and a negative control group (US controls). The estimated area under the curve (AUC) is a summary of the entire ROC curve and is unaffected by choice of a cutpoint as is the case for sensitivity and specificity. The AUC is interpreted as the probability that a randomly selected patient will have a higher value than a randomly selected healthy control for the test in question. The three highest estimated AUCs are for Dsg1 (0.98, 95% CI: 0.96–1.0), Dsc3 (0.90, CI: 0.85–0.94) and Dsc1 (0.88, CI: 0.84–0.93). It is noted that despite the high number of statistically significant differences found between FS patients and US controls as depicted in Table 1, there is significant overlap in the distribution of index values in many of the antigen/antibody systems (Figure 1) which is reflected by low AUC values (Figure 2).
Figure 2.
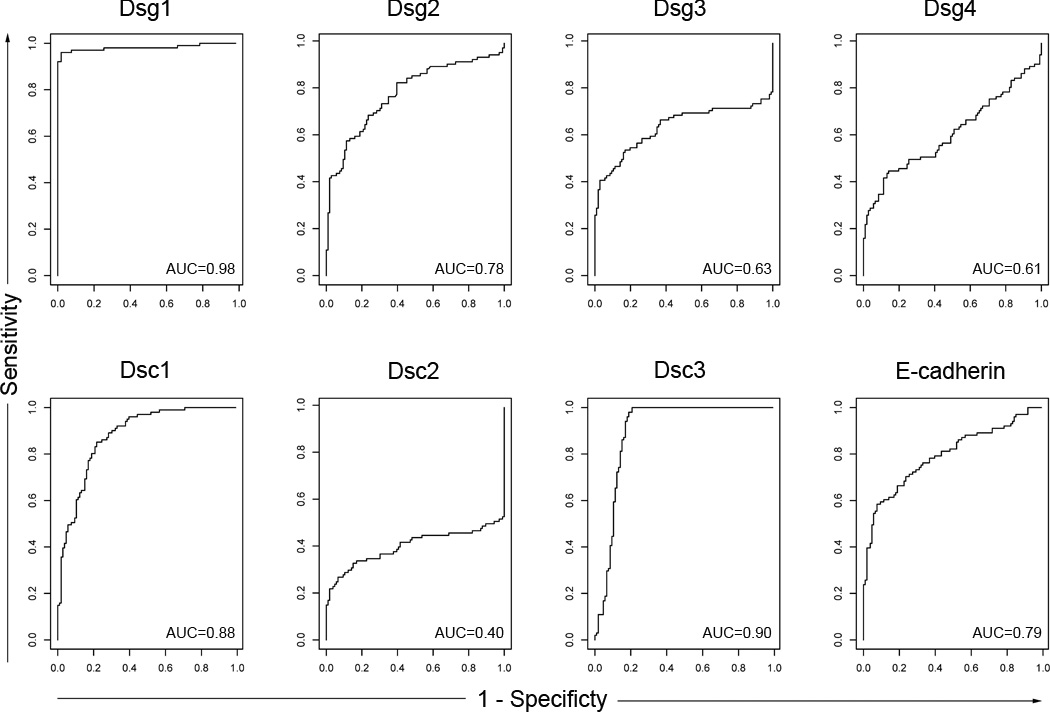
Receiver operator characteristic curves (ROC curves) generated from US controls and FS patient data. The ROC curve is a scatter plot of sensitivity against 1-specificity as the cutpoint is varied over the entire range of index values. The area under the curves (AUCs) generated from these curves are shown in the right lower quadrant of each ROC box. The AUCs show that the highest performing antigen/antibody systems are Dsg1 (0.098), Dsc1 (0.88), and Dsc3 (0.90).
Percentage of serologically positive individuals in FS patients, endemic controls and US controls for each of the eight antigen/antibody systems tested
For each antigen/antibody system, we selected the cutpoint that would generate a specificity of 95%, i.e. false positive rate of 5% among US controls (Table 2). We defined all index values above the cutpoint as positive and then determined the percentage of FS patients and endemic controls testing positive for each antigen/antibody system (Figure 3). Figure 3 shows the 5% false positive rate among US controls induced by the cutpoint selected. The FS patients show a high percentage (97%) of individuals with IgG reactivity to Dsg1. The FS patients also show a high percentage of individuals that test positive with each of the remaining 7 antigens (~ 40% for Dsg2, Dsg3, Dsc1 and ~50% for E-cadherin). Lower numbers of positive patients are found in the Dsg4 (~30%), Dsc2 (~20%) and Dsc3 (<20%) systems. A high percentage of endemic controls are also positive for the 8 antigens tested: ~ 55% for E-cadherin, ~40% for Dsg1 and Dsc2, ~30% for Dsc1, ~28% for Dsg4 and ~ 20% for Dsg2. Lower percentages of positive individuals are detected in the Dsg3 (~14%) and Dsc3 (~12%).
Table 2.
Index value cutpoints selected for the 8 antigen/antibody systems
| Antigen | Cutpoint1 | Sensitivity | Specificity |
|---|---|---|---|
| Dsg1 | 5 | 96% | 95% |
| Dsg2 | 1.2 | 43% | 95% |
| Dsg3 | 5 | 41% | 95% |
| Dsg4 | 0.54 | 29% | 95% |
| Dsc1 | 4 | 42% | 95% |
| Dsc2 | 10 | 23% | 95% |
| Dsc3 | 25 | 15% | 95% |
| E-cadherin | 40 | 49% | 95% |
Cutpoints were generated by selecting a set specificity of 95%.
Figure 3.
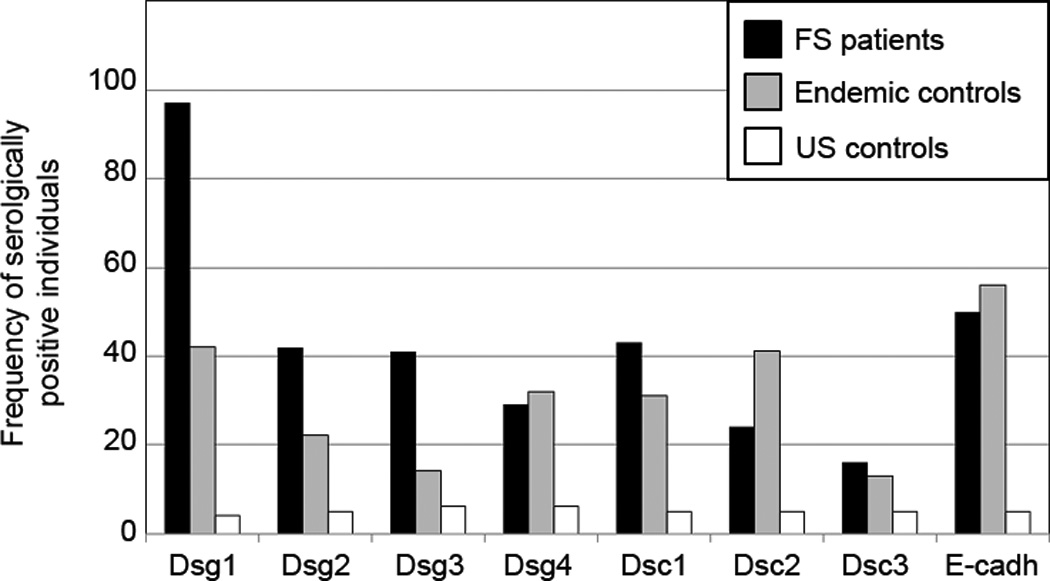
Percentage of serologically positive individuals among FS patients, endemic controls, and US controls for each of the eight antigen/antibody systems. This bar graph represents positive sera as defined by the cutpoint. FS patients (black bars), endemic controls (grey bars), and US controls (white bars) are shown.
The correlation of index values of the 8 antigen/antibody systems in FS patients and two healthy control groups
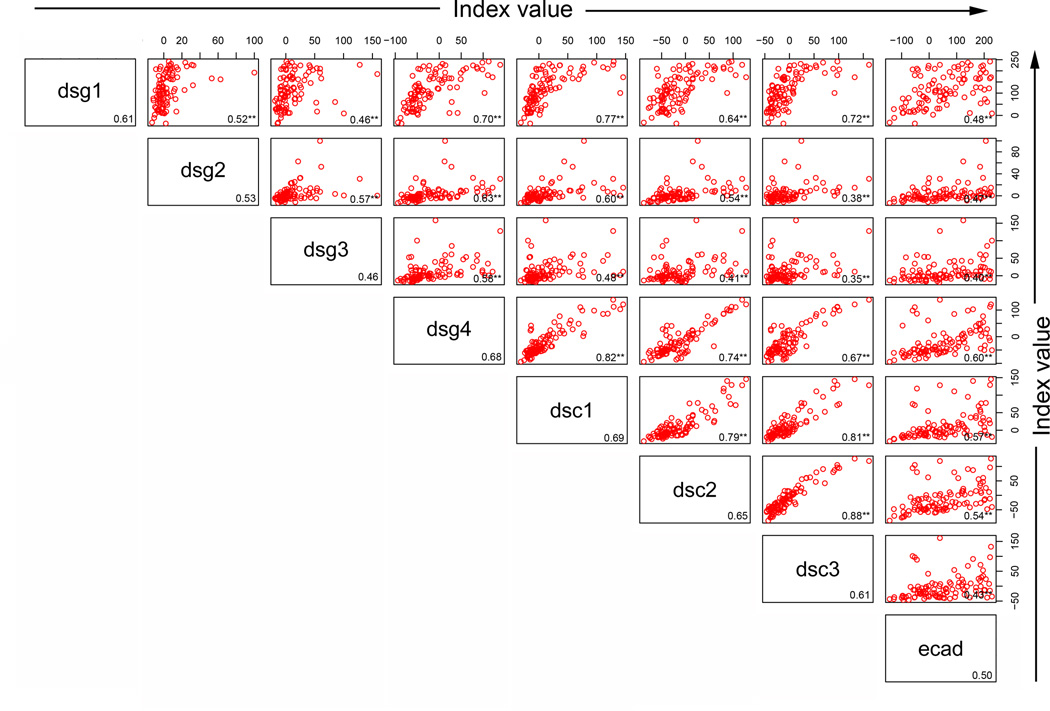
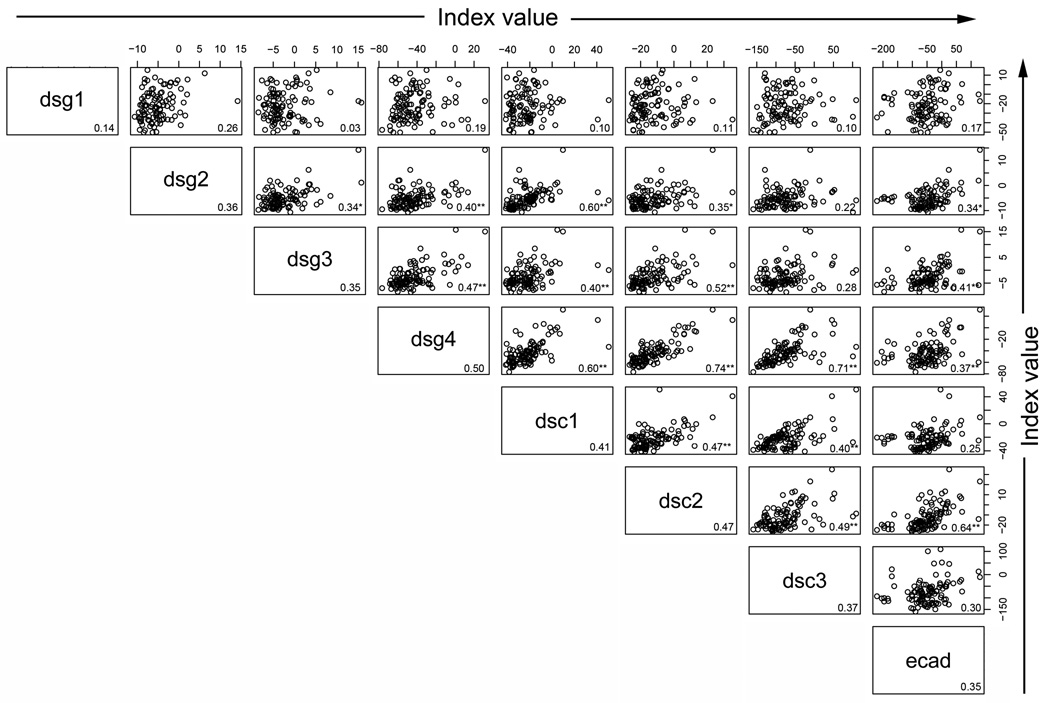
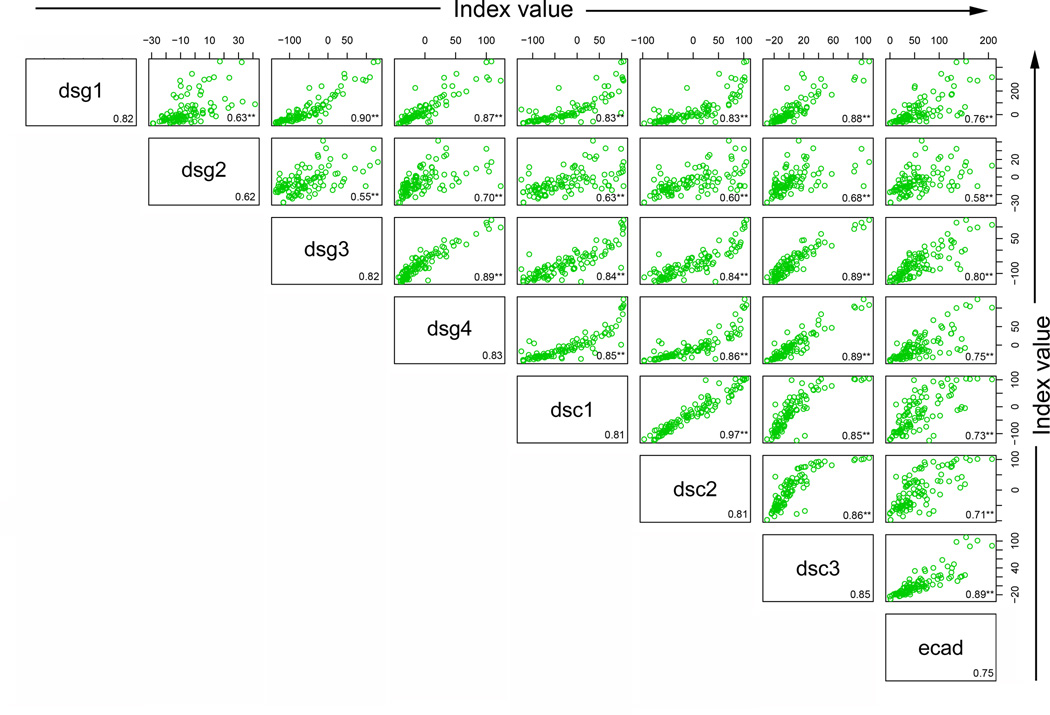
We next explored correlations among the responses to the 8 antigens within each group or population to determine whether a higher index value to Dsg1 would be predictive of a higher index value to any of the other antigens within a particular group. High correlations among the responses might suggest that the same pool of antibodies is responding to both antigens (crossreactivity) or that a common stimulus is inducing both responses to the same magnitude. To determine whether there was correlation among the index values of the 8 antigen/antibody systems within each population, scatter plots were created by plotting index values for one antigen against index values for each of the remaining antigens. Spearman correlations were then computed (r value shown in the right lower quadrant of each panel). As shown in Figure 4a, Dsg1 index values in FS patients are highly correlated with the Dsc1 (r=0.77), Dsc3 (r=0.72) and Dsg4 (r=0.70) values. Thus, an FS patient with a high index value to Dsg1 tends to have a high index value to Dsc1, Dsc3, and Dsg4 as well. There are 28 pairwise correlations in each population of individuals. As a summary of these 28 correlations, the average correlation and range were determined for each population of individuals. On average, the correlation among responses to the 8 antigens in the FS patients is 0.59 (range 0.40 – 0.88)(Figure 4a), but is lower in the US controls with an average of 0.37 (range 0.03 – 0.74)(Figure 4b). In contrast, the correlations among responses to the 8 antigens in the endemic controls are strikingly high with an average correlation of 0.79 (range 0.55–0.97)(Figure 4c).
Figure 4.
Correlation among the antibody responses. (a) FS patients, (b) US controls, and (c) endemic controls antibody response correlations are depicted by index value scatter plots for each antigen/antibody system against the others. The Spearman correlation coefficient (r value) for each scatter plot is listed in the bottom right corner of each plot. Average r values for each antigen/antibody system against the remaining 7 antigen/antibody systems are listed in the bottom right corner for each antigen. **=p<0.01, *= p<0.05, adjusting for multiple comparisons involving 84 p-values.
Discussion
This investigation was undertaken to assess the spectrum of autoantibody responses to keratinocyte cadherins in the serum of FS patients and control individuals from the US and from a highly endemic area of FS in Brazil. The three unique groups tested include: (1) FS patients who are already showing the pathogenic autoantibody response, perhaps secondary to sensitization to an environmental antigen(s); (2) normal immunologically naïve individuals from a nonendemic area, (i.e. US group); and (3) individuals living in a Brazilian endemic region of FS, which may harbor the putative sensitizing antigen(s). This latter group may show autoantibody responses against keratinocyte cadherins that represent a transition between the previous two groups. A large number of FS and control sera were tested against the ectodomain of 7 desmosomal cadherins and E-cadherin by ELISA. The results show a consistent and specific autoantibody response against these cadherins in FS patients and endemic controls. Moreover, the autoantibody responses to some of these cadherin antigens are correlated.
Three observations can be drawn from this investigation:
a) The autoantibody response to the 8 antigens in FS patients, US controls, and endemic controls are unique and, in the majority of cases, significantly different in each of the three groups by 24 pairwise comparison of the 8 antigen/antibody systems. As expected, the index values of anti-Dsg1 autoantibodies from FS patients are significantly higher (p<0.0001) from US controls, producing an AUC of 0.98, CI (0.98–1.00). These findings confirm that the ELISA assay for anti-Dsg1 autoantibodies as reported by our group (Warren et al., 2000) and others (Amagai et al., 1999) is reliable, sensitive and specific, when used to distinguish FS patients and US controls.
Comparing the index values of the FS patients and the endemic controls we find that all index values are significantly different, with the exception of Dsc2 (p=0.4033) and E-cadherin (p=0.2524). The lack of significant difference between the index values for Dsc2 and E-cadherin in FS patients and endemic controls reflects extensive overlap in the distributions of index values in the two groups.
Comparison of index values between US controls and endemic controls reveals statistically significant differences for 4 antigen/antibody systems, Dsg3 (p<0.0001), Dsg4 (p<0.0001), Dsc3 (p<0.0001) and E-cadherin (p<0.0001). No significant differences are found for Dsg1 (p=0.0162), Dsg2 (p=0.0150), Dsc1 (p=0.1119) and Dsc2 (p=0.820). A reasonable explanation for these differences (or lack of differences) remains unknown; however, an unsubstantiated speculation would be that the earliest response in donors from endemic areas may be mediated by autoantibodies against the first group of antigens (Dsg3, Dsg4, Dsc3 and E-cadherin).
b) As shown in Figure 2, ROCs of each antigen/antibody system provides a tool to evaluate the ability of each ELISA to separate known positive (FS patients) from known negative (US controls) individuals across a range of cutpoints. An AUC of 0.50 indicates that the test is no better than chance at detecting a positive case, whereas values closer to 1.0 indicate an optimal test. The AUCs of Dsg1 (0.98, CI: 0.98–1.00), Dsc1 (0.88, CI:0.84–0.930) and Dsc3 (0.90, CI:0.85–0.95) show that these ELISAs are the best separators of FS patients from US controls. From our data, it is evident that aside from the Dsg1 ELISA, none of the remaining 7 antigen/antibody ELISA systems would useful as a diagnostic test for FS given their relatively low sensitivity.
ELISA cutpoints were chosen by setting a specificity of 95% to minimize false positives. Using these cutoffs (Figure 3), some FS patients have positive tests to Dsg1 (97%), Dsg2 (42%), Dsg3 (41%), Dsc1 (43%), E-cadherin (50%), Dsg4 (29%), Dsc2 (24%) and Dsc3 (16%). US controls show the 5% false positive rate determined by the selected specificity. Interestingly, endemic controls show a sizable number of positive individuals in some of the antigen/antibody systems, i.e. E-cadherin (56%), Dsg1 (42%), Dsc2 (41%), Dsg4 (32%), Dsc1 and (31%). These findings suggest the relevance of the environment surrounding the FS patients and the endemic controls as a source of sensitizing antigen(s) that lead to the production of these autoantibodies.
c) Finally, the Spearman correlations between antigen/antibody systems of the three groups show interesting results. First, there is low correlation between anti-Dsg1 autoantibodies and any of the seven remaining antigen/antibody systems in US controls. In contrast, anti-Dsg1 autoantibodies show strong correlation with Dsc1 and Dsc3 antibodies in FS patients. FS patients exhibit a weaker correlation between anti-Dsg1 autoantibodies and Dsg4, Dsc2 and E-cadherin. Endemic controls show striking correlations between anti-Dsg1 autoantibodies with autoantibodies to Dsg3, Dsg4, Dsc1, Dsc2, Dsc3 and E-cadherin.
The strong correlations seen in endemic controls and FS patients suggest exposure of these individuals to a common environmental antigen(s). The antigen(s) may not be available in environments where US controls live. We acknowledge that it is difficult to distinguish between environmental and genetic influences on the autoantibody responses found in FS patients and endemic controls. Our current studies need further confirmation by establishing the autoantibody response of another control group composed of normal non-endemic Brazilian individuals of the same genetic stock as those of the LV endemic controls included in the current study. Should this new group generate results that do not overlap those of the endemic controls then the environmental etiology of FS would be strengthened.
There may be several explanations for these findings:
That the putative environmental antigen(s) may share cross-reactive epitopes with all the keratinocyte cadherins, thus triggering independent populations of autoantibodies with specificities to each of the 8 antigens;
That one or all of the environmentally-elicited anti-keratinocyte cadherin autoantibodies recognize crossreactive epitopes on the 8 antigens tested due to structural homologies among these keratinocyte cadherins;
Finally, it is feasible that once an initial autoantibody response is triggered against one of these cadherins (primary response), this response may be followed by autoantibody responses against other keratinocyte cadherins by the epitope spreading mechanism. However, as these results represent a single time point observation, determination of the progression of these responses over time (as seen in epitope spreading) is not possible with this data set.
Since FS is a rare occurrence, it is likely that other factors such as the HLA may facilitate the development of this disease. It is intriguing that anti- E-cadherin autoantibodies are detected in a large number of individuals from the healthy endemic control (58%) and FS group (42%) raising the hypothesis that this primitive molecule may be the initial cross-reactive antigen. Much work is needed to test these appealing speculations.
Materials and Methods
Sources of sera
A total of 313 sera from adult donors were tested for IgG autoantibodies against 7 desmosomal cadherins and E-cadherin (101 sera were obtained from FS patients, 106 from healthy controls from the US, and 106 from healthy controls living in the Limao Verde endemic area of Brazil). FS sera were collected from patients originating from endemic regions, but hospitalized at the time of blood draw in three Brazilian hospitals dedicated to treat these patients: Hospital das Clinicas, Sao Paulo, (n= 25); Hospital de Doenças Tropicaes, Goiania, (n= 31), and Hospital Adventista do Penfigo, Campo Grande (n= 45). The disease was confirmed by clinical, histologic and immunofluorecent findings. The patients were in different clinical stages evolution and undergoing systemic steroid therapy. The indirect immunofluorescence studies showed anti-epidermal ICS autoantibodies in titers above 1:80 in ninety four patients, 1:40 in five, 1:20 in one case and negative in 1 case. Healthy control sera (defined as complete absence of cutaneous disease) were obtained from blood bank donors from the University of North Carolina Blood Bank and healthy individuals from Limao Verde, Brazil.
The study was approved by the University of North Carolina Institutional Review Board and conducted according to the Declaration of Helsinki Principles. Participants gave their written informed consent.
Construction and production of recombinant Dsg1, Dsg3 and E-cadherin antigens
We have previously constructed and expressed the entire extracellular domains of human Dsg1, Dsg3 and E-Cadherin using the baculovirus system (Diaz et al., 2008; Ding et al., 1997; Ding et al., 1999). Soluble ectodomains of Dsg1, Dsg3 and E-cadherin were produced in High Five™ insect cells by infection with high titer recombinant baculovirus stocks. Optimal infection conditions for each recombinant protein were determined by time course studies (Liebman et al., 1999). The average protein yield was 10 ug/ml of culture supernatant.
Subcloning of Dsg2 ectodomain into a baculovirus expression vector
cDNA encoding the entire human Dsg2 was provided by Dr. M. Mahoney, Jefferson Medical School and used to construct the human Dsg2 ectodomain. The DNA of Dsg2 ectodomain was amplified by PCR using primer pair of 5’-ATCGGGCGCGGATCCATGGCGCGGAGCCCGGG-3’ and 5’-ATTCGAAAGCGGCCGCCTAGTGATGGTGATGATGGTGCAGGCCCACATAGGAGTCAT-3’ and was inserted into pFastBacI (Gibco Life Technologies, Gaithersburg, MD, USA) at BamHI and NotI sites. The coding region of the construct begins with the endogenous initial Met followed by a putative signal sequence as well as an in-frame His-tag at the C-terminal in order to ensure the secretion and to facilitate the purification and detection of the expressed antigen. The resulting plasmid, pFastBacI-Dsg2 ectodomain was used to construct into Bac-to-Bac system (Invitrogen, Carlsbad, CA, USA) following manufacturer’s protocol. Virus stock was prepared by infecting sf9 insect cell in Grace’s insect cell medium (Invitrogen, Carlsbad, CA, USA) containing 10% fetal bovine serum at 27°C. Viral titers were determined by end point dilution assay in sf9.
Expression of Dsc1, Dsc2, and Dsc3 and Dsg4 recombinant antigens
The entire cDNA of the ectodomain of Dsc1, Dsc2, and Dsc3 constructed in the pEVmod were provided by Dr. Takashi Hashimoto, Dermatology, Kurume University, Japan. These cDNAs were subcloned into the BD BaculoGold virus vector (BD Biosciences, San Diego, CA, USA).
The Dsg4 extracellular domain already subcloned into baculovirus vector was kindly provided by Dr. Masayuki Amagai, Department of Dermatology, Keio University School of Medicine, Tokyo, Japan.
Production and purification of recombinant E-cadherin and desmosomal cadherins
His-tagged recombinant forms of Dsg1–4, Dsc1–3 and E-cadherin ectodomains were generated in the baculovirus expression system and purified by nickel affinity chromatography using the procedure previously described (Ding et al., 1997).
Enzyme-linked immunosorbent assay (ELISA)
Immunomicrotiter plates (Costar, Cambridge, MA, USA) were coated with one of the 8 purified desmosomal cadherins (200 ng/well for Dsc1, Dsg1, Dsg3 and E-cadherin, 100ng/well for Dsg2 and Dsc2 and 50ng/well for Dsg4 and Dsc3) at 4°C overnight. After washing 5 times with Tris-buffered saline containing 5 mM Ca++ and 0.05% Tween-20 (TBS/Ca++/T-20), the plate was blocked with 1% BSA in TBS/Ca++/T-20 at room temperature for 1 hour. The plate was then washed 5 times and incubated with duplicate samples of diluted serum for 1 hour at room temperature. Following washes, the plate was incubated with diluted horseradish-peroxidase (HRP)-conjugated goat anti-human IgG (Bio-Rad, Hercules, CA, USA) for 1 hour (1:1000 for 7 desmosomal antigens and 1:1500 for E-cadherin). The color development was achieved with the peroxidase substrate o-phenylenediamine.
A FS serum (1:100 dilution) which produced consistent and reproducible positive OD values for IgG anti-Dsg1 autoantibodies was selected as a positive control. We also selected a positive serum (1:100 dilution) for Dsg2 (CG14), Dsg3 (Dip), Dsg4 (CG42a), Dsc1, Dsc2 and Dsc3 (CG42a) and E-cadherin (1:200 dilution). A normal human serum from US was used as a negative control throughout. Results were expressed as index value units as reported by (Amagai et al., 1999) and (Diaz et al., 2008). The index value was defined in terms of OD as follows:
Negative index values occur when the test sample OD is less than the negative control OD.
As a reference, we provide the average ODs of duplicate tests of negative and positive control sera used to generate index values: Dsg1 (negative 0.81, positive 1.60), Dsg2 (negative 0.48, positive 1.92, Dsg3 (negative 1.39, positive 2.55), Dsg4 (negative 0.78, positive 2.45), Dsc1 (1.76, positive 3.16), Dsc2 (negative 1.65, positive 3.25), Dsc3 (negative 0.68, positive 2.70), and E-cadherin (negative 0.17, positive 1.36).
Statistical analysis
Nonparametric methods (DeLong et al., 1988) were used estimation and testing of receiver operator characteristic (ROC) curves (Hanley and McNeil, 1982) and area under the curve (AUC). Spearman correlation was used to assess strength of correlation among the various measures. The R software (Team, 2011), version 2.13.0, was used to generate the graphs. The data analysis was done using SAS software. Copyright, SAS Institute Inc. SAS and all other SAS Institute Inc. product or service names are registered trademarks or trademarks of SAS Institute Inc., Cary, NC, USA.
The Wilcoxon rank sum test (Hollander and Wolfe, 1999) is a statistical hypothesis test of equality of two distributions (the distributions in the two groups). Briefly, the test is performed by pooling the two samples into one sample of n observations, ranking the values from smallest (rank=1) to largest (rank=n), computing the mean rank in each group, then comparing the mean ranks in a formal statistical fashion. It is somewhat similar in spirit to the 2-sample t-test, but it only takes the ordering of the observations into account, not their actual magnitude. Assumption of normal distributions is not required.
Adjustment for multiple comparisons controls the overall type-I error when a large number of hypothesis tests is made. For example, when 20 hypothesis tests are performed at the 0.05 level each, and all 20 null hypotheses are in fact true, on average one test turns out statistically significant (p < 0.05), and the probability of one or more significant tests is larger than 0.05, and can be much larger. In fact, if the 20 tests are independent, there is a 64% chance of at least one test showing a significant result when all 20 null hypotheses are true. Controlling the overall Type I error guarantees that the probability of one or more significant findings (p < 0.05), when all 20 null hypotheses are in fact true, is 0.05 or less. The Bonferroni method achieves that control by performing each test at the 0.05/20=0.0025 level, i.e the overall Type-I error is divided by the number of tests. The method does not require the tests to be independent (Farcomeni, 2008).
Acknowledgements
This work was supported by NIH grants R01-AR30281, R01-AR32599, and T32-AR07369 (L.A.D.).
Abbreviations
- Dsg1
desmoglein 1
- Dsg3
desmoglein 3
- FS
Fogo Selvagem
- PF
pemphigus foliaceus
- PV
pemphigus vulgaris
- rDsg1
recombinant Dsg1
- ROC
receiver operating characteristic
Footnotes
Conflict of Interest
The authors state no conflict of interest.
References
- Amagai M, Klaus-Kovtun V, Stanley JR. Autoantibodies against a novel epithelial cadherin in pemphigus vulgaris, a disease of cell adhesion. Cell. 1991;67:869–877. doi: 10.1016/0092-8674(91)90360-b. [DOI] [PubMed] [Google Scholar]
- Amagai M, Komai A, Hashimoto T, Shirakata Y, Hashimoto K, Yamada T, et al. Usefulness of enzyme-linked immunosorbent assay using recombinant desmogleins 1 and 3 for serodiagnosis of pemphigus. Br J Dermatol. 1999;140:351–357. doi: 10.1046/j.1365-2133.1999.02752.x. [DOI] [PubMed] [Google Scholar]
- Beutner EH, Jordon RE. Demonstration of Skin Antibodies in Sera of Pemphigus Vulgaris Patients by Indirect Immunofluorescent Staining. Proc Soc Exp Biol Med. 1964;117:505–510. doi: 10.3181/00379727-117-29622. [DOI] [PubMed] [Google Scholar]
- Beutner EH, Prigenzi LS, Hale W, Leme Cde A, Bier OG. Immunofluorescent studies of autoantibodies to intercellular areas of epithelia in Brazilian pemphigus foliaceus. Proc Soc Exp Biol Med. 1968;127:81–86. doi: 10.3181/00379727-127-32626. [DOI] [PubMed] [Google Scholar]
- Buxton RS, Cowin P, Franke WW, Garrod DR, Green KJ, King IA, et al. Nomenclature of the desmosomal cadherins. J Cell Biol. 1993;121:481–483. doi: 10.1083/jcb.121.3.481. [DOI] [PMC free article] [PubMed] [Google Scholar]
- DeLong ER, DeLong DM, Clarke-Pearson DL. Comparing the areas under two or more correlated receiver operating characteristic curves: a nonparametric approach. Biometrics. 1988;44:837–845. [PubMed] [Google Scholar]
- Desai BV, Harmon RM, Green KJ. Desmosomes at a glance. J Cell Sci. 2009;122:4401–4407. doi: 10.1242/jcs.037457. [DOI] [PMC free article] [PubMed] [Google Scholar]
- Diaz LA, Prisayanh PS, Dasher DA, Li N, Evangelista F, Aoki V, et al. The IgM anti-desmoglein 1 response distinguishes Brazilian pemphigus foliaceus (fogo selvagem) from other forms of pemphigus. J Invest Dermatol. 2008;128:667–675. doi: 10.1038/sj.jid.5701121. [DOI] [PubMed] [Google Scholar]
- Diaz LA, Sampaio SA, Rivitti EA, Martins CR, Cunha PR, Lombardi C, et al. Endemic pemphigus foliaceus (fogo selvagem). I. Clinical features and immunopathology. J Am Acad Dermatol. 1989a;20:657–669. doi: 10.1016/s0190-9622(89)70079-7. [DOI] [PubMed] [Google Scholar]
- Diaz LA, Sampaio SA, Rivitti EA, Martins CR, Cunha PR, Lombardi C, et al. Endemic pemphigus foliaceus (Fogo Selvagem): II. Current and historic epidemiologic studies. J Invest Dermatol. 1989b;92:4–12. doi: 10.1111/1523-1747.ep13070394. [DOI] [PubMed] [Google Scholar]
- Ding X, Aoki V, Mascaro JM, Jr, Lopez-Swiderski A, Diaz LA, Fairley JA. Mucosal and mucocutaneous (generalized) pemphigus vulgaris show distinct autoantibody profiles. J Invest Dermatol. 1997;109:592–596. doi: 10.1111/1523-1747.ep12337524. [DOI] [PubMed] [Google Scholar]
- Ding X, Diaz LA, Fairley JA, Giudice GJ, Liu Z. The anti-desmoglein 1 autoantibodies in pemphigus vulgaris sera are pathogenic. J Invest Dermatol. 1999;112:739–743. doi: 10.1046/j.1523-1747.1999.00585.x. [DOI] [PubMed] [Google Scholar]
- Duker I, Schaller J, Rose C, Zillikens D, Hashimoto T, Kunze J. Subcorneal pustular dermatosis-type IgA pemphigus with autoantibodies to desmocollins 1, 2, and 3. Arch Dermatol. 2009;145:1159–1162. doi: 10.1001/archdermatol.2009.224. [DOI] [PubMed] [Google Scholar]
- Evangelista F, Dasher DA, Diaz LA, Prisayanh PS, Li N. E-cadherin is an additional immunological target for pemphigus autoantibodies. J Invest Dermatol. 2008;128:1710–1718. doi: 10.1038/sj.jid.5701260. [DOI] [PMC free article] [PubMed] [Google Scholar]
- Farcomeni A. A review of modern multiple hypothesis testing, with particular attention to the false discovery proportion. Stat Methods Med Res. 2008;17:347–388. doi: 10.1177/0962280206079046. [DOI] [PubMed] [Google Scholar]
- Flores G, Qian Y, Diaz LA. The enigmatic autoimmune response in endemic pemphigus foliaceus. Actas Dermosifiliogr. 2009;100(Suppl 2):40–48. doi: 10.1016/s0001-7310(09)73377-0. [DOI] [PMC free article] [PubMed] [Google Scholar]
- Green KJ, Getsios S, Troyanovsky S, Godsel LM. Intercellular junction assembly, dynamics, and homeostasis. Cold Spring Harb Perspect Biol. 2010;2:a000125. doi: 10.1101/cshperspect.a000125. [DOI] [PMC free article] [PubMed] [Google Scholar]
- Hanley JA, McNeil BJ. The meaning and use of the area under a receiver operating characteristic (ROC) curve. Radiology. 1982;143:29–36. doi: 10.1148/radiology.143.1.7063747. [DOI] [PubMed] [Google Scholar]
- Hollander, Wolfe . Nonparametric Statistical Methods. 2nd edn. Wiley & Sons; 1999. [Google Scholar]
- Liebman JM, LaSala D, Wang W, Steed PM. When less is more: enhanced baculovirus production of recombinant proteins at very low multiplicities of infection. Biotechniques. 1999;26:36–38. doi: 10.2144/99261bm05. 40, 2. [DOI] [PubMed] [Google Scholar]
- Mao X, Nagler AR, Farber SA, Choi EJ, Jackson LH, Leiferman KM, et al. Autoimmunity to desmocollin 3 in pemphigus vulgaris. Am J Pathol. 2010;177:2724–2730. doi: 10.2353/ajpath.2010.100483. [DOI] [PMC free article] [PubMed] [Google Scholar]
- Moraes ME, Fernandez-Vina M, Lazaro A, Diaz LA, Filho GH, Friedman H, et al. An epitope in the third hypervariable region of the DRB1 gene is involved in the susceptibility to endemic pemphigus foliaceus (fogo selvagem) in three different Brazilian populations. Tissue Antigens. 1997;49:35–40. doi: 10.1111/j.1399-0039.1997.tb02707.x. [DOI] [PubMed] [Google Scholar]
- Nagasaka T, Nishifuji K, Ota T, Whittock NV, Amagai M. Defining the pathogenic involvement of desmoglein 4 in pemphigus and staphylococcal scalded skin syndrome. J Clin Invest. 2004;114:1484–1492. doi: 10.1172/JCI20480. [DOI] [PMC free article] [PubMed] [Google Scholar]
- Qaqish BF, Prisayanh P, Qian Y, Andraca E, Li N, Aoki V, et al. Development of an IgG4-based predictor of endemic pemphigus foliaceus (fogo selvagem) J Invest Dermatol. 2009;129:110–118. doi: 10.1038/jid.2008.189. [DOI] [PMC free article] [PubMed] [Google Scholar]
- Qian Y, Prisayanh P, Andraca E, Qaqish BF, Aoki V, Hans-Filhio G, et al. IgE, IgM, and IgG4 anti-desmoglein 1 autoantibody profile in endemic pemphigus foliaceus (fogo selvagem) J Invest Dermatol. 2011;131:985–987. doi: 10.1038/jid.2010.403. [DOI] [PMC free article] [PubMed] [Google Scholar]
- Rock B, Martins CR, Theofilopoulos AN, Balderas RS, Anhalt GJ, Labib RS, et al. The pathogenic effect of IgG4 autoantibodies in endemic pemphigus foliaceus (fogo selvagem) N Engl J Med. 1989;320:1463–1469. doi: 10.1056/NEJM198906013202206. [DOI] [PubMed] [Google Scholar]
- Roscoe JT, Diaz L, Sampaio SA, Castro RM, Labib RS, Takahashi Y, et al. Brazilian pemphigus foliaceus autoantibodies are pathogenic to BALB/c mice by passive transfer. J Invest Dermatol. 1985;85:538–541. doi: 10.1111/1523-1747.ep12277362. [DOI] [PubMed] [Google Scholar]
- Stanley JR, Klaus-Kovtun V, Sampaio SA. Antigenic specificity of fogo selvagem autoantibodies is similar to North American pemphigus foliaceus and distinct from pemphigus vulgaris autoantibodies. J Invest Dermatol. 1986a;87:197–201. doi: 10.1111/1523-1747.ep12695334. [DOI] [PubMed] [Google Scholar]
- Stanley JR, Koulu L, Klaus-Kovtun V, Steinberg MS. A monoclonal antibody to the desmosomal glycoprotein desmoglein I binds the same polypeptide as human autoantibodies in pemphigus foliaceus. J Immunol. 1986b;136:1227–1230. [PubMed] [Google Scholar]
- Team RDC. R: A Language and Environment for Statistical Computing. R Foundation for Statistical Computing. 2011 [Google Scholar]
- Thomason HA, Scothern A, McHarg S, Garrod DR. Desmosomes: adhesive strength and signalling in health and disease. Biochem J. 2010;429:419–433. doi: 10.1042/BJ20100567. [DOI] [PubMed] [Google Scholar]
- Warren SJ, Arteaga LA, Rivitti EA, Aoki V, Hans-Filho G, Qaqish BF, et al. The role of subclass switching in the pathogenesis of endemic pemphigus foliaceus. J Invest Dermatol. 2003;120:104–108. doi: 10.1046/j.1523-1747.2003.12017.x. [DOI] [PubMed] [Google Scholar]
- Warren SJ, Lin MS, Giudice GJ, Hoffmann RG, Hans-Filho G, Aoki V, et al. The prevalence of antibodies against desmoglein 1 in endemic pemphigus foliaceus in Brazil. Cooperative Group on Fogo Selvagem Research. N Engl J Med. 2000;343:23–30. doi: 10.1056/NEJM200007063430104. [DOI] [PubMed] [Google Scholar]


