Abstract
Purpose
Carcinoembryonic antigen (CEA) is an important prognostic marker in colorectal cancer (CRC). However, in some stages, it does not work. We performed this study to find a way in which preoperative CEA could be used as a constant prognostic marker in harmony with the TNM staging system.
Methods
Preoperative CEA levels and recurrences in CRC were surveyed. The distribution of CEA levels and the recurrences in each TNM stage of CRC were analyzed. An optimal cutoff value for each TNM stage was calculated and tested for validity as a prognostic marker within the TNM staging system.
Results
The conventional cutoff value of CEA (5 ng/mL) was an independent prognostic factor on the whole. However, when evaluated in subgroups, it was not a prognostic factor in stage I or stage III of N2. A subgroup analysis according to TNM stage revealed different CEA distributions and recurrence rates corresponding to different CEA ranges. The mean CEA levels were higher in advanced stages. In addition, the recurrence rates of corresponding CEA ranges were higher in advanced stages. Optimal cutoff values from the receiver operating characteristic curves were 7.4, 5.5, and 4.5 ng/mL for TNM stage I, II, and III, respectively. Those for N0, N1, and N2 stages were 5.5, 4.8, and 3.5 ng/mL, respectively. The 5-year disease-free survivals were significantly different according to these cutoff values for each TNM and N stage. The multivariate analysis confirmed the new cutoff values to be more efficient in discriminating the prognosis in the subgroups of the TNM stages.
Conclusion
Individualized cutoff values of the preoperative CEA level are a more practical prognostic marker following and in harmony with the TNM staging system.
Keywords: Carcinoembryonic antigen, Colorectal neoplasms, Prognosis, TNM Staging, Cutoff value
INTRODUCTION
Carcinoembryonic antigen (CEA) is an oncofetal antigen discovered in 1968 by Gold and Freedman [1]. It is produced by normal fetal gut tissue and by epithelial tumors, especially those of the large bowel. Since its initial detection in serum, CEA has been one of the most useful tumor markers in colorectal cancer (CRC) [2].
Previous reports have examined the association between preoperative CEA levels and disease outcome. Patients with high preoperative CEA levels have been demonstrated to have more recurrences than those with low levels [3-7]. Several studies have also contended that the preoperative CEA level is an independent prognostic factor [6, 8-10]. However, some controversies have existed concerning the significance of the preoperative CEA level as a predictive factor of recurrence. A recent study found CEA levels greater than 5 ng/mL not to be independently associated with recurrence, recurrence-free survival or overall survival [11]. Some studies have shown the preoperative CEA level to be an independent predictor for disease-free survival (DFS) in patients with only TNM stage III tumors [7, 12-14]. Another study reported the differences between DFSs based on preoperative CEA ranges of <5 and ≥5 ng/mL to be significant for patients with TNM stage II tumors, but not for patients with TNM stage III tumors [8].
These conflicting results are due to the use of a single cutoff value for the CEA (usually 5 ng/mL), even though different CEA distributions are seen in different TNM stages. Moreover, even though in a large-sclae study, Thirunavukarasu et al. [15] suggested that the preoperative CEA should be included in the TNM staging system, as a C-stage, the 'elevated CEA' could not differentiate between survivals in some TNM stages, which is not in harmony with the TNM staging system. Until recently, few reports have considered optimal cutoff values of the CEA level, other than 5 ng/mL, as a predictive factor of recurrence, and no study has adopted practical cutoff values based on the TNM stages. Therefore, this study was carried out to find a way in which the preoperative serum CEA (s-CEA) level could be used as a constant prognostic marker irrespective of the TNM stages by adopting individual cutoff values so that the CEA level corresponds with the TNM staging system.
METHODS
Between January 2000 and May 2010, 831 patients underwent surgery at SMG-SNU Boramae Medical Center due to a colorectal adenocarcinoma. Patients with a stage IV and in situ carcinoma, as well as those with transanal local excisions, were not included. Thus, 520 patients with stage I, II, and III lesions, who received curative resections, were included in this study.
Clinicopathologic data, including recurrence, were reviewed by using medical records. TNM classifications were defined according to the criteria of the American Joint Commission on Cancer (7th edition, 2010) [16]. Determination of recurrence was made by radiological and clinical examinations followed by histological confirmation. Serum CEA was measured by using immunoradiometric assays.
The CEA was validated as a prognostic marker for all the patients, as well as for the subgroups of patients, by using the conventional cutoff value of 5 ng/mL reported by others. The CEA distribution and corresponding recurrence rate were investigated. Then, the optimal cutoff values of s-CEA in each TNM and N stage were calculated by using a receiver operating characteristic (ROC) analysis, followed by a validation of their use as a prognostic marker. When calculating the mean, the CEA value under a measurable range (<1 ng/mL) was regarded as 0.5 ng/mL.
The Student t-test was used to compare the mean values of the CEA levels of the respective stages, and the chi-square test was used to compare the recurrence rates. DFS rates were calculated using the Kaplan-Meier method, and prognostic factors and survival curves were compared using the log-rank test. A Cox proportional hazards model with forward stepwise variable selection was used for multivariate testing of those factors found to be significant on the univariate analysis. The statistical analyses were performed with IBM SPSS ver. 20.0 (IBM Co., Armonk, NY, USA).
RESULTS
Preoperative s-CEA is an independent prognostic factor, but not always
Of the 520 patients, 118 patients experienced recurrence during a mean 42.3-month follow-up (range, 0 to 150 months). Five out of 73 patients in stage I (6.8%) had recurrence, as did 25 out of 206 patients (12.1%) in stage II and 88 out of 241 patients (36.5%) in stage III. Among these, 27 patients (22.9%) had locoregional recurrence, and 91 (77.1%) had distant metastasis (Table 1). Five-year DFS rates were 92.9, 85.2 and 56.5 percent for stage I, II, and III patients, respectively (P < 0.001).
Table 1.
Patients' characteristics (n = 520)
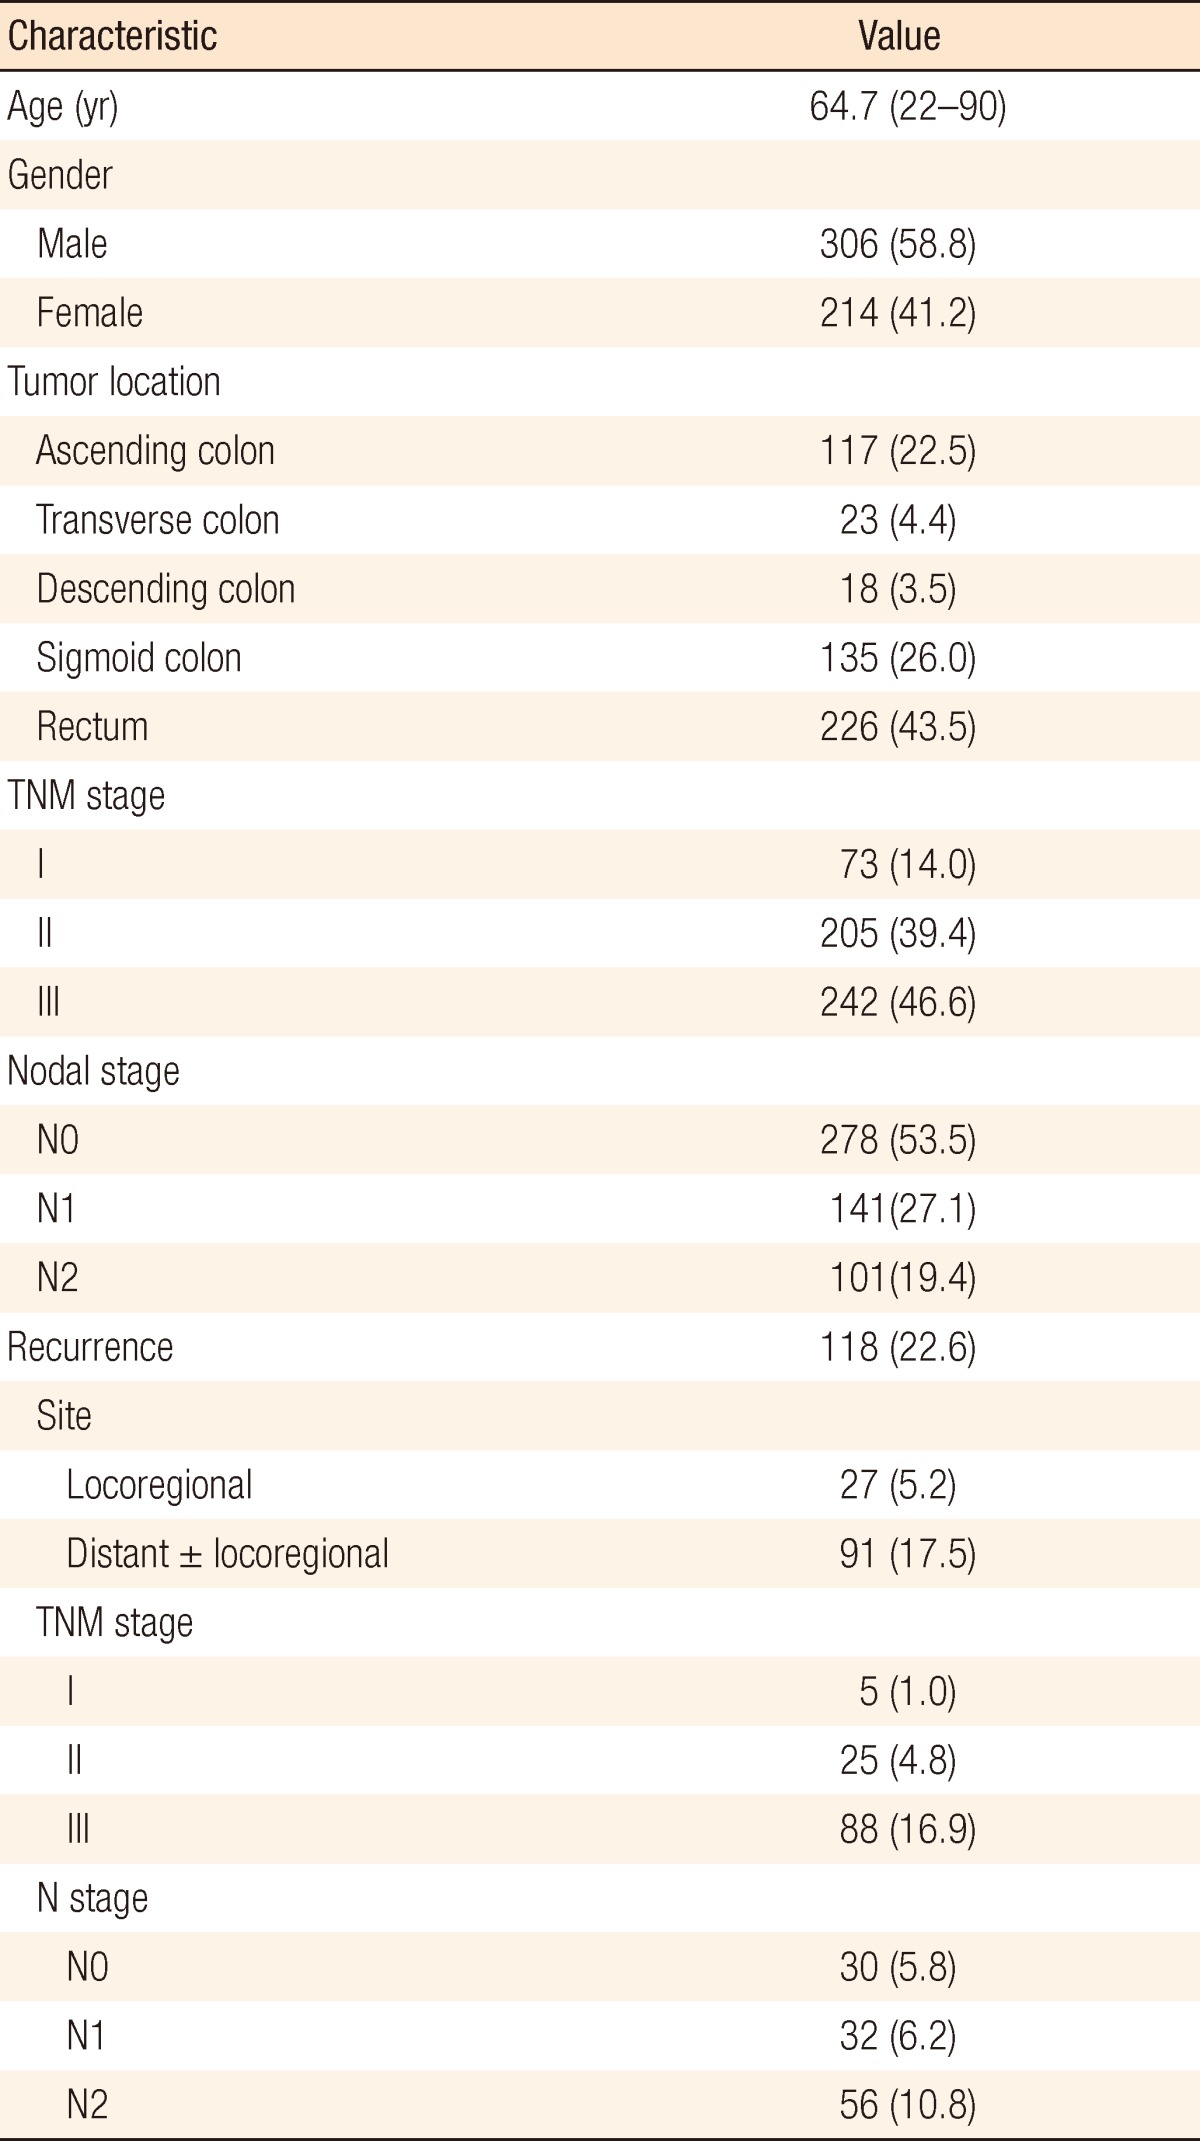
Values are presented as mean (range) or number (%).
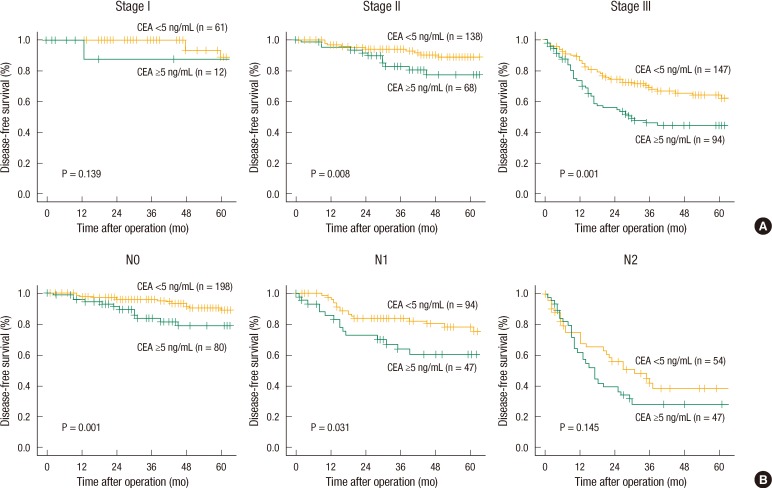
In the univariate analysis, factors associated with poor DFS were lymphatic invasion, vascular invasion, perineural invasion, T category, N category, and preoperative s-CEA level. A multivariate analysis revealed that lymphatic invasion, vascular invasion, N category, and preoperative s-CEA level (using 5 ng/mL as the cutoff) were independent prognostic factors for the 5-year DFS (Table 2). However, when the recurrence rate was analyzed in each TNM and N stage, CEA with a cutoff value of 5 ng/mL was not a significant prognostic factor in TNM stage I and N2, regardless of T stage (Fig. 1).
Table 2.
Univariate and multivariate analyses of factors for 5-year disease-free survival (DFS) in all patients
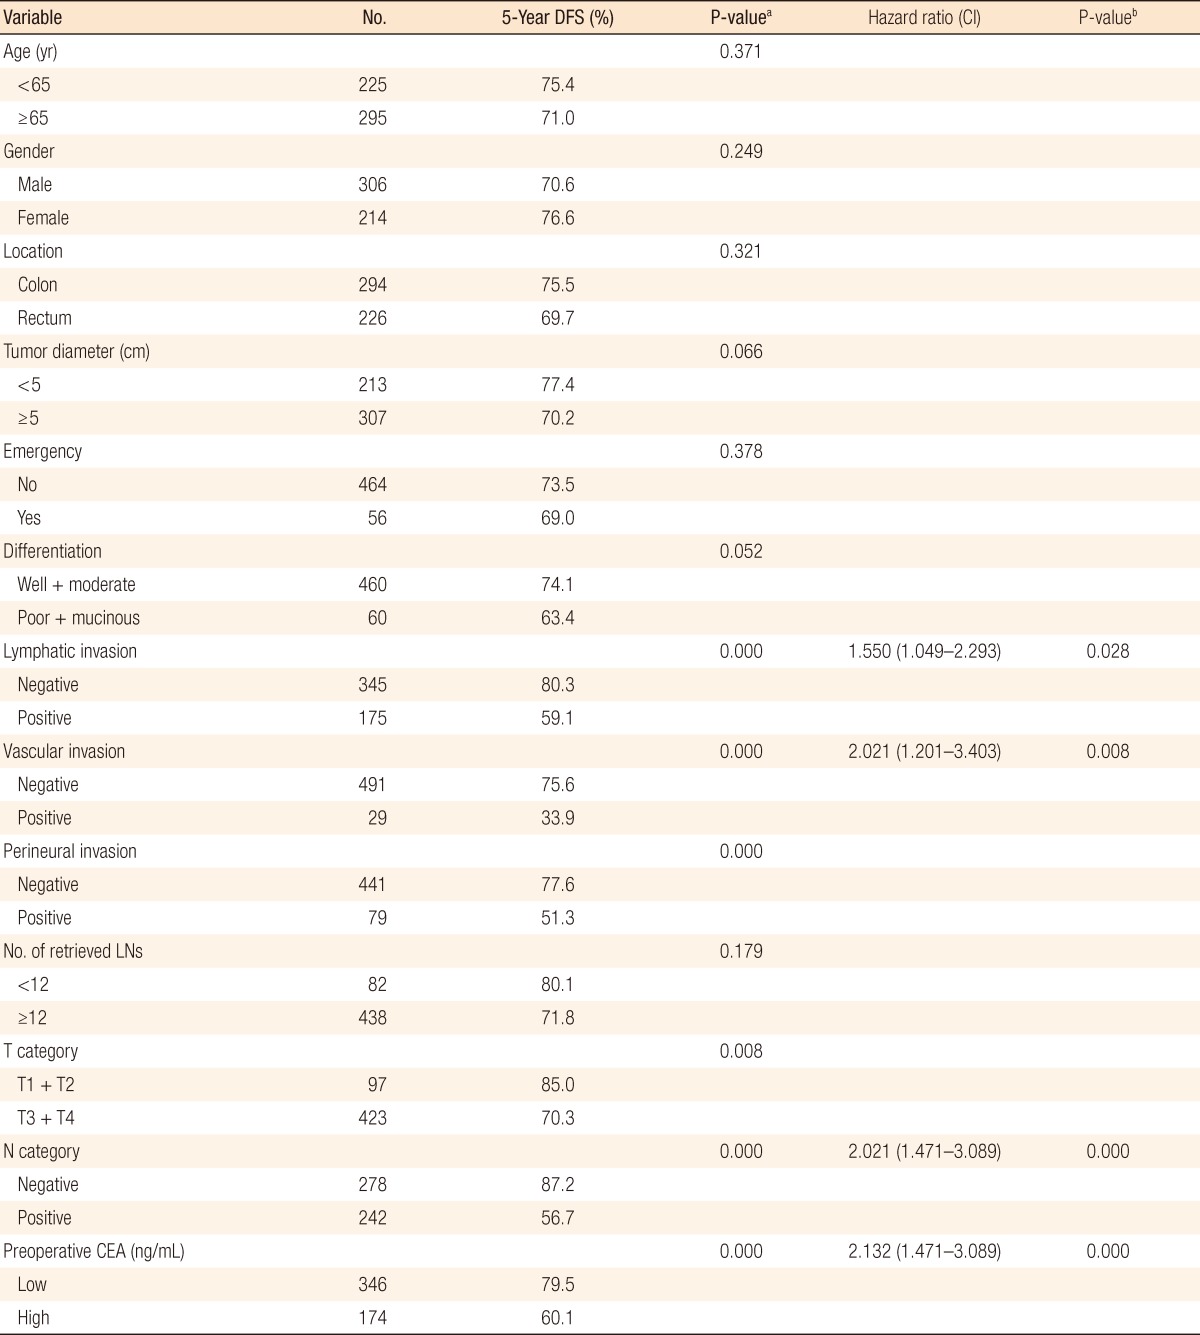
CI, confidence interval; LNs, lymph nodes; CEA, carcinoembryonic antigen.
aUnivariate analysis. bMultivariate analysis.
Fig. 1.
Disease-free survival (DFS) curves for different preoperative serum carcinoembryonic antigen (CEA) concentrations (5 ng/mL). (A) Five-year DFS for each TNM stage. Patients with stage I tumors did not show a significant difference with the preoperative serum CEA (P = 0.139). (B) Five-year DFS for each N stage. Patients with N2 tumors showed no difference with preoperative serum CEA (P = 0.145).
Distributions of CEA vary in stages and recurrence rates within the same CEA range according to stage
The CEA distributions and recurrence rates were investigated to determine the reason the cutoff value of 5 ng/mL does not work as a prognostic marker in some stages. More and more patients have high CEA levels in advanced TNM stages, and this is the same in the N stage. The mean value of the CEA level increases with the progression of the stage, being 3.0, 7.3, and 9.2 ng/mL for stage I, II, and III, respectively, and 6.2, 7.5, and 11.5 ng/mL for N0, N1, and N2 stages. That is, progression of the stage shifts distribution of CEA to the right (Table 3, Fig. 2). Especially, the mean values were significantly different between TNM stage I and II (P = 0.000) and between N stage 1 and 2 (P = 0.031) where the conventional cutoff value of the CEA level turns on or off.
Table 3.
Distribution of the relative frequency of patients (%) according to CEA levels in the respective TNM and N stages

CEA, carcinoembryonic antigen.
aA CEA value under the measurable range (<1 ng/mL) was substituted for 0.5 ng/mL for the calculation. bDifference in mean CEA from adjacent group, Student t-test.
Fig. 2.
Distribution of carcinoembryonic antigen (CEA) according to TNM stage and N stage. (A) Advancement of TNM stage lowers the frequency of patients with CEA levels less than 2.5 ng/mL while it increases the frequency of patients with CEA levels equal to or higher than 10 ng/mL. (B)The range of serum CEA level moves from low to high with the progression of N stage.
The recurrence rate also showed differences according to the stage. The recurrence rate of stage III was 25.8% while that of stage II was 8.3% in patients with CEA ≤1 ng/mL (Table 4). In the same CEA range, patients in advanced stages had higher recurrence rates, and these results were statistically significant.
Table 4.
Recurrence rate (%) of each stage according to the distribution of CEA levels

CEA, carcinoembryonic antigen.
aDifferences from adjacent TNM or N stage groups were significant (P < 0.05, chi-square test). bThis group had only two patients, one of whom experienced recurrence.
Optimal cutoff values of s-CEA decrease with the progression of stages
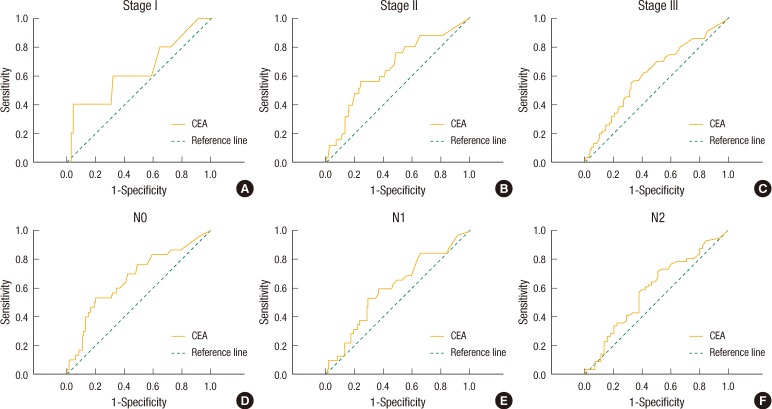
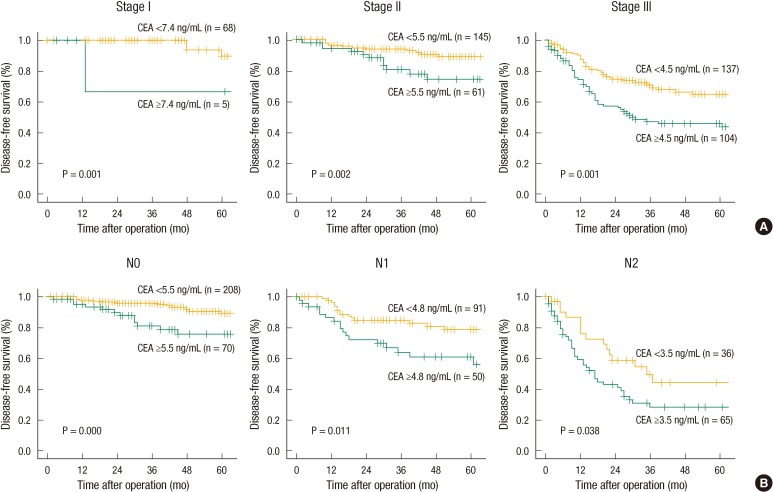
ROC curves of s-CEA according to the TNM stage were made based on the specificities and the sensitivities of recurrence to determine the appropriate cutoff value in each TNM and N stage (Fig. 3). The optimal cutoff value of s-CEA was 7.4 ng/mL in stage I, 5.5 ng/mL in stage II, and 4.5 ng/mL in stage III. The Kaplan-Meier survival curve confirmed a significant difference in DFSs between the groups at CEA levels below and above the optimal the cutoff value in each TNM stage (Fig. 4). In addition, the appropriate cutoff values of s-CEA from the ROC curves were 5.5 ng/mL in N0, 4.8 ng/mL in N1 and 3.5 ng/mL in N2. In each N stage, the five-year DFSs were significantly different between the groups with CEA levels below and above the optimal cutoff values (Fig. 4). That is, the optimal cutoff value decreases with advancing stage due to higher recurrence rates of advanced tumors in the same CEA range.
Fig. 3.
Receiver operating characteristic (ROC) curve of the preoperative serum carcinoembryonic antigen (CEA) level relative to tumor recurrence in each stage. (A) Optimal cutoff CEA value in stage I was 7.4 (area under curve = 0.635, P = 0.315). (B) Optimal cutoff CEA value in stage II was 5.5 (area under curve = 0.660, P = 0.010). (C) Optimal cutoff CEA value in stage III was 4.5 (area under curve = 0.616, P = 0.003). (D) Optimal cutoff CEA value in stage N0 was 5.5 (area under curve = 0.670, P = 0.002). (E) Optimal cutoff CEA value in stage N1 was 4.8 (area under curve = 0.601, P = 0.082). (F) Optimal cutoff CEA value in stage N2 was 3.5 (area under curve = 0.591, P = 0.118).
Fig. 4.
Disease-free survival curves for individualized optimal cutoff carcinoembryonic antigen (CEA) values. (A) Disease-free survival and optimal CEA cutoff value in each TNM stage. (B) Disease-free survival and optimal CEA cutoff value in each N stage.
Individualized cutoff values enhance the power of CEA as a prognostic marker
We compared the differences in the 5-year DFSs obtained by using the optimal cutoff value from the ROC curve with those obtained by using the conventional cutoff value (5 ng/mL) in each TNM stage and nodal stage (Table 5). For stage I and N2, regardless of T stage, the low CEA (<5 ng/mL) group did not have significantly higher 5-year DFS rates than the high CEA (≥5 ng/mL) group (P = 0.139 and P = 0.145, respectively; Fig. 1). However, using 7.4 and 3.5 ng/mL as the cutoffs, the 5-year DFSs differed significantly between the low and the high CEA groups (P = 0.001 and P = 0.038, respectively; Fig. 3). In addition, even in the remaining stages for which the 5-year DFS rates differed significantly from those obtained with the conventional cutoff value (5 ng/mL), the new cutoff value obtained from the ROC curve offered more significant differences in the DFS rates. In the multivariate analysis, including lymphatic invasion and vascular invasion, the hazard ratio of recurrence with the new optimal cutoff value was higher than that of the conventional cutoff value (Table 5).
Table 5.
Disease-free survival (DFS) with different cutoff values according to TNM stage and N stage
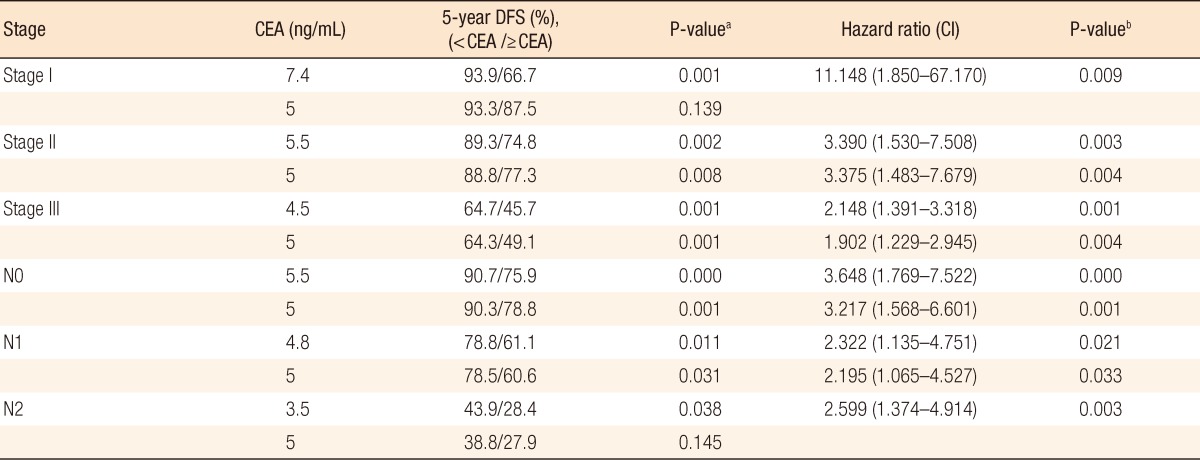
CEA, carcinoembryonic antigen; CI, confidence interval.
aUnivariate analysis. bMultivariate analysis.
DISCUSSION
TNM stage is currently the best prognostic predictor of the outcome in patients with CRC [16]. However, outcomes widely vary within the same stage. Thus, additional prognostic factors complementary to the TNM staging system should be found. Many predictive models have been proposed for better classification of CRC. Several studies have suggested that the preoperative CEA level is an independent prognostic factor [6, 8-10]. The College of American Pathologists Consensus Conference 1999 [17] suggested that the preoperative s-CEA level be used as a category I prognostic marker of CRC. Other than TNM staging, some other category I prognostic markers proposed were lymphatic or vascular invasion, and residual tumor following surgery with curative intent [18]. Using a Cox proportional hazards model, we confirmed that the preoperative CEA level, using 5 ng/mL as the cutoff, was an independent predictive factor for the 5-year DFS in all the patients.
However, controversy exists about the significance of the preoperative CEA level as a predictive factor of recurrence. Not all studies have reported that the preoperative s-CEA level predicts the outcome in the respective stages of CRC. Huh et al. [8] reported that the preoperative CEA level (cutoff value, 5 ng/mL) was significant for TNM stage II, but not for stage III. However, some other studies showed that the preoperative CEA level was an independent predictor of DFS only for stage III CRC [7, 12-14]. In addition Takagawa et al. [9] reported that the preoperative s-CEA level was a reliable predictive factor for stage II and stage III, but not for stage I. These inconsistent results are due to a single cutoff value of 5 ng/mL, which is known to be the normal value based on the distribution in the general population without CRC, being applied to all cancer patients. In addition, the distribution of the CEA level differs according to the stage in the cancer patients. However, in most studies, a fixed cutoff value is used to predict the outcomes for all stages.
The distribution of the s-CEA level is different in different TNM stages, which is the reason different cutoff values are necessary in different stages. This study has the limitation of a small number of patients. However, that does not limit our showing the trend of the CEA distribution. Although the individualized cutoff values in TNM stage II and III were approximately 5 ng/mL, consistent decreases in the cutoff value from TNM stage I to III and from N0 to N2 stage support a conclusion that a lower cutoff value is necessary in advanced stages. The distribution of the s-CEA level shifts to the right in advanced stages; however, there are more recurrences for the corresponding CEA levels in advanced stages, which is the reason a lower optimal cutoff value is necessary in advanced stages.
Some studies tried to find a practical cutoff value other than 5 ng/mL for the s-CEA level in CRC patients. In a stepwise validation, Park et al. [13] set the cutoff values of s-CEA at 3, 6, and 17 ng/mL and reported that a significant difference in survival could only be observed in patients with stage III tumors. Takagawa et al. [9] tried to find the optimal CEA level based on the time to relapse. They found 10 ng/mL to be a significant threshold in stage II and III. However, that value was not applicable to stage I. In the present study, use of individual optimal cutoff values from the ROC analyses offered prognostic significance of all stages. Our results suggest that the cutoff value of s-CEA should not be applied uniformly and that the optimal cutoff value needs to be individualized for each TNM stage for harmony with the TNM stage and for enhanced usefulness of the CEA level.
The value of the CEA level as a prognostic factor in CRCs has been verified sufficiently. Thus, more importantly at this time is not the question of whether a CEA level of 5 ng/mL is a prognostic factor but a question of finding a practical cutoff value of the CEA level that is in harmony with the TNM staging system. Additionally, the significance of a prognostic factor depends on a reasonable classification of the collected members. Therefore, we suggest adopting individualized cutoff values of the CEA level according to the TNM stage. In addition, large-scale studies are necessary to determine an acceptable and standardized cutoff value for each TNM stage, including a standardized sampling time and assay method. This concept may extend the value of the preoperative s-CEA level as a prognostic factor to patients with stage-IV cancer, where the CEA level is seldom used as a predictor of recurrence after a curative resection.
In conclusion, the preoperative s-CEA level in CRC patients is a reliable predictive factor of recurrence. However, its utility is not fully displayed when a single cutoff value is used. With the adoption of an individualized cutoff value for each TNM stage based on the CEA distributions of the corresponding stages, the preoperative CEA level can be a constant prognostic factor in harmony with the TNM stage. Larger scale studies are necessary to determine the optimal cutoff value for each stage.
Footnotes
No potential conflict of interest relevant to this article was reported.
References
- 1.Gold P, Freedman SO. Specific carcinoembryonic antigens of the human digestive system. J Exp Med. 1965;122:467–481. doi: 10.1084/jem.122.3.467. [DOI] [PMC free article] [PubMed] [Google Scholar]
- 2.Duffy MJ. Carcinoembryonic antigen as a marker for colorectal cancer: is it clinically useful? Clin Chem. 2001;47:624–630. [PubMed] [Google Scholar]
- 3.Wiratkapun S, Kraemer M, Seow-Choen F, Ho YH, Eu KW. High preoperative serum carcinoembryonic antigen predicts metastatic recurrence in potentially curative colonic cancer: results of a five-year study. Dis Colon Rectum. 2001;44:231–235. doi: 10.1007/BF02234298. [DOI] [PubMed] [Google Scholar]
- 4.Harrison LE, Guillem JG, Paty P, Cohen AM. Preoperative carcinoembryonic antigen predicts outcomes in node-negative colon cancer patients: a multivariate analysis of 572 patients. J Am Coll Surg. 1997;185:55–59. doi: 10.1016/s1072-7515(97)00012-4. [DOI] [PubMed] [Google Scholar]
- 5.Sun LC, Chu KS, Cheng SC, Lu CY, Kuo CH, Hsieh JS, et al. Preoperative serum carcinoembryonic antigen, albumin and age are supplementary to UICC staging systems in predicting survival for colorectal cancer patients undergoing surgical treatment. BMC Cancer. 2009;9:288. doi: 10.1186/1471-2407-9-288. [DOI] [PMC free article] [PubMed] [Google Scholar]
- 6.Wang JY, Lu CY, Chu KS, Ma CJ, Wu DC, Tsai HL, et al. Prognostic significance of pre- and postoperative serum carcinoembryonic antigen levels in patients with colorectal cancer. Eur Surg Res. 2007;39:245–250. doi: 10.1159/000101952. [DOI] [PubMed] [Google Scholar]
- 7.Wang WS, Lin JK, Chiou TJ, Liu JH, Fan FS, Yen CC, et al. Preoperative carcinoembryonic antigen level as an independent prognostic factor in colorectal cancer: Taiwan experience. Jpn J Clin Oncol. 2000;30:12–16. doi: 10.1093/jjco/hyd003. [DOI] [PubMed] [Google Scholar]
- 8.Huh JW, Oh BR, Kim HR, Kim YJ. Preoperative carcinoembryonic antigen level as an independent prognostic factor in potentially curative colon cancer. J Surg Oncol. 2010;101:396–400. doi: 10.1002/jso.21495. [DOI] [PubMed] [Google Scholar]
- 9.Takagawa R, Fujii S, Ohta M, Nagano Y, Kunisaki C, Yamagishi S, et al. Preoperative serum carcinoembryonic antigen level as a predictive factor of recurrence after curative resection of colorectal cancer. Ann Surg Oncol. 2008;15:3433–3439. doi: 10.1245/s10434-008-0168-8. [DOI] [PubMed] [Google Scholar]
- 10.Park IJ, Choi GS, Lim KH, Kang BM, Jun SH. Serum carcinoembryonic antigen monitoring after curative resection for colorectal cancer: clinical significance of the preoperative level. Ann Surg Oncol. 2009;16:3087–3093. doi: 10.1245/s10434-009-0625-z. [DOI] [PubMed] [Google Scholar]
- 11.Kirat HT, Ozturk E, Lavery IC, Kiran RP. The predictive value of preoperative carcinoembryonic antigen level in the prognosis of colon cancer. Am J Surg. 2012;204:447–452. doi: 10.1016/j.amjsurg.2011.11.007. [DOI] [PubMed] [Google Scholar]
- 12.Park YA, Lee KY, Kim NK, Baik SH, Sohn SK, Cho CW. Prognostic effect of perioperative change of serum carcinoembryonic antigen level: a useful tool for detection of systemic recurrence in rectal cancer. Ann Surg Oncol. 2006;13:645–650. doi: 10.1245/ASO.2006.03.090. [DOI] [PubMed] [Google Scholar]
- 13.Park IJ, Kim HC, Yu CS, Yoo JH, Kim JC. Cutoff values of preoperative s-CEA levels for predicting survivals after curative resection of colorectal cancer. J Korean Med Sci. 2005;20:624–627. doi: 10.3346/jkms.2005.20.4.624. [DOI] [PMC free article] [PubMed] [Google Scholar]
- 14.Goslin R, Steele G, Jr, Macintyre J, Mayer R, Sugarbaker P, Cleghorn K, et al. The use of preoperative plasma CEA levels for the Stratification of patients after curative resection of colorectal cancers. Ann Surg. 1980;192:747–751. doi: 10.1097/00000658-198012000-00010. [DOI] [PMC free article] [PubMed] [Google Scholar]
- 15.Thirunavukarasu P, Sukumar S, Sathaiah M, Mahan M, Pragatheeshwar KD, Pingpank JF, et al. C-stage in colon cancer: implications of carcinoembryonic antigen biomarker in staging, prognosis, and management. J Natl Cancer Inst. 2011;103:689–697. doi: 10.1093/jnci/djr078. [DOI] [PubMed] [Google Scholar]
- 16.Edge SB, Byrd DR, Compton CC, Fritz AG, Greene FL, Trotti A, editors. AJCC cancer staging manual. 7th ed. New York: Springer; 2010. [Google Scholar]
- 17.Compton C, Fenoglio-Preiser CM, Pettigrew N, Fielding LP. American Joint Committee on Cancer Prognostic Factors Consensus Conference: Colorectal Working Group. Cancer. 2000;88:1739–1757. doi: 10.1002/(sici)1097-0142(20000401)88:7<1739::aid-cncr30>3.0.co;2-t. [DOI] [PubMed] [Google Scholar]
- 18.Compton CC, Fielding LP, Burgart LJ, Conley B, Cooper HS, Hamilton SR, et al. Prognostic factors in colorectal cancer. College of American Pathologists Consensus Statement 1999. Arch Pathol Lab Med. 2000;124:979–994. doi: 10.5858/2000-124-0979-PFICC. [DOI] [PubMed] [Google Scholar]


