

Significance
A deep puzzle in neuroscience is how neurons maintain their electrical properties despite continuous ion channel turnover and activity perturbations. Previous work proposed that activity-dependent homeostatic rules ensure robust development of excitability by regulating channel density, although it is not understood how these rules shape the distribution of ion channel types nor how finely tuned these rules must be. We show that generic homeostatic regulation rules impose correlations in the steady-state distribution of ion channels, as has been recently observed experimentally. Specific correlations depend on relative expression rates, and the regulation rules themselves are far more robust than previously thought.
Keywords: neuronal excitability, robustness, computational models, control theory
Abstract
Experimental observations reveal that the expression levels of different ion channels vary across neurons of a defined type, even when these neurons exhibit stereotyped electrical properties. However, there are robust correlations between different ion channel expression levels, although the mechanisms that determine these correlations are unknown. Using generic model neurons, we show that correlated conductance expression can emerge from simple homeostatic control mechanisms that couple expression rates of individual conductances to cellular readouts of activity. The correlations depend on the relative rates of expression of different conductances. Thus, variability is consistent with homeostatic regulation and the structure of this variability reveals quantitative relations between regulation dynamics of different conductances. Furthermore, we show that homeostatic regulation is remarkably insensitive to the details that couple the regulation of a given conductance to overall neuronal activity because of degeneracy in the function of multiple conductances and can be robust to “antihomeostatic” regulation of a subset of conductances expressed in a cell.
The electrophysiological signature of every neuron is determined by the number and kind of voltage-dependent conductances in its membrane. Most neurons express many voltage-dependent conductances, some of which may have overlapping or degenerate physiological functions (1–6). Furthermore, neurons in the brains of long-lived animals must maintain reliable function over the animal’s lifetime while all of their ion channels and receptors are replaced in the membrane over hours, days, or weeks. Consequently, ongoing turnover of ion channels of various types must occur without compromising the essential excitability properties of the neuron (5, 7–10).
Both theoretical and experimental studies suggest that maintaining stable intrinsic excitability is accomplished via homeostatic, negative feedback processes that use intracellular Ca2+ concentrations as a sensor of activity and then alter the synthesis, insertion, and degradation of membrane conductances to achieve a target activity level (11–27). Among the modeling studies are several different homeostatic tuning rules that differ in how sensor readout is coupled to the changes in conductance necessary to achieve a target activity (11, 13, 14, 28). Regardless, these models can self-assemble from randomized initial conditions, and they will change their conductance densities in response to perturbation or synaptic drive. In one of these homeostatic self-tuning models (14), similar activity patterns can be associated with different sets of conductance densities.
Thus, it is perhaps not surprising that experimental studies also find a considerable range in the conductance densities of voltage-dependent channels and in the mRNA expression of their ion channel genes (29–36). The experimental studies also showed clear correlations in these expression patterns (30, 32–35); for example, strong linear correlations are found between mRNA copy number for shal/A-type potassium channels and IH/hyperpolarization/cyclic nucleotide activated channels in identified crustacean motor neurons. It is therefore possible that these correlations are crucial for the electrophysiological behavior of the neuron in question. However, when large numbers of model neurons (without a homeostatic tuning rule) were made from random sets of conductance parameters and then searched for those that produce a specific behavior, they did not show correlations in conductance expression that resemble the experimental findings (37). This finding raised the question of how the correlations seen in the experimental data are established and whether they are somehow genetically hardwired. For example, correlations in ion channel expression may simply result from explicit coregulation, such as control of gene expression by a common transcription factor or silencing of a subset of genes in a certain population of cells. Another possibility is that correlations emerge from some interaction between activity-dependent regulatory processes that control the expression of different ion channel types.
We address this question in this paper using theory and computational models. We show that correlations in ion channel expression emerge as a consequence of homeostatic control mechanisms that couple the expression rates of individual conductances to a cell-intrinsic readout of activity. Importantly, the shape of the correlation pattern is determined by the relative rates of expression of different conductances. Furthermore, we show how degeneracy implies that regulatory control mechanisms do not need to be as precisely tuned as previously anticipated. For example, subsets of conductances can be regulated antihomeostatically without interfering with convergence to a target activity level, meaning that inward conductances can up-regulate in response to elevated activity and vice versa for outward conductances. Thus, there is considerable flexibility in how different conductances can be regulated while maintaining a “set point” in activity. This flexibility is compatible with distinct correlation patterns seen in the conductance expression of different neuron types.
Results
There are several existing homeostatic neuron models that use intracellular Ca2+ concentrations to regulate their conductances (11, 13, 14, 18, 28, 38). These models are capable of producing and maintaining complex activity patterns such as rhythmic bursting that rely on the interactions between many voltage-dependent conductances and Ca2+ dynamics. Analysis of these models is often mathematically intractable, and it is also difficult to develop an intuitive understanding of how the distribution of conductances is shaped over time. Therefore, in this study we start with a toy model with three non–voltage-dependent conductances and simple Ca2+ dynamics. We then progress to a more complicated spiking model with three regulated voltage-dependent conductances and finish with an analysis of an existing model that has seven voltage-dependent conductances and three distinct [Ca2+] sensors. In all three cases, we examine how the correlations in the steady-state conductance distributions are shaped by the parameters that govern regulation. We find that the intuition developed in the simplest model carries over to more complex cases.
Correlations Arise in Simple Model of Homeostatic Regulation
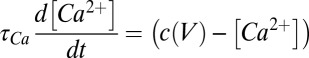
The toy (leak) model consists of multiple Ohmic conductances with different reversal potentials expressed in a single compartment (schematized in Fig. 1A). To provide a biophysical correlate of activity, we added first-order Ca2+ dynamics with a biologically realistic decay time constant (100 ms) and an exponential steady-state dependence on membrane potential, Vm. The Ca2+ signal therefore gives a readout of Vm that approximates the way that Ca2+ concentration responds to membrane potential fluctuations in biological neurons.
Fig. 1.

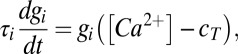
A toy model of activity-dependent conductance regulation. (A) Schematic of a neuron with regulated inward (gin) and outward (gout) conductances. Inward conductances promote Ca2+ influx through voltage-gated calcium channels (red) by depolarizing the membrane potential, whereas outward conductances inhibit Ca2+ influx. In turn, Ca2+ influx up-regulates the outward current and down-regulates the inward current possibly via modulation of transcription rates or ion channel trafficking dynamics (gray circle). (B) A simplified model neuron with three Ohmic conductances g1, g2, and g3, each with a different reversal potential (−90, −30, and +50 mV, respectively). Calcium dynamics are first order with exponential steady-state dependence on membrane potential,  (Methods) and each conductance is regulated with a specific regulation time constant,
  , according to the difference between [Ca2+] and a target value,
  . (C) Behavior of three versions of the model with different sets of regulation rates. The traces show the evolution of the three conductances and internal [Ca2+] in 30 simulations of each version of the model. Blue traces, original rates (
 ); green traces, scaled rates (
 ); red traces, g2 rate flipped
  . (D) Steady-state conductance distributions. 3D plots showing all three conductances for 300 runs using each of the three sets of regulation rates (orange points, random initial values; blue, original rates; green, scaled rates; red, rate flipped). Each 3D plot is a different view of the same data and the colored curves are the sample trajectories plotted in C. The large plot to the right shows the calculated solution space of conductance values that give target [Ca2+] (pink plane). The arrows represent the surface normal of the solution plane (pink), the velocity vector for the trajectory of the mean model trace with the original rate set (light blue), and the vector obtained by projecting this velocity vector onto the solution plane (dark blue). (E) Scatterplot matrices showing pairwise scatterplots (off-diagonals) between the three maximal conductances in each version of the model. Histograms (diagonals) show the distribution of each maximal conductance by itself. Black lines in each scatterplot are the correlations predicted by resolving the model trajectory onto the solution set (Methods) as illustrated in the right plot of D. The schematic to the right of the plots show how the axes in the plots are organized.
Finally, we added a mechanism that slowly varies each membrane conductance according to activity. To ensure a stable activity level, we postulate a “target value” for [Ca2+] such that each conductance is up- or down-regulated according to the current [Ca2+] level (Methods), thus determining a homeostatic rule. For example, the inward conductance gin down-regulates when [Ca2+] is above its target value and up-regulates below it (Fig. 1A).
The expression level of each conductance in this model is therefore independently coupled to activity with its own slow dynamics (Fig. 1B). It is important that we assume regulation is slow because this corresponds to what is observed experimentally, where homeostatic or compensatory changes in neuronal membrane conductances in many preparations occur over many hours or days (39–41). It also turns out that because regulatory dynamics are much slower than fluctuations in activity, the toy model approximates the way in which complex, voltage-dependent conductances shape average activity over similarly slow timescales (42) (Methods: Mathematical Analysis).
Fig. 1C shows the behavior of this model. The model has an outward conductance g1 (reversal potential, Erev = −90 mV) and two inward conductances, g2 (Erev = −30 mV) and g3 (Erev = +50 mV). In all of the traces in Fig. 1C, the blue traces show the evolution of a canonical version of the model in which the inward conductances are down-regulated when [Ca2+] is above target and up-regulated when [Ca2+] is below target. The outward conductance is regulated in the opposite direction. Each of these conductances has a different time constant of regulation (SI Appendix, Methods).
The light blue traces in Fig. 1C show multiple runs initialized with random values for each conductance. The bold traces show the trajectory of the model starting at the average value of this random initial distribution. In this model, the final conductance values are different for each distinct run. We asked how the values of the regulation time constants influence the evolution of the model by varying each independently. The green traces in Fig. 1C show a version of the model in which the time constants for g1, g2, and g3 are scaled ( ,
,  ,
,  , respectively), resulting in steeper rates of change in this case. In both of these versions of the model, [Ca2+] equilibrates at its target value. Interestingly, when we changed the sign of g2 (thus making its direction of regulation antihomeostatic), the model also converges to target [Ca2+] value. In fact, homeostatic models with multiple conductances can tolerate such antihomeostatic regulation in a subset of conductances provided broad constraints on the regulation rates (
 ) are respected.
How do the regulation rates influence the resulting steady-state distribution of conductances? Fig. 1D shows three views of a 3D plot showing the conductances as they are distributed initially (orange points) and at steady state. Each version of the model (with different sets of regulation rates) converges to a distinct region of conductance space, but these regions sit on a common plane (pink rectangle). This plane is simply the solution set of all conductances that produce target activity in the model. Thus, the regulation rates (as well as the initial values of the conductances) determine the direction in which the model evolves in conductance space, whereas the point of intersection of each trajectory with the solution plane dictates the steady-state conductance values.
The correlation between each pair of conductances is obtained by projecting the steady-state clouds of points in Fig. 1D onto the respective axes. Fig. 1E shows distinct pairwise correlations between all three conductances. Changing the regulation rates changes the correlations (panel 2, green) as does making one of the regulation directions antihomeostatic (third panel, red). Thus, correlations emerge from homeostatic rules, and the specifics of the correlations depend on the specifics of the rates governing the insertion and removal of the channels in the membrane.
Mathematically, the pairwise correlations are determined by the geometric relation between the plane and the location of the steady-state points. We calculated the slopes of the correlation between each conductance (black lines in Fig. 1E) as follows (full details are in Methods: Mathematical Analysis). The trajectories of the models’ evolution are shown in the 3D plots of Fig. 1D. The light blue arrow in the large plot shows the direction of the mean trajectory as it hits the plane, whereas the pink arrow shows the surface normal of the plane. To calculate the correlation vector at this point, we simply resolve the light blue arrow onto the plane as shown (dark blue arrow). The ratios of the components of this correlation vector provide the pairwise correlations in the conductances.
The relationship between the solution plane, the initial conductance values, and the direction of the model’s trajectory through conductance space (determined by the regulation rates and the form of the regulatory rule) dictates whether or not the model converges to stable target behavior (see Methods for analysis of convergence/stability). Intuitively, as long as the net movement of the trajectory is toward the plane, the regulation rule will converge. Many combinations of regulation rates achieve this, including the three sets of rates in Fig. 1. More generally, if expression rates and signs (i.e., directions) are chosen at random in this toy model, over half (62%) of the resulting models produce stable target activity with conductance values inside reasonable bounds (<1 mS/nF; Methods).
Thus, the stability of homeostatic regulation is relatively insensitive to the regulation rates. Moreover, because the rates determine correlations, there is a large amount of freedom to determine the direction and magnitude of correlations between conductances. The specification of relative expression rates is therefore a robust mechanism by which distinct cell types can maintain distinct correlations in their conductances.
Correlations Emerge in a Homeostatically Regulated Spiking Model
A simple leak model is intuitive to understand and straightforward to work with mathematically, but the most widely relevant and interesting examples of homeostatic regulation involve voltage-dependent conductances. The dynamics of regulation in these more complex cases are difficult to study because there is a far more complicated relationship between the distribution of conductances and the resulting activity pattern. It was therefore not immediately clear that the results we obtained for the leak model would carry over to more realistic conductance-based models of spiking neurons. To address this, we constructed a single-compartment, conductance-based model of a spiking neuron with seven voltage-gated conductances, a fixed leak conductance, and realistic calcium dynamics. Three of the seven voltage-gated conductances (A-type potassium, gKA, delayed rectifier, gKd, and hyperpolarization-activated mixed cation conductance gH) in this model are controlled by the same homeostatic regulation rule as in the toy model with a single intracellular [Ca2+] target. The remaining conductances are fixed at values that generate tonically spiking behavior over a range of randomly chosen initial values for the three regulated conductances (SI Appendix, Methods).
Fig. 2A shows the evolution of [Ca2+] in this model for three different sets of regulation rates. As with the toy model, we fixed a default set of rates (blue traces) and from these defined a scaled set ( ,
,  ; green traces) and a flipped set (
 , red traces). All three sets of rates produce models whose average [Ca2+] converges to the homeostatic target. Fig. 2B shows membrane potential activity at different time points in the evolution of each version of the model. The random initial conductance distribution produces spiking neurons with high firing rates (∼30 Hz), and as a result, [Ca2+] is above target. Over time, all three versions of the model converge to a set of conductances (Fig. 2C) that have a lower firing frequency and qualitatively different spike shapes.
Fig. 2.

Behavior of the simple model is recapitulated in a model with active conductances. Behavior of a spiking model neuron with three regulated voltage-dependent conductances controlled by the simple regulatory rule in Fig. 1B. Three versions of the model are shown with the regulation rates at their original values ( , blue plots; Methods), scaled (
 ; green), and the regulation rate for gH flipped (
 ; red). (A) Example traces of [Ca2+] in each of the three versions of the model (traces truncated at 1,500 ms). (B) Example membrane potential traces at different time points (1, 2, and 3) for each version of the model. (C) Example traces showing the evolution of the three regulated conductances in 30 simulations of each version of the model. (D) (Upper) 3D scatterplot showing the steady-state conductance distributions for 300 model simulations with each set of rates. The two plots show two rotated views of the same data. (Lower) Correlation plots of steady-state conductances for each version of the model.
The steady-state conductance distributions for this model are shown in the 3D plots in Fig. 2D. In this region of conductance space, the sets of solutions that give target [Ca2+] are seen to sit on a surface that is close to being planar. Again, these solutions give rise to pairwise correlations between the three regulated conductances, as can be seen in the correlation plots at the bottom of Fig. 2D. Thus, despite the complex, nonlinear relationship between the dynamics of the voltage-dependent conductances in this model and membrane potential activity, the steady-state conductances distribution behaves in a similar way to the toy model. This simple behavior will not be true for all regions of parameter space because it is known that the solution spaces for a particular type of activity can be complex and exhibit abrupt dependencies on the maximal conductances. However, locally, these solution spaces can often be well approximated by a flat space owing to the smooth dependence of quantities such as “average calcium concentration” on maximal conductances (Methods: Mathematical Analysis). The toy model is therefore a useful tool for understanding general properties of homeostatic regulation.
Correlation Structure in a Seven-Conductance Homeostatic Model
The toy model of homeostatic regulation can explain, in part, how correlations can arise in the conductance distributions of real neurons, as has been observed recently (30, 33), and makes a strong prediction about the behavior of more complex and realistic regulatory models. Specifically, the simplified model predicts that regulatory control mechanisms that independently tune multiple conductance densities according to a target activity level impose a correlation structure on the steady-state conductance distribution. Furthermore, it predicts that a subset of membrane conductances can be regulated antihomeostatically, and this can nonetheless produce target behavior, but with a different final conductance distribution for a given range of initial conditions. To investigate this prediction in a more realistic situation with multiple nonlinear conductances and multiple activity sensors, we examined how regulation shapes steady-state conductance distributions in an existing, complex model of a self-regulating rhythmically bursting cell developed in Liu et al. (14).
The Liu et al. model has seven voltage-dependent conductances plus a leak conductance (SI Appendix, Methods), a Ca2+ buffering mechanism, and three activity sensors that depend on calcium influx through the two voltage-gated Ca2+conductances. These sensors act as filters that decompose the Ca2+ signal into three bands: a fast band corresponding to Ca2+ transients caused by spikes, a slow band corresponding to Ca2+ waves that generate rhythmic bursting, and a steady-state band that measures average Ca2+ influx. The regulatory control mechanism imposes a target on each sensor that was empirically chosen (14) to generate bursting models with dynamics similar to crustacean pacemaker neurons. This model thus has a high-dimensional conductance space and multiple constraints imposed by its regulatory mechanism.
We generated a population of 9,370 Liu et al. model neurons by initializing each cell with uniform, randomly distributed maximal conductances and allowing the conductance distribution to reach steady state. An example run is shown in Fig. 3A, where it is important to note the short timescale of convergence. This timescale, determined by a short conductance regulation time constant of 5 s, does not mirror the biology but was necessary to make repeated simulations of this model practical and does not qualitatively change the steady-state solution (14). Eight thousand eighty-seven models (86%) from this initial population converged to a steady state with sensor values equal to their targets (SI Appendix, Methods). The resulting conductance distribution for these models is shown in Fig. 3B, where the values of the maximal conductances have been restricted to physiologically reasonable bounds. The relationship between the maximal conductances in this solution space is clearly more complex than can be described by straightforward linear correlations as in the simpler models of Figs. 1 and 2. Such a relationship is to be expected given the highly nonlinear relationship between the effects of each of the model’s conductances on the three activity sensors. Nonetheless, a clear pattern is evident in the pairwise plots of maximal conductances (Fig. 3B).
Fig. 3.

Structure of the steady-state conductance distribution in a complex homeostatic model neuron. Behavior of a complex bursting model neuron with seven regulated voltage-dependent conductances and a regulation rule that uses three [Ca2+] sensors. (A) Evolution of the maximal conductances over time for a single regulated neuron. Example voltage traces at three time points along the evolution trajectory are shown at the right, showing that the model converges to the target bursting behavior (horizontal line = 0 mV). (B) Pairwise scattergrams (off-diagonals) and histograms (diagonals) of the final values for the seven regulated maximal conductances after 1 h of simulated time. Each scattergram is a 2D histogram with color representing count density (red, high; yellow, intermediate; green, low; blue, zero). The conductance ranges plotted are (in μS) 0 through 146 (gNa), 2.9 (gCaT), 5.4 (gCaS), 134 (gKA), 134 (gKCa), 69 (gKd), and 0.8 (gH). (C) Pairwise scattergrams and histograms for the same seven conductances as in B, showing randomly sampled solution space of models that satisfy target sensor values within 10%. Ranges for each conductance axis are the same as B. (D) Thinned (5,000 points) pairwise scatterplot between gKd and gNa in converged homeostatic models (regulated) and for random sampling (random). These scatterplots correspond to the subplots outlined with pink boxes in B and C, respectively. Example voltage traces of labeled models are plotted to the right for several different points in the solution space (horizontal line = 0 mV).
The intuition developed in the toy model of Fig. 1 tells us that the set of solutions found by a homeostatic mechanism is a subset of all available solutions. To approximate the set of all solutions over a range of conductances in the complex model, we analyzed the membrane potential behavior of 2 × 10⁶ nonregulating model neurons randomly parameterized from a uniform distribution spanning the physiologically realistic range of maximal conductances in the converged, regulated models. Of these random models, we selected 8,638 that had activity within 10% of the target sensor values. This tolerance corresponds to approximately 1 SD of the steady-state sensor values in the converged Liu et al. models and was found to be sufficient to determine bursting behavior (SI Appendix, Methods). In both regulated and randomly selected models, a wide variety of bursting behaviors is evident as can be seen in the traces in Fig. 3D. Furthermore, representatives of the different characteristic behaviors (as delineated by membrane potential waveform, bursting frequency, and number of spikes per burst) can be found in both cases.
The correlation structure in membrane conductances of the randomly selected bursting models is markedly different from the structure observed in models that implement regulatory control to achieve their target activity (Fig. 3 B–D). This difference demonstrates that the regulatory control mechanism does indeed impose a characteristic correlation structure on the distribution of conductances, as predicted by the analysis of the toy model. In general, the randomly selected solutions exhibit less structure in this distribution, as exemplified in the scatter plots of gNa vs. gKd in Fig. 3D. However, certain conductance pairs show a compensatory relationship that is preserved in the Liu et al. models, for example, gCaS vs. gKA in Fig. 3 B and C.
Finally, we addressed the question of how the model behaves when conductances are regulated in the wrong direction. The left table in Fig. 4A shows the regulation coefficients used in the original model alongside a set of coefficients that was formed changing the signs of the regulatory coefficients of the A-type potassium conductance, gKA. In the original model, gKA is up-regulated when either the slow or the steady-state Ca2+ sensor is above target and down-regulated when these sensors are below their target level. The sign change in the alternate model causes gKA to be regulated in the opposite way, which is intuitively antihomeostatic.
Fig. 4.

Antihomeostatic regulation can coexist with homeostatic regulation in a complex model. (A) Regulation coefficients in the original Liu et al. model (Left) and in an alternate version in which regulation coefficients for gKa are reversed (Right). Each coefficient determines whether a conductance is up- or down-regulated when sensors are above or below targets (+1, up-regulate if below target/down-regulate if above target; −1, down-regulate if below target/up-regulate if above target.) (B) Pairwise scattergrams and histograms of the final values for the seven regulated maximal conductances after 1 h of simulated time using the original parameters of the Liu et al. model (Left) and the alternate model (Right). Each scattergram is a 2D histogram with color representing count (red, high; yellow, intermediate; green, low; blue, zero). In both sets of scattergrams, the ranges plotted are 0 through 440 (gNa), 8.6 (gCaT), 16.2 (gCaS), 402 (gKA), 402 (gKCa), 207 (gKd), and 2.3 μS (gH). (C) Detail of the pairwise relationships between gKd/gNa and gH/gCaT (pink boxes in B) shown as thinned scatterplots (5,000 points) for the original model (Upper) and the alternate model (Lower). Example voltage traces of labeled points in solution space are shown to the right (horizontal line = 0 mV).
As predicted by the analysis of the simplified model, changing regulation signs in this way causes convergence to a different distribution of final membrane conductances. This effect can be seen by comparing the correlation maps and histograms in Fig. 4B. For example, the distribution of gKA and gCaS is shifted toward lower values, which has a clear effect on the pairwise relation between these two conductances (scatterplots in Fig. 4C). On the other hand, the distribution and correlation pattern of gKd and gNa is left relatively unchanged. Despite this shift in the overall distribution of conductances, target sensor values are achieved, and this results in functional bursting behavior as shown in Fig. 4C. To make a valid comparison with the behavior of the original model, we used the same random initial conditions. This condition resulted in fewer models (77%) converging to steady state according to our criteria than in the original model. Perhaps surprisingly, examples that are representative of the diverse range of bursting behaviors in the original model can nevertheless be easily found in the alternate model, as is evident in the example traces in Fig. 4C. Thus, two different sets of regulation rules find a subset of the available bursting solutions in conductance space, and this distribution is concentrated in a different region for each set of rules. The fact that the alternate model converges to the same functional behavior shows that there is sufficient degeneracy in the dynamical properties of the eight conductances to reach target activity despite the altered regulation rule.
Discussion
Almost twenty years ago, a handful of theoretical studies (11, 13, 28) suggested that stable neuronal function requires some kind of homeostatic regulation of ion channel expression. These studies triggered a host of experimental studies that are consistent with the idea that nervous systems must balance the mechanisms that allow them to be plastic with others that maintain their stability (5, 40, 41, 43). Subsequently, both theoretical and experimental studies showed that there are multiple solutions consistent with very similar activity patterns (31, 37, 44–47). It is important to recognize that homeostatic tuning rules, such as those studied here, do not invariably produce the same set of channel densities, but instead result in a target activity that is consistent with a range of solutions. It is also important to remember that, although homeostatic tuning rules can compensate for many perturbations and for some genetic deletions, they cannot compensate for all deletions of specific currents. Indeed, when there are multiple currents with degenerate, or overlapping functions, compensation occurs easily, but if there is a single current responsible for an important process, homeostatic tuning rules will never achieve perfect compensation on deletion of this current.
One of the contributions of the present work is that we have shown that the range of solutions consistent with a particular homeostatic rule has a specific structure that results in correlations in ion channel expression. Thus, the experimental measurements of correlations (29, 30, 33, 35) may provide direct insight into the underlying regulatory rates in biological neurons. Moreover, we now demonstrate that the homeostatic processes themselves can be far sloppier than might have been previously expected. This robustness is comforting, as it reassures us that these kinds of processes can be instantiated in biological systems that have variable and noisy components.
Before relating our modeling results to biology, it is important to note the assumptions our work is based on and their potential limitations. The clearest simplifying assumption we have made is the form of the regulatory rule, which simply modulates the rate of expression of different membrane conductances to a Ca2+ error signal. Biological neurons use complex cascades of signal transduction and trafficking mechanisms to control ion channel expression, and these mechanisms remain the focus of intense research (23, 39, 48–50). Our results rely on these underlying pathways approximating a simple feedback rule that depends on intracellular Ca2+concentration. An important task for future work is to relate simplified schemes such as the regulatory rule we use here to the details of the biological signaling mechanisms as they become available. Nonetheless, existing experimental work that measures the dynamics of homeostatic plasticity and its dependence on mean intracellular Ca2+ concentration are consistent with the qualitative behavior of simple models (15, 20, 23).
Homeostasis and Degeneracy
Most neurons express upward of tens of different types of ion channels, and many of these channels overlap in their biophysical properties. For example, several genetically distinct potassium channels can coexist in a single mammalian neocortical neuron (34), and to some extent, these channels perform similar electrophysiological functions. This kind of functional overlap is an example of degeneracy (51, 52), and its existence in membrane conductance properties of ion channels has important implications for homeostatic regulation mechanisms (6). This observation was first made theoretically by examining the degeneracy present in the map between conductance space and electrophysiological phenotypes, where it is clear that multiple conductance distributions can give rise to electrical properties that are, in biological terms, virtually identical (46, 46, 53). Degeneracy of this kind has been observed experimentally (31) and prompts the question of how neurons regulate multiple conductances to achieve a characteristic electrical behavior. A clue was found in the observation that neurons of a defined type show strong correlations between both mRNA expression and functional expression of different ion channels (29, 30, 33). This finding led to the idea that correlations provide an important determinant of cell identity by ensuring fixed ratios in the expression of different ion channel types (54). However, it is not known how such correlations are achieved or maintained. Our findings add to this picture by showing that feedback regulation of conductances toward activity set points constrains the steady-state distribution and that this can produce distinct correlation patterns.
Not only could this effect contribute to observed correlations in experimental measurements of membrane conductances (29, 30, 32–35), but it may also explain why previous studies that found successful models based on phenomenological properties of neuronal activity failed to replicate biological correlation structures (37, 47, 54). These previous studies randomly sampled the set of membrane conductances in complex, rhythmically bursting neuron models and selected combinations of conductances that reproduced biologically realistic behavior. However, the correlation pattern found by randomly sampling in this way did not resemble correlation patterns in found in experiments: a result that parallels the situation in Fig. 3, where randomly selected models and homeostatically regulated models exhibit very different conductance distributions. To replicate experimentally observed correlations in models, it may therefore be necessary to obtain a quantitative description of how conductances are regulated with respect to activity and the ways that different conductances shape activity.
Nonetheless, activity-dependent regulation cannot be thought of as a catch-all for explaining ion channel expression. In biological neurons, we expect many constraints to exist besides broad activity targets, and these will further shape the solution space. For example, the coordinated expression of ion channels may be coupled to activity-independent processes, such as interactions between scaffolding molecules and auxiliary subunits that stabilize and localize surface expression. Expression levels may also be hard-wired in a way that only makes sense from an evolutionary perspective, including conserved transcriptional control of multiple ion channel genes by a shared transcription factor or regulatory element. In any case, additional rules which fine tune conductance distributions within neurons can be readily layered on top of activity-dependent regulation because, as we have shown, activity-dependent rules are themselves remarkably robust and flexible.
How Conductance Correlations Are Related to Expression Rates
In all of the models, we saw that the shape of the steady-state distribution of conductances depends on the rate at which each conductance is regulated with respect to other conductances. One way to think of this is to imagine a neuron that homeostatically regulates two-pore domain (leak) potassium channels more quickly than persistent sodium channels. In situations where activity is too low, the potassium channels will be rapidly removed from the membrane, and the sodium channels will slowly start to accumulate. By the time the activity target is reached, the potassium channels will have undergone a larger change in their expression than the sodium channels. Throughout a population of these hypothetical cells with varying activity histories, one would observe a large range in potassium channel density and a smaller range in sodium channel density, with the two channel types showing correlated expression according to the combinations that achieve the homeostatic target.
In biological neurons, it is therefore plausible that differing rates of expression between ion channel subtypes provide a mechanism for determining cell type signatures in correlated ion channel expression. Viewed in this way, the regulatory mechanisms are a more fundamental determinant of cellular identity than the expression levels of ion channels and mRNAs at a single point in time. This perspective is consistent with the principle that specific transcription factors are often used as cell type markers and with the observation that reliable cell type classification requires the expression of many ion channel genes to be measured combinatorially (34, 55).
Robust Regulation from Degenerate Ion Channel Function
An important consequence of degeneracy in membrane conductances is that the regulation of all individual conductances in a given neuron need not occur in the correct direction in the homeostatic sense, provided a sufficient subset of remaining conductances is appropriately regulated. Recent work (56) that quantified expression of the transcriptome of murine cortical neurons revealed both up- and down-regulation of inward and outward conductances in response to sustained membrane potential depolarization. However, the same manipulation in similar preparations has also been shown to result in a net down-regulation of intrinsic excitability (15, 50). Our work here helps resolve these empirical observations and cautions against focusing on individual genes and proteins when trying to understand compensatory responses.
In general, this indicates that homeostatic mechanisms in neurons leave more room to maneuver in the way individual conductances are regulated than previously appreciated. Indeed, recent experiments indicate that in addition to homeostatic regulation of maximal conductance, the half-activation of voltage-gated conductances can be subject to regulation and that this permits tuning of rebound spiking in dopaminergic cells of the substantia nigra (57).
The advent of high-throughput, multiplexed monitoring of gene expression, protein expression, and neuronal activity offers the potential to quantify the level of degeneracy in nervous systems. In principle this will allow us to explore questions that, at present, can only be fully addressed in a theoretical setting, such as how the full complement of ion channels in a population of neurons might be regulated during development and in response to perturbations. Our study highlights the role of degeneracy in homeostatic systems, illustrating the extent to which degeneracy explains variability and enables systems to cope with aberrant regulation of a subset of components. A full understanding of homeostasis in degenerate systems is a therefore a prerequisite to understanding phenotypic variability in nervous systems, and why, in the case of many diseases, the nervous system may not be able to compensate for loss of function.
Methods
Mathematical Analysis.
Here we analyze the regulatory system in the case of a single calcium sensor, i.e., when regulation is just a function of instantaneous calcium concentration. For the toy model, we can derive explicit expressions for the conductance correlations and conditions for convergence/stability of the regulatory system. The more complex voltage-dependent case is similar locally. The details of how average calcium concentration depends on each of the conductances will determine how well local behavior approximates global behavior in specific cases.
The equations for the toy model are:
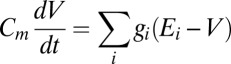 |
 |
 |
where  is (unit = 1 nF) membrane capacitance,
  is membrane potential,
  is conductance,
  is the reversal potential corresponding to each conductance,
  is calcium decay time constant,
  is the membrane potential-dependent steady-state calcium concentration,
  is the conductance regulation time constant, and
  is the calcium concentration target.
For slow regulation we can assume 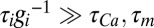 (where
  is the membrane time constant) and we replace
  and
and  with their steady-state values. This results in an autonomous system of equations in the conductances alone:
where the dot indicates time derivative,  and we have written
 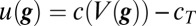 and
and  for convenience. Unfortunately, this system is nonlinear and cannot be solved explicitly (as a function of time) by standard methods. We can, however, describe the locus of the solution trajectory in the toy model. We can also derive conditions for stability and determine the pairwise correlations at steady-state in more general cases.
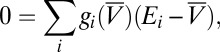
The solution space for the toy model is obtained by setting Eq. 1 to zero, which results in a (hyper) plane equation in  :
:
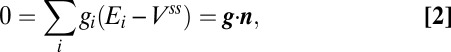 |
where  and
and  .
.
A more general case with voltage-dependent conductances has a similar expression for the solution set, namely:
 |
where  denotes the mean membrane potential at (quasi) steady-state. This equation no longer defines a hyperplane due to the dependence of
  on
on  . It is, however, locally approximated by a plane of the form 2 by setting the
  to their value at a particular equilibrium solution. The general solution space is thus an (n-1) manifold (possibly containing singularities where the steady-state is unstable or when membrane potential activity abruptly changes with variation in a conductance). This relates the toy model to more complex models involving voltage-dependent conductances.
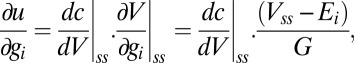
Eq. 1 defines the direction of the flow of the system at any point in conductance space. The pairwise correlations can be computed in general by resolving the flow vector onto the solution space near an equilibrium point. We write the system as:
Linearizing about a point in conductance space ( ) and rewriting
  gives
gives
where  . The direction of flow is therefore given by
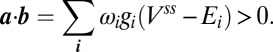
  . The correlation vector,
  , is then computed at
  as follows:
where  is the unit normal vector to the solution plane,
  defined in Eq. 2. Pairwise correlations are then obtained from the ratios of the components of
  . This shows explicitly how the correlations depend on the expression rates of each conductance for arbitrary regulation rules.
For example, for the toy model,  becomes:
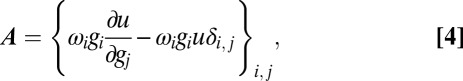 |
where  is the Kronecker delta symbol. Substituting this into 3 and using the equation for
  defined in 2 gives an explicit expression for the correlations in terms of the parameters of the model. This calculation was used to produce the correlation lines in Fig. 1E.
Alternatively, single-sensor models permit the loci of the trajectories to be determined by taking the quotients the derivatives of each conductance defined in 1 when  :
:
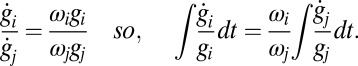 |
This gives  for each i, j with r determined by the initial values of each conductance,
 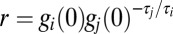 . Solutions (where they exist) are therefore given by solutions to the following system of equations, which define the intersection points of the trajectory loci with the solution plane:
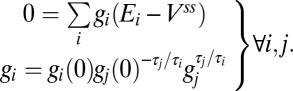 |
The existence of strictly positive solutions to this system on the branch of the locus in which the trajectory moves provides a criterion for the convergence of the homeostatic rule.
Numerically, the system described in Fig. 1 converges in 62% of cases (6151 out of 10,000 simulations) where the regulation rates are randomly chosen on the ball defined by  ,
,  .
.
The linearization also allows us to provide explicit necessary conditions for stability at steady-state. Imposing steady-state conditions in 4,  becomes:
 |
where  denotes outer product,
  , and
, and  .
.
The characteristic equation of this linearization is therefore:
This has  degenerate solutions
  and a single solution,
  . The zero eigenvalues prevent us from rigorously deriving sufficient conditions for stability using the linearization alone [in fact, these correspond to a center manifold (58) that defines the solution space, which we know is stable in the toy model]. We can, however, provide necessary conditions by considering the unstable case,
  . Now,
 |
where  . Therefore the condition
  implies
 |
So necessary conditions for stability are:
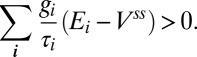 |
This is intuitively clear since  are just the components of the normal to the solution space; i.e., for the system to be stable, trajectories must not move away from the solution plane when perturbed.
Computational Modeling.
Details of all computational models and simulations are contained in the SI Appendix, Methods.
Supplementary Material
Acknowledgments
We thank Thierry Emonet and Mark Adler for helpful discussions and Ted Brookings and Tilman Kispersky for comments on earlier manuscripts. This work was funded by National Institutes of Health Grant MH46742 and the Swartz Foundation.
Footnotes
The authors declare no conflict of interest.
This article contains supporting information online at www.pnas.org/lookup/suppl/doi:10.1073/pnas.1309966110/-/DCSupplemental.
References
- 1.Bean BP. The action potential in mammalian central neurons. Nat Rev Neurosci. 2007;8(6):451–465. doi: 10.1038/nrn2148. [DOI] [PubMed] [Google Scholar]
- 2.Coetzee WA, et al. Molecular diversity of K+ channels. Ann N Y Acad Sci. 1999;868:233–285. doi: 10.1111/j.1749-6632.1999.tb11293.x. [DOI] [PubMed] [Google Scholar]
- 3.Herrera-Valdez MA, et al. Relating ion channel expression, bifurcation structure, and diverse firing patterns in a model of an identified motor neuron. J Comput Neurosci. 2012;34(2):211–229. doi: 10.1007/s10827-012-0416-6. [DOI] [PMC free article] [PubMed] [Google Scholar]
- 4.Hille B. Ion Channels of Excitable Membranes. Sunderland, MA: Sinauer; 2001. [Google Scholar]
- 5.Marder E, Goaillard JM. Variability, compensation and homeostasis in neuron and network function. Nat Rev Neurosci. 2006;7(7):563–574. doi: 10.1038/nrn1949. [DOI] [PubMed] [Google Scholar]
- 6.Olypher AV, Calabrese RL. Using constraints on neuronal activity to reveal compensatory changes in neuronal parameters. J Neurophysiol. 2007;98(6):3749–3758. doi: 10.1152/jn.00842.2007. [DOI] [PubMed] [Google Scholar]
- 7.Marder E. Variability, compensation, and modulation in neurons and circuits. Proc Natl Acad Sci USA. 2011;108(Suppl 3):15542–15548. doi: 10.1073/pnas.1010674108. [DOI] [PMC free article] [PubMed] [Google Scholar]
- 8.Marder E, Prinz AA. Modeling stability in neuron and network function: The role of activity in homeostasis. Bioessays. 2002;24(12):1145–1154. doi: 10.1002/bies.10185. [DOI] [PubMed] [Google Scholar]
- 9.O’Leary T, Wyllie DJA. Neuronal homeostasis: time for a change? J Physiol. 2011;589(Pt 20):4811–4826. doi: 10.1113/jphysiol.2011.210179. [DOI] [PMC free article] [PubMed] [Google Scholar]
- 10.Turrigiano G. Homeostatic signaling: The positive side of negative feedback. Curr Opin Neurobiol. 2007;17(3):318–324. doi: 10.1016/j.conb.2007.04.004. [DOI] [PubMed] [Google Scholar]
- 11.Abbott L, LeMasson G. Analysis of neuron models with dynamically regulated conductances. Neural Computation. 1993;5:823–842. [Google Scholar]
- 12.Desai NS, Rutherford LC, Turrigiano GG. Plasticity in the intrinsic excitability of cortical pyramidal neurons. Nat Neurosci. 1999;2(6):515–520. doi: 10.1038/9165. [DOI] [PubMed] [Google Scholar]
- 13.LeMasson G, Marder E, Abbott LF. Activity-dependent regulation of conductances in model neurons. Science. 1993;259(5103):1915–1917. doi: 10.1126/science.8456317. [DOI] [PubMed] [Google Scholar]
- 14.Liu Z, Golowasch J, Marder E, Abbott LF. A model neuron with activity-dependent conductances regulated by multiple calcium sensors. J Neurosci. 1998;18(7):2309–2320. doi: 10.1523/JNEUROSCI.18-07-02309.1998. [DOI] [PMC free article] [PubMed] [Google Scholar]
- 15.O’Leary T, van Rossum MCW, Wyllie DJA. Homeostasis of intrinsic excitability in hippocampal neurones: Dynamics and mechanism of the response to chronic depolarization. J Physiol. 2010;588(Pt 1):157–170. doi: 10.1113/jphysiol.2009.181024. [DOI] [PMC free article] [PubMed] [Google Scholar]
- 16.Ramakers GJ, Corner MA, Habets AM. Development in the absence of spontaneous bioelectric activity results in increased stereotyped burst firing in cultures of dissociated cerebral cortex. Exp Brain Res. 1990;79(1):157–166. doi: 10.1007/BF00228885. [DOI] [PubMed] [Google Scholar]
- 17.Seeburg DP, Sheng M. Activity-induced Polo-like kinase 2 is required for homeostatic plasticity of hippocampal neurons during epileptiform activity. J Neurosci. 2008;28(26):6583–6591. doi: 10.1523/JNEUROSCI.1853-08.2008. [DOI] [PMC free article] [PubMed] [Google Scholar]
- 18.Stemmler M, Koch C. How voltage-dependent conductances can adapt to maximize the information encoded by neuronal firing rate. Nat Neurosci. 1999;2(6):521–527. doi: 10.1038/9173. [DOI] [PubMed] [Google Scholar]
- 19.Triesch J. (2005) A gradient rule for the plasticity of a neuron's intrinsic excitability. Artificial Neural Networks: Biological Inspirations - ICANN 2005 (Conference Proceedings of the International Conference on Artificial Neural Networks, Warsaw, Poland) Proceedings Pt 1(3696):65–70.
- 20.Turrigiano G, Abbott LF, Marder E. Activity-dependent changes in the intrinsic properties of cultured neurons. Science. 1994;264(5161):974–977. doi: 10.1126/science.8178157. [DOI] [PubMed] [Google Scholar]
- 21.van Welie I, van Hooft JA, Wadman WJ. Homeostatic scaling of neuronal excitability by synaptic modulation of somatic hyperpolarization-activated Ih channels. Proc Natl Acad Sci USA. 2004;101(14):5123–5128. doi: 10.1073/pnas.0307711101. [DOI] [PMC free article] [PubMed] [Google Scholar]
- 22.Wierenga CJ, Walsh MF, Turrigiano GG. Temporal regulation of the expression locus of homeostatic plasticity. J Neurophysiol. 2006;96(4):2127–2133. doi: 10.1152/jn.00107.2006. [DOI] [PubMed] [Google Scholar]
- 23.Wheeler DG, et al. Ca(V)1 and Ca(V)2 channels engage distinct modes of Ca(2+) signaling to control CREB-dependent gene expression. Cell. 2012;149(5):1112–1124. doi: 10.1016/j.cell.2012.03.041. [DOI] [PMC free article] [PubMed] [Google Scholar]
- 24.Desarmenien MG, Spitzer NC. Role of calcium and protein kinase C in development of the delayed rectifier potassium current in Xenopus spinal neurons. Neuron. 1991;7(5):797–805. doi: 10.1016/0896-6273(91)90282-5. [DOI] [PubMed] [Google Scholar]
- 25.Pratt KG, Aizenman CD. Homeostatic regulation of intrinsic excitability and synaptic transmission in a developing visual circuit. J Neurosci. 2007;27(31):8268–8277. doi: 10.1523/JNEUROSCI.1738-07.2007. [DOI] [PMC free article] [PubMed] [Google Scholar]
- 26.Tong H, et al. Regulation of Kv channel expression and neuronal excitability in rat medial nucleus of the trapezoid body maintained in organotypic culture. J Physiol. 2010;588(Pt 9):1451–1468. doi: 10.1113/jphysiol.2009.186676. [DOI] [PMC free article] [PubMed] [Google Scholar]
- 27.Mee CJ, Pym EC, Moffat KG, Baines RA. Regulation of neuronal excitability through pumilio-dependent control of a sodium channel gene. J Neurosci. 2004;24(40):8695–8703. doi: 10.1523/JNEUROSCI.2282-04.2004. [DOI] [PMC free article] [PubMed] [Google Scholar]
- 28.Siegel M, Marder E, Abbott LF. Activity-dependent current distributions in model neurons. Proc Natl Acad Sci USA. 1994;91(24):11308–11312. doi: 10.1073/pnas.91.24.11308. [DOI] [PMC free article] [PubMed] [Google Scholar]
- 29.Schulz DJ, Goaillard JM, Marder E. Variable channel expression in identified single and electrically coupled neurons in different animals. Nat Neurosci. 2006;9(3):356–362. doi: 10.1038/nn1639. [DOI] [PubMed] [Google Scholar]
- 30.Schulz DJ, Goaillard JM, Marder EE. Quantitative expression profiling of identified neurons reveals cell-specific constraints on highly variable levels of gene expression. Proc Natl Acad Sci USA. 2007;104(32):13187–13191. doi: 10.1073/pnas.0705827104. [DOI] [PMC free article] [PubMed] [Google Scholar]
- 31.Swensen AM, Bean BP. Robustness of burst firing in dissociated purkinje neurons with acute or long-term reductions in sodium conductance. J Neurosci. 2005;25(14):3509–3520. doi: 10.1523/JNEUROSCI.3929-04.2005. [DOI] [PMC free article] [PubMed] [Google Scholar]
- 32.Temporal S, et al. Neuromodulation independently determines correlated channel expression and conductance levels in motor neurons of the stomatogastric ganglion. J Neurophysiol. 2012;107(2):718–727. doi: 10.1152/jn.00622.2011. [DOI] [PMC free article] [PubMed] [Google Scholar]
- 33.Tobin AE, Cruz-Bermúdez ND, Marder E, Schulz DJ. Correlations in ion channel mRNA in rhythmically active neurons. PLoS ONE. 2009;4(8):e6742. doi: 10.1371/journal.pone.0006742. [DOI] [PMC free article] [PubMed] [Google Scholar]
- 34.Toledo-Rodriguez M, et al. Correlation maps allow neuronal electrical properties to be predicted from single-cell gene expression profiles in rat neocortex. Cereb Cortex. 2004;14(12):1310–1327. doi: 10.1093/cercor/bhh092. [DOI] [PubMed] [Google Scholar]
- 35.Liss B, et al. Tuning pacemaker frequency of individual dopaminergic neurons by Kv4.3L and KChip3.1 transcription. EMBO J. 2001;20(20):5715–5724. doi: 10.1093/emboj/20.20.5715. [DOI] [PMC free article] [PubMed] [Google Scholar]
- 36.Veys K, Labro AJ, De Schutter E, Snyders DJ. Quantitative single-cell ion-channel gene expression profiling through an improved qRT-PCR technique combined with whole cell patch clamp. J Neurosci Methods. 2012;209(1):227–234. doi: 10.1016/j.jneumeth.2012.06.008. [DOI] [PubMed] [Google Scholar]
- 37.Taylor AL, Goaillard JM, Marder E. How multiple conductances determine electrophysiological properties in a multicompartment model. J Neurosci. 2009;29(17):5573–5586. doi: 10.1523/JNEUROSCI.4438-08.2009. [DOI] [PMC free article] [PubMed] [Google Scholar]
- 38.Soto-Treviño C, Thoroughman KA, Marder E, Abbott LF. Activity-dependent modification of inhibitory synapses in models of rhythmic neural networks. Nat Neurosci. 2001;4(3):297–303. doi: 10.1038/85147. [DOI] [PubMed] [Google Scholar]
- 39.Davis GW. Homeostatic control of neural activity: From phenomenology to molecular design. Annu Rev Neurosci. 2006;29:307–323. doi: 10.1146/annurev.neuro.28.061604.135751. [DOI] [PubMed] [Google Scholar]
- 40.Desai NS. Homeostatic plasticity in the CNS: Synaptic and intrinsic forms. J Physiol Paris. 2003;97(4-6):391–402. doi: 10.1016/j.jphysparis.2004.01.005. [DOI] [PubMed] [Google Scholar]
- 41.Turrigiano GG. Homeostatic plasticity in neuronal networks: The more things change, the more they stay the same. Trends Neurosci. 1999;22(5):221–227. doi: 10.1016/s0166-2236(98)01341-1. [DOI] [PubMed] [Google Scholar]
- 42.Alon U. An Introduction to Systems Biology: Design Principles of Biological Circuits. Boca Raton, FL: Chapman & Hall/CRC; 2007. [Google Scholar]
- 43.Turrigiano GG, Nelson SB. Homeostatic plasticity in the developing nervous system. Nat Rev Neurosci. 2004;5(2):97–107. doi: 10.1038/nrn1327. [DOI] [PubMed] [Google Scholar]
- 44.Aizenman CD, Huang EJ, Linden DJ. Morphological correlates of intrinsic electrical excitability in neurons of the deep cerebellar nuclei. J Neurophysiol. 2003;89(4):1738–1747. doi: 10.1152/jn.01043.2002. [DOI] [PubMed] [Google Scholar]
- 45.Prinz AA, Billimoria CP, Marder E. Alternative to hand-tuning conductance-based models: Construction and analysis of databases of model neurons. J Neurophysiol. 2003;90(6):3998–4015. doi: 10.1152/jn.00641.2003. [DOI] [PubMed] [Google Scholar]
- 46.Prinz AA, Bucher D, Marder E. Similar network activity from disparate circuit parameters. Nat Neurosci. 2004;7(12):1345–1352. doi: 10.1038/nn1352. [DOI] [PubMed] [Google Scholar]
- 47.Taylor AL, Hickey TJ, Prinz AA, Marder E. Structure and visualization of high-dimensional conductance spaces. J Neurophysiol. 2006;96(2):891–905. doi: 10.1152/jn.00367.2006. [DOI] [PubMed] [Google Scholar]
- 48.Spitzer NC. A developmental handshake: Neuronal control of ionic currents and their control of neuronal differentiation. J Neurobiol. 1991;22(7):659–673. doi: 10.1002/neu.480220702. [DOI] [PubMed] [Google Scholar]
- 49.Weston AJ, Baines RA. Translational regulation of neuronal electrical properties. Invert Neurosci. 2007;7(2):75–86. doi: 10.1007/s10158-006-0037-8. [DOI] [PubMed] [Google Scholar]
- 50.Grubb MS, Burrone J. Activity-dependent relocation of the axon initial segment fine-tunes neuronal excitability. Nature. 2010;465(7301):1070–1074. doi: 10.1038/nature09160. [DOI] [PMC free article] [PubMed] [Google Scholar]
- 51.Edelman GM, Gally JA. Degeneracy and complexity in biological systems. Proc Natl Acad Sci USA. 2001;98(24):13763–13768. doi: 10.1073/pnas.231499798. [DOI] [PMC free article] [PubMed] [Google Scholar]
- 52.Tononi G, Sporns O, Edelman GM. Measures of degeneracy and redundancy in biological networks. Proc Natl Acad Sci USA. 1999;96(6):3257–3262. doi: 10.1073/pnas.96.6.3257. [DOI] [PMC free article] [PubMed] [Google Scholar]
- 53.Goldman MS, Golowasch J, Marder E, Abbott LF. Global structure, robustness, and modulation of neuronal models. J Neurosci. 2001;21(14):5229–5238. doi: 10.1523/JNEUROSCI.21-14-05229.2001. [DOI] [PMC free article] [PubMed] [Google Scholar]
- 54.Hudson AE, Prinz AA. Conductance ratios and cellular identity. PLOS Comput Biol. 2010;6(7):e1000838. doi: 10.1371/journal.pcbi.1000838. [DOI] [PMC free article] [PubMed] [Google Scholar]
- 55.Khazen G, Hill SL, Schürmann F, Markram H. Combinatorial expression rules of ion channel genes in juvenile rat (Rattus norvegicus) neocortical neurons. PLoS ONE. 2012;7(4):e34786. doi: 10.1371/journal.pone.0034786. [DOI] [PMC free article] [PubMed] [Google Scholar]
- 56.Kim TK, et al. Widespread transcription at neuronal activity-regulated enhancers. Nature. 2010;465(7295):182–187. doi: 10.1038/nature09033. [DOI] [PMC free article] [PubMed] [Google Scholar]
- 57.Amendola J, Woodhouse A, Martin-Eauclaire MF, Goaillard JM. Ca²⁺/cAMP-sensitive covariation of I(A) and I(H) voltage dependences tunes rebound firing in dopaminergic neurons. J Neurosci. 2012;32(6):2166–2181. doi: 10.1523/JNEUROSCI.5297-11.2012. [DOI] [PMC free article] [PubMed] [Google Scholar]
- 58.Guckenheimer J, Holmes P. Nonlinear Oscillations, Dynamical Systems, and Bifurcations of Vector Fields. New York: Springer; 1983. [Google Scholar]
Associated Data
This section collects any data citations, data availability statements, or supplementary materials included in this article.