

Abstract
Although atomic resolution 3D structures of protein native states and some folding intermediates are available, the mechanism of interconversion between such states remains poorly understood. Here we study the four-helix bundle FF module, which folds via a transiently formed and sparsely populated compact on-pathway intermediate, I. Relaxation dispersion NMR spectroscopy has previously been used to elucidate the 3D structure of this intermediate and to establish that the conformational exchange between the I and the native, N, states of the FF domain is driven predominantly by water dynamics. In the present study we use NMR methods to define a length scale for the FF I–N transition, namely the effective hydrodynamic radius (EHR) that provides an average measure of the size of the structural units participating in the transition at any given time. Our experiments establish that the EHR is less than 4 Å, on the order of the size of one to two amino acid side chains, much smaller than the FF domain hydrodynamic radius (13 Å). The small magnitude of the EHR provides strong evidence that the I–N interconversion does not proceed via the synchronous motion of large clusters of amino acid residues, but rather by the exposure/burial of one or two side chains from solvent at any given time. Because the hydration of small hydrophobic solutes (< 4 Å) does not involve considerable dewetting or disruption of the water–hydrogen bonding network, the FF domain I–N transition does not require appreciable changes to the structure of the surrounding water.
Keywords: excited protein states, hydrophobic hydration, CPMG NMR, protein folding
Proteins are inherently dynamic molecules that undergo conformational exchange over a wide range of timescales in solution. Exchange events occurring on the microsecond–second timescale are often relevant for protein folding, a process that has been successfully modeled as a diffusive search occurring on a low-dimensional free-energy surface. Such a reduced dimensional analysis of experimental data is attractive because it provides a framework by which a complex problem can be made tractable, in this case facilitating an understanding of the folding event in terms of the thermodynamics and kinetics that are involved in the process (Fig. 1).
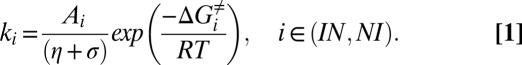
Fig. 1.

Schematic representation of the reduced dimensional conformational free-energy landscape for the FF I–N transition. The 3D structures of the I [PDB ID code 2KZG (2)] and N [PDB ID code 1UZC (54)] states are shown above their respective free-energy minima. A few hydrophobic side chains (I43, L52, L55, and F62) that reorganize during the I–N transition are shown as sticks. The I–N interconversion can be described by the diffusion of a “virtual” particle (blue) on the conformational free-energy landscape that governs the folding process, with an EHR whose determination is the subject of the work described here.
Additional information can also be obtained in the form of the structures that populate the protein’s free-energy landscape. Here, relaxation dispersion (RD) NMR spectroscopy (1) has emerged as a valuable tool for determining the structures of transiently formed, sparsely populated protein conformations (referred to as I in what follows) (2–4) that are in equilibrium with the native state (N). These rare states are otherwise invisible to traditional biophysical methods and they do not give rise to cross-peaks in NMR spectra. Nevertheless, their presence can be detected because conformational fluctuations occurring on the millisecond timescale between states N and I lead to a stochastic modulation of NMR chemical shifts of probe nuclei, thereby broadening resonances in NMR spectra of the native conformer (5). The magnitude of exchange broadening can be systematically modulated using a Carr–Purcell–Meiboom–Gill (CPMG) spin relaxation experiment, which consists of a series of chemical shift refocusing pulses applied at varying rates, νCPMG (5). The resulting RD profile (Fig. 2) for a given nucleus is a graph of its transverse relaxation rate, R2,eff (effectively peak linewidth), as a function of νCPMG. The profile can be fit to a model of chemical exchange to yield the populations of the states, the rates of interconversion, and the differences in chemical shifts at that site in each of the interconverting states (5). Recently, atomic resolution structures of a number of transiently formed, invisible intermediates have been determined (2–4, 6, 7) by using chemical shifts of the I state obtained from RD NMR as input into database-driven structure-prediction algorithms (8, 9).
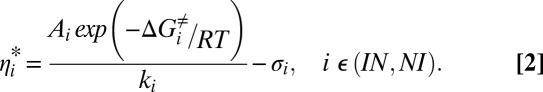
Fig. 2.

CPMG RD profiles for the backbone 15N nuclei of Tyr-49 and Lys-59 of the FF domain, 18.8 T, 25 °C without and with (A and C) 20% (vol/vol) glycerol or (B and D) 200 mg/mL BSA. Errors in the data points are shown by the vertical bars and were estimated by acquiring two to four repeat points. Solid lines correspond to fits of data from all residues simultaneously to a two-state exchange model.
Conformational exchange in the four-helix bundle FF domain from human HYPA/FBP11 has been extensively characterized by RD NMR spectroscopy (2, 7, 10–12). At 25 °C, FF interconverts between its native state (N) and a compact on-pathway folding intermediate (I), populated to 1%, with an exchange rate constant kex (= kIN + kNI) of 1,940 s−1 (Fig. 1) (12). The I-state 3D structure has been elucidated (2) and cross-validated (13), establishing several nonnative structural features. Most notable is that helix 3 (H3) is significantly longer in I than in N, extending to where H4 begins in the native state. This lengthening results in the formation of nonnative hydrophobic contacts at the interface between helices H2 and H3. In contrast to H3, however, H4 is unstructured in the intermediate state. The transition from I to N must, therefore, involve the unraveling of H3 and the formation of H4, as well as the disruption of nonnative hydrophobic interactions. Although atomic resolution 3D structures of the endpoints (I and N in the case of the FF domain) are now available, a description of how structure evolves during the interconversion is still notably lacking.
Some insight can be obtained from a number of theoretical (14, 15) studies in which helix–coil transitions are predicted to be cooperative, but not entirely two-state. Additionally, experimental studies focusing on hydrogen–deuterium exchange using either NMR (16–19) or mass spectrometry (20, 21) provide a further basis for understanding the mechanism of helix folding/unfolding both in the context of peptides and proteins. The denaturant dependence of exchange rates establishes that some protons exchange only upon global unfolding of the entire protein, whereas others exchange as parts of subglobal cooperative secondary structural units called “foldons” (22) that can be tens of amino acids in size. However, other protons, in particular those at the termini of helices, exchange by local dynamic fraying (18, 23) involving breaking one or a few hydrogen bonds at a time. The existence of foldons leads to the creation of partially unfolded forms along a folding pathway, similar to what has been observed for the WT FF domain studied here (22). However, the mechanism by which the WT FF domain transitions from the I to the N state along its folding trajectory remains to be determined. For example, does this interconversion involve the simultaneous rearrangement of foldons with length scales on the order of tens of angstroms, or is it a more localized process, like the dynamic fraying of helices characterized previously (18, 23)? Herein we probe the size of the elements that are involved in the elementary steps along the FF domain I–N reaction coordinate using a combined RD and pulsed field gradient (PFG) diffusion NMR study.
In a previous report we determined that the energy driving the interconversion between I and N states of the FF domain originates primarily from water fluctuations (12). This was established by measuring the viscosity dependencies of rates of exchange, kIN and kNI, in viscogens glycerol and BSA that were then modeled using a modified Kramers equation (24–26) for the rate of a reaction in the high friction limit:
 |
In Eq. 1, Ai is given by a product of terms that reflect the curvatures of the free-energy surface at the initial state and the barrier, assumed to be independent of viscosity and temperature, ΔGi≠ is the difference in free energy between the initial state and the barrier, and η and σ are the contributions to the overall viscosity for motion along the free-energy landscape that derive from solvent (η) or that are solvent-independent (σ), respectively. The internal friction for the I–N transition was found to be small (σ ∼ 0.2 cP) in relation to contributions from solvent (η = 0.89 cP) (12).
Once the values of Aiexp(−ΔGi≠/RT) and σ have been determined from a viscosity dependence study of rates, Eq. 1 can be used to estimate the “average” solvent viscosity along the landscape for a reaction that occurs in a particular viscogen. The measured viscosity, in turn, can be related to a length scale or the “size” of changes that occur as the reaction proceeds along its trajectory. The inherent relation between microscopic solution viscosity and size can be appreciated in simpler terms by considering a probe molecule as it diffuses in a water–viscogen mixture. Here, the diffusion rate depends on the relative sizes of the probe and the viscogen. For example, addition of 30% (wt/wt) PEG to water decreases the diffusion coefficient of water (hydrodynamic radius, RH = 1.4 Å) by a factor of 1.5, whereas the diffusion coefficient of the dye carboxytetramethylrhodamine (RH ∼6.5 Å) decreases by a much larger factor, 4 (27). Once the probe molecule reaches the approximate size of the viscogen, the apparent viscosity is no longer size-dependent (28). Analogously, conformational exchange occurring in the diffusive limit on a reduced dimensional landscape can be formulated in terms of a particle with an effective hydrodynamic radius (EHR) diffusing between each of the states along the reaction coordinate (29). Hence the dependence of reaction rate on viscogen size can be used to estimate the EHR of the particle. However, most viscogens are unsuitable for studies of the kinetics of the FF I–N interconversion because they interact with the protein, altering the relative populations of the interconverting states (12). In the present study we have circumvented this problem by choosing a large, inert viscogen (BSA) and an array of probes with varying RH to construct a molecular ruler, which is a relationship between η and probe RH.
Using this molecular ruler relating η and RH, and I–N exchange rates measured in 200 mg/mL BSA by RD NMR, an upper bound of 4 Å is obtained for the EHR of the I–N transition, which is on the order of the size of one amino acid and much smaller than the FF domain hydrodynamic radius (13 Å). The EHR provides an estimate of the average size of the structural moieties that are actively diffusing in and out of solvent during the conformational rearrangement. Further, the EHR can be interpreted as a measure of the coupling between the solvent and the I–N fluctuations and it is related to the extent of exchange of energy with the solvent that occurs along the reaction (30, 31). The obtained EHR establishes that the transition from I to N proceeds via a series of small steps, involving one or two amino acid side chains on average, rather than a set of more concerted conformational changes involving larger clusters of the protein chain.
Results
Constructing a Molecular Ruler Based on PFG NMR Diffusion Measurements.
The effective viscosity reported by a probe molecule while diffusing in a solution to which a viscogen has been added (η*) depends on the relative hydrodynamic radii of the viscogen and the probe (RH,probe/RH,visc) (27, 28). In the event that RH,probe/RH,visc ≥ 1, the probe senses a viscosity that is independent of its size, corresponding to the macroscopic solution viscosity (η* = ηmacro). However, if RH,probe/RH,visc < 1, the effective viscosity is reduced from ηmacro, referred to as “microviscosity,” and is dependent upon the exact value of RH,probe/RH,visc. This size dependence of the effective viscosity has been documented for several viscogen molecules including proteins and polymers (27, 28, 31–33). Here, we exploit the dependence of η* on RH to construct a “molecular ruler” using the viscogen BSA (200 mg/mL), which is a graph of η* as a function of the probe hydrodynamic radius in the water–BSA solution.
To construct this molecular ruler the diffusion coefficients of 11 probe molecules (Table S1) of different sizes have been measured in acetate buffer, Dprobe,buff, using PFG NMR spectroscopy (34) (Fig. 3). The hydrodynamic radius of each probe was calculated from the ratio of its diffusion constant to that of dioxane (RH = 2.12 Å) (35) (Materials and Methods). The measured hydrodynamic radii of the chosen probe molecules vary from 1.1 to 13.0 Å and match well with experimental data where available (Table S1). Acetate diffusion constants measured over all 11 samples have a SD of 2.5% about the mean with a maximum deviation from the mean of 4.7%, clearly showing that none of the probe molecules measurably affects the viscosity of the solution at the concentrations used.
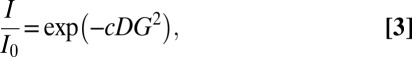
Fig. 3.

Intensity profiles in PFG NMR diffusion spectra as a function of the square of the gradient strength in the absence (red) and presence (blue) of 200 mg/mL BSA for (A) dioxane, (B) glycerol, (C) sucrose, and (D) FF domain. The intensities are normalized to the value at the first gradient strength (I0). Errors in the data were estimated by acquiring duplicate points at selected gradient strengths and are generally smaller than the circles representing the data. Solid lines are fits of the data points to a single exponential decay (Eq. 3). A wider range of gradient strengths was used for the FF domain, reflecting its larger size and hence slower diffusion rate than that of the other probe molecules.
Diffusion constants were also measured for the probes in buffer solution containing 200 mg/mL BSA, Dprobe,BSA (Fig. 3). The ratio Dprobe,buff/Dprobe,BSA provides a direct measure of ηprobe*/ηbuff, the ratio of effective viscosities for each probe in solutions with and without BSA (Materials and Methods). As in the buffer samples, the diffusion constants of acetate in all BSA samples were identical to within measurement error, with a SD of 1.3% and a maximum deviation from the mean of 2.7%, confirming that all of the samples contained virtually the same concentration of BSA (∼200 mg/mL).
Fig. 4 plots ηprobe*/ηbuff as a function of RH, showing a monotonic increase as RH increases. The graph provides a molecular ruler in the sense that once the effective viscosity during translation of a probe in 200 mg/mL BSA is known its hydrodynamic radius can be calculated. The minimum size that can be measured with this ruler is about 2 Å, because the effective viscosity probed by smaller-sized particles in aqueous buffer is essentially that of water.
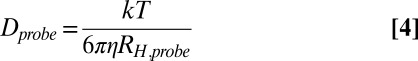
Fig. 4.

A molecular ruler for measuring the EHR of the I–N interconversion. Values of ηprobe*/ηbuff are plotted as a function of RH, as described in the text. The value of ηex,FF*/ηbuff = 1.24 ± 0.10, as determined by analysis of RD data and calculated using Eq. 2, is indicated by the red arrow and the associated error (±1 SD from the mean) is depicted as a gray bar. The solid black line is intended only to guide the eye and does not have any physical significance. All ηprobe* and ηex,FF* values are based on measurements obtained using 200 mg/mL BSA as a viscogen.
Determining the EHR of the FF Domain I–N Conformational Exchange Process.
Rate constants measured for folding/unfolding reactions are typically interpreted within the context of the high-friction regime of the Kramers rate theory involving diffusive barrier-crossing events on a conformational free-energy landscape (36, 37). The contribution from solvent to the viscosity experienced by an effective particle diffusing on the conformational surface is given by rearranging Eq. 1:
 |
In what follows we have used Eq. 2 to estimate the effective solvent viscosity along the FF domain I–N transition using BSA as a viscogen at a concentration of 200 mg/mL. Values of σi and the product Ai exp(−ΔGi≠/RT) have been obtained from an independent set of measurements of kIN and kNI as a function of viscosity using a separate viscogen, glycerol (σIN = 0.24 ± 0.06 cP, σNI = 0.17 ± 0.10 cP), as described previously (12), with the viscosity of the buffer in the absence of viscogen calculated as the concentration-weighted average of the viscosities of H2O [90% (vol/vol)] and D2O [10% (vol/vol)] (ηbuff = 0.89 cP).
Values of kIN and kNI for the I–N FF domain transition in 200 mg/mL BSA have been measured via RD NMR (Fig. 2) from which ηIN*/ηbuff = 1.26 ± 0.11 cP and ηNI*/ηbuff = 1.22 ± 0.16 cP are calculated. As expected on the basis of microscopic reversibility ηNI* and ηIN* are identical to within measurement error and we have used an average value, ηex,FF*/ηbuff = 1.24 ± 0.10, to determine the EHR for the I–N conformational transition. In Fig. 4 the range of ηex,FF*/ηbuff values for the FF domain (1 SD) is plotted in gray on the molecular ruler that was determined as described above. An upper limit for the EHR of ∼4 Å (the size of sucrose) is thus obtained.
The Amplitude of Local Picosecond–Nanosecond Timescale Motion Represents a Lower Bound to the EHR.
The above procedure only provides an upper limit estimate for the EHR because of the error in ηex,FF* (gray region in Fig. 4). Even if an error-free value of ηex,FF* could be obtained there would still be uncertainty in the EHR because the molecular ruler that has been constructed using BSA as a viscogen is rather insensitive to RH for values less than ∼4 Å. Further, the smallest probe that can be used to construct the ruler is water, so the scale in Fig. 4 can only extend from ∼1 Å (radius of water).
Insight into what the lower bound for the EHR might be can be obtained from studies probing the relation between picosecond–nanosecond (ps–ns) motions of protein side chains and the overall solvent viscosity. Here, the motions considered are those involving only small displacements that are limited in general by structural constraints. Molecular dynamics simulations of the protein factor Xa show that the distribution of correlation times of bond vector fluctuations changes little even as the solvent viscosity is increased 10-fold (38). In addition, 2D IR studies of a carbonyl vibrational probe attached to lysozyme establish that a 100-fold increase in bulk solution viscosity is accompanied by only a threefold increase in protein dynamics (39). NMR spin relaxation experiments focusing on the amplitudes and timescales of methyl-containing side-chain dynamics in an SH3 domain show little change upon addition of ∼25% (vol/vol) glycerol (40). To supplement these results with further experiments on an additional protein system we have carried out measurements of ps–ns side-chain dynamics in the small protein ubiquitin. We chose ubiquitin rather than the FF domain, which is the focus of the present work, because the pervasive chemical exchange contributions to linewidths of cross-peaks in spectra of the FF domain can complicate the extraction of robust measures of ps–ns motions. In addition, previous detailed NMR relaxation studies have shown that the rotational diffusion of ubiquitin is essentially isotropic (41), simplifying data analysis. A comparison of ps–ns dynamics in aqueous and 25% (vol/vol) glycerol buffers shows that the motion is slowed down by a factor of 1.3 despite the 2.5-fold increase in solvent viscosity (Fig. S1 and SI Text). Taken together, these studies indicate that small-amplitude, rapid side-chain fluctuations occurring in the protein hydration layer are relatively insensitive to increases in bulk solution viscosity. By contrast, we have demonstrated that kIN and kNI for the FF domain I–N interconversion scale essentially inversely with viscosity when the solvent glycerol is used. FF domain folding must, therefore, involve side-chain rearrangements of a length scale that is significantly larger than displacements resulting from ps–ns side-chain dynamics within the protein hydration layer. Thus, the amplitudes spanned by local side-chain motion provide a lower bound for the EHR of the FF domain I to N conformational exchange.
Discussion
We have established an effective length scale or EHR of less than 4 Å for the FF domain conformational exchange process. The method we use for determining the EHR is general and can be applied to any conformational exchange process that can be studied in the presence of a large viscogen. It is, however, predicated upon two assumptions. First, we assume that both glycerol and BSA are “true” viscogens in the sense that they add ruggedness to the FF conformational free-energy surface without perturbing the landscape. This is supported by the fact that the population of the invisible intermediate state remains unchanged in either viscogen, as established by RD NMR measurements probing the I–N conformational exchange process (12). In addition, backbone 15N chemical shifts of both the ground and the excited states change very little in 200 mg/mL BSA or 25% (vol/vol) glycerol, providing strong evidence that the structures of both states in either viscogen are unchanged (12). Second, our analysis makes the analogy between translational diffusion in 3D space and diffusion along the reduced dimensional landscape in the presence of a potential. In this context we assume that the size dependence of the effective viscosity for diffusing on the conformational landscape is identical to that for translational diffusion (Fig. 4). There are compelling justifications for making this assumption. Computer simulations (36, 42) and experiments (29, 37) have confirmed that protein conformational exchange occurs in the Kramers theory high-friction regime. Thus, both translation and conformational exchange are described by the Smoluchowski equation either without or with an external potential (43). Further, the mechanism of exchange of momentum and kinetic energy between the solvent and the particle for both processes is viscosity-dependent and occurs through collisions with the solvent, given that the FF domain conformational exchange is driven primarily by solvent motion (12). We note that measuring kIN and kNI as a function of viscosity for viscogens of increasing size would be an alternative method of measuring an EHR (31). In the case of the FF domain, however, such measurements are not possible because many viscogens such as ethylene glycol, glucose, sucrose, and trehalose alter the relative stabilities of I and N and thus perturb the free-energy landscape (12).
It is worth emphasizing that we have modeled the relaxation dispersion data probing the WT FF I–N transition as a two-state process to extract viscosity-dependent values of kIN and kNI. A detailed analysis (presented in SI Text and Figs. S2–S7) establishes that the dispersion data can be well explained by a two-site exchange model and that more complex models are not needed. However, we cannot rule out the existence of states at very low fractional populations (less than a few tenths of a percent) that are in fast exchange with I or N. Indeed, the picture that emerges of the I–N interconversion is one involving elementary steps that expose approximately one residue at a time to solvent, suggesting that there are many transiently formed and very sparsely populated microscopic states in solution. We have attempted to evaluate how the presence of these additional conformers might influence the results of the present work by modeling three-site exchange processes, as described in SI Text. For the simulations considered the main result of the present study remains unchanged, namely that the I–N transition can be described using an EHR of <4 Å.
An EHR <4 Å is comparable to the hydrodynamic radius of one amino acid (RH for Trp is 3.5 Å). Thus, whereas our results are consistent with a cooperative I–N transition for the FF domain interconversion, the small EHR value shows that FF domain folding must proceed at the microscopic level via a conformational search involving the diffusion of one or two protein side-chains in and out of bulk solvent at a given time. This is in contrast to a concerted motion of large structural elements that can be up to tens of amino acids in size. The measured EHR is significantly smaller than the length of an average foldon (22) but is consistent with the length scales observed for end fraying in peptide (18) and protein helices (23).
Because the EHR has been determined from rate constants extracted from fits of RD NMR measurements, this value is an average over multiple barrier crossings. Our results do not preclude variation of the EHR with instantaneous position on the reaction coordinate. Moreover, the generality of the <4 Å length scale for protein conformational exchange reported here remains to be tested. Mukherjee et al. (33) have measured the rates of the helix-to-coil transition for two small helix-forming peptides in solutions containing either of the crowding agents Dextran 70 or Ficoll 70 using fluorescence correlation spectroscopy. They find that the folding lifetimes of these peptides increase by only 20–60% compared with their values in buffer without viscogen, whereas the macroscopic viscosity increases by 10- to 20-fold. The authors note that the polymeric crowding agents used in the study can form porous networks with the effective viscosity highly dependent on the probe size (28), as observed using BSA as a viscogen in our study (Fig. 4). Thus, the small dependence on viscosity reflects the small length scale over which changes take place during the helix–coil transition, far less than the pore sizes in the viscogen polymers. Although the EHR could not be determined from that study, the value of <4Å reported here for a protein domain, involving changes in tertiary interactions, is consistent with the small viscosity dependence noted for the helical peptides in the previous work.
Zwanzig and Harrison (30) have suggested that the EHR of a particle diffusing in solution represents the magnitude of its coupling to solvent. In the reduced dimensional picture of conformational exchange, an effective particle diffuses along a free-energy surface that is modulated by implicit solvent (and protein) degrees of freedom that do not feature in the reaction coordinate. The particle exchanges kinetic energy and momentum with the solvent, providing the driving force for transitioning the activation free-energy barrier. Following the analogy from translational diffusion, the EHR for the FF domain conformational exchange process can be interpreted as the extent of coupling between residues of the FF domain that become accessible during the exchange process and the solvent, defining the scattering cross-section (44) for momentum transfer during a collision between these residues and the solvent molecules. In the case of the FF domain the EHR for the I–N interconversion is at least threefold smaller than the EHR of the domain itself and the scattering cross-section is smaller by an order of magnitude. Thus, momentum is dissipated much less efficiently during the I–N folding reaction than for the diffusing FF module.
The I–N fluctuations for the FF domain, and indeed most folding/unfolding transitions, involve changes in the exposure of hydrophobic residues to water. For example, the conformationally exchanging H3–H4 region (Fig. 1) includes several hydrophobic residues (2 Leu, 4 Ala, 2 Tyr, 1 Val, and 1 Phe) as well as amino acids such as Lys (4) and Arg (1) with long hydrophobic side chains. Interestingly, Φ value analysis of the rate-limiting transition state for folding has established that residues such as Y49, A51, and L52, which form part of helix H3 in I, have low-intermediate Φ values (<0.5) and are thus unstructured in the transition state ensemble (45). It is clear that these residues must, therefore, rearrange as I proceeds to the transition state, with nonnative-like contacts removed (2) and then reorganize further after the transition state to form the native conformation.
The molecular mechanism of solvation of small hydrophobic solutes (<4 Å), or 1- to 2-aa side chains in the case of the FF domain I–N transition, is very different from the solvation of larger nanometer-scale hydrophobic assemblies (46). Water retains its hydrogen-bonding structure around cavities created by small solutes, whereas large solutes disrupt the hydrogen-bonding network (47). Large hydrophobic solutes are thus drier than small ones and have a significantly lower density of water surrounding them (47). The small EHR for the I–N conformational rearrangement studied here indicates that changes in hydrophobic solvation involving only a very small number of side chains will not appreciably disrupt the water hydrogen-bonding network. Exposure of a large hydrophobic cluster to water during the I–N interconversion seems to be avoided by allowing the reaction to proceed in small (<4 Å) steps. Thus, depending on the nature of the conformational exchange process, it may be more appropriate to think about hydrophobic contributions from the standpoint of a small hydrophobic solute rather than from the point of view of a nanometer-sized protein.
Finally, our results may have implications for understanding conformational rearrangements of proteins in the cell where the environment is a crowded and heterogeneous mixture of solutes of varying sizes. For processes involving a small EHR, such as a helix folding/unfolding transition, it is likely that large-molecule viscogens such as proteins, which do not effectively couple to the exchange reaction, will not significantly affect the rates of conformational interconversion.
Concluding Remarks
We have used NMR spectroscopy to determine the EHR for a conformational exchange process in which the native state of the four-helix-bundle FF domain interconverts with a compact on-pathway folding intermediate. The EHR defines a length scale for diffusive barrier crossing between the two states. The EHR for the I–N transition is small (<4 Å) compared with the protein hydrodynamic radius (13 Å), establishing that the exchange process occurs via the exposure of one or two amino acid side chains at a time. Because the hydration of small hydrophobic side chains does not involve considerable dewetting, conformational exchange between compact protein states may proceed without significantly affecting the surrounding water structure.
Materials and Methods
Sample Preparation for NMR Spectroscopy.
15N-labeled WT FF domain was overexpressed in Escherichia coli and purified as described in detail previously (10). Samples for NMR were prepared in 50 mM sodium acetate, 100 mM NaCl, 1 mM EDTA, 1 mM sodium azide (pH 5.7), and 90% H2O/10% 2H2O.
All probe molecules listed in Fig. 4 were purchased from Sigma-Aldrich with the exception of H13 DNA [d(5′-CGCGTTGTTCGCG-3′)] (48) that was custom-synthesized and HPLC-purified from IDT Inc. and the FF domain that was produced in-house. The concentration of all probe molecules was 10 mM except H13 and the FF domain, which were prepared at concentrations of 400 μM and 1 mM, respectively. For BSA-containing samples, lyophilized BSA powder was dissolved in 50 mM sodium acetate, 100 mM NaCl, 1 mM EDTA, 1mM NaN3, and 10% D2O/90% H2O (vol/vol) (pH 5.7) buffer to a concentration of 200 mg/mL and subsequently dialyzed against the same buffer containing the probe molecule. Raffinose, stachyose, and H13 powders were dissolved directly in 200 mg/mL BSA after dialysis of the BSA sample against buffer. The FF sample was made by dialyzing a solution of 200 mg/mL BSA containing 1 mM 15N-labeled FF domain against buffer.
NMR Spectroscopy and Data Analysis.
15N relaxation dispersion data were acquired on Varian Inova spectrometers operating at magnetic field strengths of 11.7 T and 18.8 T, 25 °C, equipped with standard triple resonance gradient probes, as described previously (12). PFG diffusion experiments were recorded at 11.7 T, 25 °C. Datasets were processed using NMRpipe (49) and visualized using NMRDraw (49) and Sparky (50). Peak intensities were quantified using NMRPipe (1D diffusion spectra) or FUDA (http://pound.med.utoronto.ca/software.html; RD and 2D diffusion spectra).
Diffusion coefficients of all probe molecules except the FF domain were measured using a modified water-suppressed longitudinal encode–decode pulse sequence (51). In the case of the FF domain, a 15N-edited 2D diffusion pulse scheme was used (52). Diffusion spectra of each probe sample in the absence of BSA were acquired as a function of gradient strength using a diffusion delay of 100 ms and a decoding/recoding gradient duration of 1 ms. Gradient strengths were calibrated by measuring the diffusion coefficient of the residual HDO in a D2O sample, using the known diffusion coefficient of 1.9 × 10⁻⁵ cm2/s for HDO at 25 °C (53).
The signal intensity (I) in a PFG diffusion experiment depends on the gradient strength (G) and the diffusion coefficient (D) of the probe molecule as
 |
where c is a constant that includes the gradient duration and the diffusion delay (34). The variation in I with the square of the gradient strength was fit to a single exponential decay equation to extract a decay constant (d = c*D) (Fig. 3 and Fig. S8) that was subsequently converted to a hydrodynamic radius (RH) using the Stokes–Einstein equation and assuming the hydrodynamic radius of dioxane to be 2.12 Å (Table S1):
 |
 |
The increase in effective viscosity (ηprobe*) resulting from addition of BSA, normalized to the viscosity in the absence of viscogen, as reported for a given probe was extracted from
 |
where dprobe,BSA and dprobe,buff are the diffusion decay rates measured in the presence and absence of BSA, respectively. Further details are given in Supporting Information.
Supplementary Material
Acknowledgments
We thank Prof. Julie Forman-Kay (Hospital for Sick Children) for providing laboratory facilities for protein purification and for useful discussions, Prof. Dmitry Korzhnev (University of Connecticut) for providing the DASHA program, and Dr. Ranjith Muhandiram (University of Toronto) for assistance with setting up NMR experiments. P.V. thanks Dr. V. Krishna for useful discussions. A.S. thanks Dr. Jayashree Nagesh (University of Toronto) for stimulating discussions, and is a recipient of a Canadian Institutes of Health Research (CIHR) postdoctoral fellowship. L.E.K. holds a Canada Research Chair in Biochemistry. This work was funded through a CIHR research grant to L.E.K.
Footnotes
The authors declare no conflict of interest.
This article is a PNAS Direct Submission.
This article contains supporting information online at www.pnas.org/lookup/suppl/doi:10.1073/pnas.1303273110/-/DCSupplemental.
References
- 1.Baldwin AJ, Kay LE. NMR spectroscopy brings invisible protein states into focus. Nat Chem Biol. 2009;5(11):808–814. doi: 10.1038/nchembio.238. [DOI] [PubMed] [Google Scholar]
- 2.Korzhnev DM, Religa TL, Banachewicz W, Fersht AR, Kay LE. A transient and low-populated protein-folding intermediate at atomic resolution. Science. 2010;329(5997):1312–1316. doi: 10.1126/science.1191723. [DOI] [PubMed] [Google Scholar]
- 3.Neudecker P, et al. Structure of an intermediate state in protein folding and aggregation. Science. 2012;336(6079):362–366. doi: 10.1126/science.1214203. [DOI] [PubMed] [Google Scholar]
- 4.Bouvignies G, et al. Solution structure of a minor and transiently formed state of a T4 lysozyme mutant. Nature. 2011;477(7362):111–114. doi: 10.1038/nature10349. [DOI] [PMC free article] [PubMed] [Google Scholar]
- 5.Palmer AG, 3rd, Kroenke CD, Loria JP. Nuclear magnetic resonance methods for quantifying microsecond-to-millisecond motions in biological macromolecules. Methods Enzymol. 2001;339:204–238. doi: 10.1016/s0076-6879(01)39315-1. [DOI] [PubMed] [Google Scholar]
- 6.Vallurupalli P, Hansen DF, Kay LE. Structures of invisible, excited protein states by relaxation dispersion NMR spectroscopy. Proc Natl Acad Sci USA. 2008;105(33):11766–11771. doi: 10.1073/pnas.0804221105. [DOI] [PMC free article] [PubMed] [Google Scholar]
- 7.Korzhnev DM, et al. Nonnative interactions in the FF domain folding pathway from an atomic resolution structure of a sparsely populated intermediate: An NMR relaxation dispersion study. J Am Chem Soc. 2011;133(28):10974–10982. doi: 10.1021/ja203686t. [DOI] [PMC free article] [PubMed] [Google Scholar]
- 8.Shen Y, et al. Consistent blind protein structure generation from NMR chemical shift data. Proc Natl Acad Sci USA. 2008;105(12):4685–4690. doi: 10.1073/pnas.0800256105. [DOI] [PMC free article] [PubMed] [Google Scholar]
- 9.Robustelli P, Kohlhoff K, Cavalli A, Vendruscolo M. Using NMR chemical shifts as structural restraints in molecular dynamics simulations of proteins. Structure. 2010;18(8):923–933. doi: 10.1016/j.str.2010.04.016. [DOI] [PubMed] [Google Scholar]
- 10.Korzhnev DM, Religa TL, Lundström P, Fersht AR, Kay LE. The folding pathway of an FF domain: characterization of an on-pathway intermediate state under folding conditions by (15)N, (13)C(α) and (13)C-methyl relaxation dispersion and (1)H/(2)H-exchange NMR spectroscopy. J Mol Biol. 2007;372(2):497–512. doi: 10.1016/j.jmb.2007.06.012. [DOI] [PubMed] [Google Scholar]
- 11. Korzhnev DM, Religa TL, Kay LE (2012) Transiently populated intermediate functions as a branching point of the FF domain folding pathway. Proc Natl Acad Sci USA 109(44):17777–17782. [DOI] [PMC free article] [PubMed]
- 12.Sekhar A, Vallurupalli P, Kay LE. Folding of the four-helix bundle FF domain from a compact on-pathway intermediate state is governed predominantly by water motion. Proc Natl Acad Sci USA. 2012;109(47):19268–19273. doi: 10.1073/pnas.1212036109. [DOI] [PMC free article] [PubMed] [Google Scholar]
- 13.Barette J, Velyvis A, Religa TL, Korzhnev DM, Kay LE. Cross-validation of the structure of a transiently formed and low populated FF domain folding intermediate determined by relaxation dispersion NMR and CS-Rosetta. J Phys Chem B. 2012;116(23):6637–6644. doi: 10.1021/jp209974f. [DOI] [PubMed] [Google Scholar]
- 14.Zimm BH, Bragg J. Theory of the phase transition between helix and random coil in polypeptide chains. J Chem Phys. 1959;31(2):526–535. [Google Scholar]
- 15.Lifson S, Roig A. On the theory of helix-coil transition in polypeptides. J Chem Phys. 1961;34(6):1963–1974. [Google Scholar]
- 16.Chamberlain AK, Handel TM, Marqusee S. Detection of rare partially folded molecules in equilibrium with the native conformation of RNaseH. Nat Struct Biol. 1996;3(9):782–787. doi: 10.1038/nsb0996-782. [DOI] [PubMed] [Google Scholar]
- 17.Bai Y, Sosnick TR, Mayne L, Englander SW. Protein folding intermediates: Native-state hydrogen exchange. Science. 1995;269(5221):192–197. doi: 10.1126/science.7618079. [DOI] [PMC free article] [PubMed] [Google Scholar]
- 18.Rohl CA, Baldwin RL. Exchange kinetics of individual amide protons in 15N-labeled helical peptides measured by isotope-edited NMR. Biochemistry. 1994;33(25):7760–7767. doi: 10.1021/bi00191a003. [DOI] [PubMed] [Google Scholar]
- 19.Jennings PA, Wright PE. Formation of a molten globule intermediate early in the kinetic folding pathway of apomyoglobin. Science. 1993;262(5135):892–896. doi: 10.1126/science.8235610. [DOI] [PubMed] [Google Scholar]
- 20.Hu W, et al. Stepwise protein folding at near amino acid resolution by hydrogen exchange and mass spectrometry. Proc Natl Acad Sci USA. 2013;110(19):7684–7689. doi: 10.1073/pnas.1305887110. [DOI] [PMC free article] [PubMed] [Google Scholar]
- 21.Resetca D, Wilson DJ. 2013 Characterizing rapid, activity-linked conformational transitions in proteins via sub-second hydrogen deuterium exchange mass spectrometry. FEBS J., 10.1111/febs.12332. [Google Scholar]
- 22.Englander SW, Mayne L, Krishna MM. Protein folding and misfolding: mechanism and principles. Q Rev Biophys. 2007;40(4):287–326. doi: 10.1017/S0033583508004654. [DOI] [PMC free article] [PubMed] [Google Scholar]
- 23.Wand AJ, Roder H, Englander SW. Two-dimensional 1H NMR studies of cytochrome c: Hydrogen exchange in the N-terminal helix. Biochemistry. 1986;25(5):1107–1114. doi: 10.1021/bi00353a025. [DOI] [PubMed] [Google Scholar]
- 24.Kramers HA. Brownian motion in a field of force and the diffusion model of chemical reactions. Physica. 1940;7(4):284–304. [Google Scholar]
- 25.Ansari A, Jones CM, Henry ER, Hofrichter J, Eaton WA. The role of solvent viscosity in the dynamics of protein conformational changes. Science. 1992;256(5065):1796–1798. doi: 10.1126/science.1615323. [DOI] [PubMed] [Google Scholar]
- 26.Beece D, et al. Solvent viscosity and protein dynamics. Biochemistry. 1980;19(23):5147–5157. doi: 10.1021/bi00564a001. [DOI] [PubMed] [Google Scholar]
- 27.Szymański J, Patkowski A, Wilk A, Garstecki P, Holyst R. Diffusion and viscosity in a crowded environment: From nano- to macroscale. J Phys Chem B. 2006;110(51):25593–25597. doi: 10.1021/jp0666784. [DOI] [PubMed] [Google Scholar]
- 28.Holyst R, et al. Scaling form of viscosity at all length-scales in poly(ethylene glycol) solutions studied by fluorescence correlation spectroscopy and capillary electrophoresis. Phys Chem Chem Phys. 2009;11(40):9025–9032. doi: 10.1039/b908386c. [DOI] [PubMed] [Google Scholar]
- 29.Hagen SJ. Solvent viscosity and friction in protein folding dynamics. Curr Protein Pept Sci. 2010;11(5):385–395. doi: 10.2174/138920310791330596. [DOI] [PubMed] [Google Scholar]
- 30.Zwanzig R, Harrison AK. Modifications of the Stokes–Einstein formula. J Chem Phys. 1985;83(11):5861–5862. [Google Scholar]
- 31.Barshtein G, Almagor A, Yedgar S, Gavish B. Inhomogeneity of viscous aqueous solutions. Phys Rev E. 1995;52(1):555–557. doi: 10.1103/physreve.52.555. [DOI] [PubMed] [Google Scholar]
- 32.Masuda A, et al. Experimental evidence of distance-dependent diffusion coefficients of a globular protein observed in polymer aqueous solution forming a network structure on nanometer scale. J Chem Phys. 2004;121(21):10787–10793. doi: 10.1063/1.1810476. [DOI] [PubMed] [Google Scholar]
- 33.Mukherjee S, Waegele MM, Chowdhury P, Guo L, Gai F. Effect of macromolecular crowding on protein folding dynamics at the secondary structure level. J Mol Biol. 2009;393(1):227–236. doi: 10.1016/j.jmb.2009.08.016. [DOI] [PMC free article] [PubMed] [Google Scholar]
- 34.Johnson CS., Jr Diffusion ordered nuclear magnetic resonance spectroscopy: Principles and applications. Prog Nucl Magn Reson Spectrosc. 1999;34(3):203–256. [Google Scholar]
- 35.Wilkins DK, et al. Hydrodynamic radii of native and denatured proteins measured by pulse field gradient NMR techniques. Biochemistry. 1999;38(50):16424–16431. doi: 10.1021/bi991765q. [DOI] [PubMed] [Google Scholar]
- 36.Klimov D, Thirumalai D. Viscosity dependence of the folding rates of proteins. Phys Rev Lett. 1997;79(2):317–320. [Google Scholar]
- 37.Plaxco KW, Baker D. Limited internal friction in the rate-limiting step of a two-state protein folding reaction. Proc Natl Acad Sci USA. 1998;95(23):13591–13596. doi: 10.1073/pnas.95.23.13591. [DOI] [PMC free article] [PubMed] [Google Scholar]
- 38.Walser R, van Gunsteren WF. Viscosity dependence of protein dynamics. Proteins. 2001;42(3):414–421. [PubMed] [Google Scholar]
- 39.King JT, Kubarych KJ. Site-specific coupling of hydration water and protein flexibility studied in solution with ultrafast 2D-IR spectroscopy. J Am Chem Soc. 2012;134(45):18705–18712. doi: 10.1021/ja307401r. [DOI] [PubMed] [Google Scholar]
- 40.Xu J, Xue Y, Skrynnikov NR. Detection of nanosecond time scale side-chain jumps in a protein dissolved in water/glycerol solvent. J Biomol NMR. 2009;45(1–2):57–72. doi: 10.1007/s10858-009-9336-9. [DOI] [PubMed] [Google Scholar]
- 41.Tjandra N, Feller SE, Pastor RW, Bax A. Rotational diffusion anisotropy of human ubiquitin from 15N NMR relaxation. J Am Chem Soc. 1995;117(50):12562–12566. [Google Scholar]
- 42.Zagrovic B, Pande V. Solvent viscosity dependence of the folding rate of a small protein: distributed computing study. J Comput Chem. 2003;24(12):1432–1436. doi: 10.1002/jcc.10297. [DOI] [PubMed] [Google Scholar]
- 43.Hänggi P, Talkner P, Borkovec M. Reaction-rate theory: Fifty years after Kramers. Rev Mod Phys. 1990;62(2):251–341. [Google Scholar]
- 44.Huang K. Statistical Mechanics. New York: Wiley; 1987. [Google Scholar]
- 45.Jemth P, et al. The structure of the major transition state for folding of an FF domain from experiment and simulation. J Mol Biol. 2005;350(2):363–378. doi: 10.1016/j.jmb.2005.04.067. [DOI] [PubMed] [Google Scholar]
- 46.Lum K, Chandler D, Weeks JD. Hydrophobicity at small and large length scales. J Phys Chem B. 1999;103(22):4570–4577. [Google Scholar]
- 47.Chandler D. Interfaces and the driving force of hydrophobic assembly. Nature. 2005;437(7059):640–647. doi: 10.1038/nature04162. [DOI] [PubMed] [Google Scholar]
- 48.Williamson JR, Boxer SG. Multinuclear NMR studies of DNA hairpins. 1. Structure and dynamics of d(CGCGTTGTTCGCG) Biochemistry. 1989;28(7):2819–2831. doi: 10.1021/bi00433a012. [DOI] [PubMed] [Google Scholar]
- 49.Delaglio F, et al. NMRPipe: A multidimensional spectral processing system based on UNIX pipes. J Biomol NMR. 1995;6(3):277–293. doi: 10.1007/BF00197809. [DOI] [PubMed] [Google Scholar]
- 50.Kneller D, Kuntz I. UCSF Sparky: An NMR display, annotation and assignment tool. J Cell Biochem. 1993;53:254. [Google Scholar]
- 51.Altieri AS, Hinton DP, Byrd RA. Association of biomolecular systems via pulsed field gradient NMR self-diffusion measurements. J Am Chem Soc. 1995;117(28):7566–7567. [Google Scholar]
- 52.Choy WY, et al. Distribution of molecular size within an unfolded state ensemble using small-angle X-ray scattering and pulse field gradient NMR techniques. J Mol Biol. 2002;316(1):101–112. doi: 10.1006/jmbi.2001.5328. [DOI] [PubMed] [Google Scholar]
- 53.Price WS. Pulsed-field gradient nuclear magnetic resonance as a tool for studying translational diffusion: Part II. Experimental aspects. Concepts Magn Reson. 1998;10(4):197–237. [Google Scholar]
- 54.Allen M, Friedler A, Schon O, Bycroft M. The structure of an FF domain from human HYPA/FBP11. J Mol Biol. 2002;323(3):411–416. doi: 10.1016/s0022-2836(02)00968-3. [DOI] [PubMed] [Google Scholar]
Associated Data
This section collects any data citations, data availability statements, or supplementary materials included in this article.