

Significance
The paper introduces the concepts of molecular families (MFs) and gene cluster families (GCFs). We define MFs as structurally related molecules based on their mass spectral fragmentation patterns, whereas GCFs are biosynthetic gene clusters that show similar gene cluster organization with a high degree of sequence similarity. We use MS/MS networking as a tool to map the molecular network of more than 60 organisms, most of which are unsequenced, and locate their nonribosomal peptide MFs. These MFs from unsequenced organisms are then connected to GCFs of publicly available genome sequences of closely related organisms.
Keywords: MS/MS molecular networking, mass spectrometry, microbial ecology
Abstract
The ability to correlate the production of specialized metabolites to the genetic capacity of the organism that produces such molecules has become an invaluable tool in aiding the discovery of biotechnologically applicable molecules. Here, we accomplish this task by matching molecular families with gene cluster families, making these correlations to 60 microbes at one time instead of connecting one molecule to one organism at a time, such as how it is traditionally done. We can correlate these families through the use of nanospray desorption electrospray ionization MS/MS, an ambient pressure MS technique, in conjunction with MS/MS networking and peptidogenomics. We matched the molecular families of peptide natural products produced by 42 bacilli and 18 pseudomonads through the generation of amino acid sequence tags from MS/MS data of specific clusters found in the MS/MS network. These sequence tags were then linked to biosynthetic gene clusters in publicly accessible genomes, providing us with the ability to link particular molecules with the genes that produced them. As an example of its use, this approach was applied to two unsequenced Pseudoalteromonas species, leading to the discovery of the gene cluster for a molecular family, the bromoalterochromides, in the previously sequenced strain P. piscicida JCM 20779T. The approach itself is not limited to 60 related strains, because spectral networking can be readily adopted to look at molecular family–gene cluster families of hundreds or more diverse organisms in one single MS/MS network.
Tens of thousands of sequenced microbial genomes or rough drafts of genomes are available at this time, and this number is predicted to grow into the millions over the next decades. This wealth of sequence data has the potential to be used for the discovery of small bioactive molecules through genome mining (1–6). Genome mining is a process in which small molecules are discovered by predicting what compound will be genetically encoded based on the sequences of biosynthetic gene clusters. However, the process of mining genetically encoded small molecules is not keeping pace with the rate by which genome sequences are being obtained. In general, genome mining is still done one gene cluster at a time and requires many person-years of effort to annotate a single molecule. The time and significant expertise that current genome mining requires also make genome mining very expensive. In light of this extensive effort and cost, alternative approaches to genome mining and annotating specialized metabolites must be developed that not only take advantage of the sequenced resources available and make it efficient to perform genome mining on a more global scale but also enable the molecular analysis of unsequenced organisms. Such methods will then significantly reduce the cost of genome mining by increasing the speed with which molecules are connected to candidate genes and using resources already available. Here, we put forward such an MS-based strategy that enables the genome mining of small-molecule families from unsequenced organisms. This strategy uses partial de novo structures inferred from nanospray desorption electrospray ionization (nanoDESI)-based MS/MS networking to connect to structures predicted from genomic resources available in sequence repositories (2, 7). The MS/MS network-based genome mining approach presented in this paper takes a more global approach than is currently the norm. This paper builds on many advances that have happened over the past decade. First, an enormous amount of microbial sequencing data has been deposited in public databases and is waiting to be mined (8–10). Second, our understanding of biosynthetic pathways and the function of specific enzymes found in gene clusters—especially for complex peptides made by nonribosomal peptide synthetases (NRPSs)—has dramatically increased (11–19). Third, the last decade has seen very significant advances in MS with respect to ion sources and the sensitivity of the instruments themselves (20–27). Ambient ionization methods combined with significant improvements in sensitivity and mass accuracy of MS instrumentation now enable the detection of intact molecules directly from surfaces (7, 28–40). Using the ambient method nanoDESI, the molecular characterization of microbial colonies directly from agar surfaces without any prior sample preparation has become possible (7).
In this study, nanoDESI is used to observe detectable metabolites, where we focused on nonribosomally synthesized peptides, from unsequenced bacterial strains as well as representative sequenced Pseudomonas and Bacillus strains (Table S1). These metabolites were subsequently subjected to MS/MS networking to first generate a molecular network representing the detectable metabolites that are then related to one another based on similarity of their fragmentation spectra, which is dictated by their molecular structure (7). MS/MS networking was then used to generate de novo peptide sequences from nonribosomally synthesized peptides as well as their respective molecular families (MFs). MFs are defined in this paper as a series of related molecules based on their fragmentation behavior that translates to structural similarity. MS-based genome mining using genomes in sequences repositories from related organisms was then used to connect these MFs to their gene cluster families (GCFs) (2, 7). GCFs are defined as gene clusters that exhibit similar gene cluster organization with a high degree of sequence similarity, where the A-domain specificity is minimally altered. We targeted the well-studied family of molecules, the nonribosomal peptide systems, with our MS/MS network-based genome mining strategy to show that mass spectrometric signatures can be used to group families of molecules from multiple organisms. Grouping these MFs can, in turn, can be used to find candidate biosynthetic gene clusters found in sequence repositories that could be responsible for the biosynthesis of such specialized metabolites at a more global scale. For a detailed description on how biology creates peptides without a ribosome, one should consult several detailed reviews from the literature (18, 19). In short, NRPS-derived peptides are produced by protein machineries that build the peptides from a collection of more than 500 different amino acid building blocks. Genome-based predictions of peptide cores created by NRPS assemblies have now been automated and integrated into informatic tools, where a sequence is uploaded and predictions are generated (41–45). In our opinion, NRPS-derived molecules are the most readily achievable goals with respect to genome mining because of the availability of extensive biosynthetic studies in the last decades. It is, however, expected that, through creative adaptation of the approach or related approaches, additional small-molecule classes, such as isoprenoids, polyketides, oligosaccharides, glycolipids, lipids, and other natural products, can be mined as well.
To accomplish genome mining of unsequenced organisms, we used sequencing information from publicly available databases as well as the predictive power of NRPS A domains (encoded by NRPS genes in the sequenced genomes of related taxa) to link the MS/MS peptide signatures of compounds produced to candidate biosynthetic gene clusters. This technique allowed us to correlate MFs [e.g., surfactin/lichenysin and viscosin/white line-inducing principle (WLIP)/massetolide] from 60 strains of bacilli and pseudomonads to their respective GCFs (46–49). We then applied this same methodology to assign the gene cluster of the membrane-disrupting antimicrobial agent, the bromoalterochromides (50–52), from a Panamanian octocoral-associated Pseudoalteromonas species.
Results and Discussion
MS/MS Network-Guided Genome Mining.
Matching of MFs with GCFs of unsequenced microbes through association with sequenced genomes was accomplished by a four-step process (outlined in Fig. 1A). In step 1 (Fig. 1A), fragmentation data for the molecules produced by these microbes were obtained for analysis by molecular MS/MS networking, effectively creating a searchable molecular network for these organisms. For this purpose, we chose nanoDESI MS as the ionization method. NanoDESI, through a real-time liquid extraction, enables ionization of molecules directly from colonies grown on agar surfaces in Petri dishes without any sample preparation, but other MS techniques, such as liquid chromatography MS/MS or direct infusion MS/MS, could also have been used (7). Because our nanoDESI is interfaced with an ion trap, it was possible to directly fragment all of the ions that were detected to obtain MS/MS spectra. We subjected 60 different strains of bacteria to nanoDESI analysis: there were 42 bacilli and 18 pseudomonads, and their resulting MS/MS spectra were networked and visualized with Cytoscape (Fig. 1 A, step 2, and B) (7, 53–55). Such organization into networks enables the relationships between spectrally identical and related molecules to be mapped based on the spectral similarity of their MS/MS signatures. An MS/MS cluster, where many nodes are connected by edges, indicates that many related molecules were observed, whereas an MS/MS cluster with few nodes may be a unique set of molecules with few alternative forms, which results in unique spectra. Furthermore, MS/MS networking enables the visualization of groups possessing unique spectral signatures that indicate that the molecules are distinct from the other molecules in a given dataset.
Fig. 1.

Process of MS/MS networking-guided genome mining of nonribosomal peptides produced by unsequenced organisms and the molecular network generated from 42 bacillus and 18 pseudomonad strains. (A) Step 1: nanoDESI MS on live microbial colonies to determine molecular mass and obtain MS/MS fragmentation data. Step 2: generation of molecular networks and visualization using Cytoscape. Step 3: peptide sequence tag generation from raw spectra of MS/MS clusters and prediction of NRPS gene clusters (antiSMASH) from genomic data available in public databases. Step 4 (1): biosynthetic gene cluster analysis to verify candidate molecules. Step 4 (2): if the putative matches are of high priority, proceed with full structure elucidation from MSn and NMR data. (B) Molecular network of 42 bacilli (pink) and 18 pseudomonad (green) strains.
Both the bacilli and pseudomonad nanoDESI MS/MS data were combined into one MS/MS network to create a searchable molecular network. It was anticipated that very few of the MS/MS signals that come from nonribosomal peptides would overlap between the two organisms; there are no nonribosomal peptides that have been described in the literature that are found in both bacilli and pseudomonads, and no NRPS gene clusters between these genera are related to one another (46–49). The merging of the data also enables the removal of overlapping signals that are not of interest, including any signals derived from the growth medium, although individual networks for the bacilli and pseudomonads could have been created. Combining the data from all organisms assists in the peptidogenomics-based genome mining, because only one MS/MS node needs to be matched to its corresponding genome. This genome can then be related to the surrounding nodes in the MS/MS cluster, and therefore, not every MS/MS spectrum has to be individually correlated to candidate gene clusters, even when it originates from different organisms. This effort required to correctly correlate a GCF–MF pair is additive and only required one time. Any newer molecules that are added to this network and cluster within a particular MF can then have the previously linked GCF–MF pair related to it. Finally, the vast majority of nonribosomal peptides isolated from these genera contains proteinogenic amino acids, thus simplifying the peptidogenomic analysis. Although there are nonpeptidic molecules that are observed in the MS/MS network, such as the rhamnolipids and quinolones (56) (Fig. S1), the goal of the analysis of these 60 strains was to provide a proof of principle to correlate nonribosomal peptides to their candidate gene clusters. Although we only used 42 bacilli and 18 pseudomonads, this technique can be scaled to hundreds, thousands, or even tens of thousands of organisms, sequenced or unsequenced, and still requires only one MS/MS node to be matched to its corresponding genome. Combining the MS/MS data from the bacilli and the pseudomonads resulted in about 22% (972/4,311 nodes) overlap in signals. Likely sources for these common molecules are primary metabolism, the nanoDESI solvent, the growth medium, and molecules that fragment poorly. The majority of spectra (78%) is unique to either the bacilli or the pseudomonads (Fig. 1B). There are 121 MS/MS clusters that contain three or more nodes of unique fragmentation patterns; these MS/MS clusters visualize individual MFs.
After the MS/MS network had been generated in step 2 (Fig. 1A), we examined the raw MS/MS data looking for mass shifts between adjacent ions corresponding to the mass of an amino acid, thereby creating a sequence tag that would indicate that a particular MS/MS cluster is peptidic in nature (Table S2). The peptidic clusters were then subjected to peptidogenomic analysis (Fig. 1A, step 3). We limited this search space to only proteinogenic amino acids (with and without an N-methyl group), because manual annotation of spectra with the more than 500 possible unique amino acids that can be incorporated into nonribosomally produced peptides is a nearly impossible task, especially with low-resolution MS/MS data. In the future, specific algorithms can be developed that will overcome this limitation, especially in conjunction with high-resolution MS/MS data. Instead of carrying out peptidogenomics analysis on a single organism as previously described, the peptide backbones of all of the NRPS gene clusters from all available genome sequences of bacilli and pseudomonads in the public databases were predicted using a batch form of antibiotics and Secondary Metabolite Analysis SHell (antiSMASH) as well as curation using other A-domain prediction tools (4, 16, 43, 44, 57) (Tables S2 and S3). By combining amino acid MS/MS signatures with the predicted amino acid specificity of NRPS A domains, we obtained candidate matches of MS/MS signatures to particular GCFs. At this stage, the iterative process of examining and matching MS data to the gene clusters, which is done in peptidogenomics analysis, was carried out, because this information is needed to correlate MFs and GCFs and can then be related to surrounding nodes within the MS/MS cluster (2). To improve our confidence in the peptidogenomics analysis, we looked for several correlations. (i) Can we find additional amino acids that correlate to the A-domain specificity predictions that were missed when generating the initial sequence tag from the MS/MS data? (ii) Does the biosynthetic gene cluster contain tailoring domains in the NRPS or biosynthetic enzymes to make nonproteinogenic amino acids, and can those amino acids be found in the MS/MS data? (iii) Did we observe patterns of mass shifts in the parent ions, such as ±14 Da, indicative of a different set of amino acid substitutions (e.g., Gly vs. Ala), different methylations, or different fatty acid chain lengths that are common to nonribosomal peptides? (iv) Does the size of the molecule match up to the size of the gene cluster (e.g., an NRPS with 20 A domains is unlikely to encode for a molecule that is ∼1,000 Da)? (v) Does the biosynthetic pathway match the MF structural prediction? If these correlations all agree, then it is possible to state that a potential GCF and MF match has been found. When the molecule or gene cluster is very important based on biological prioritization, the GCF–MF correlation will need to be confirmed by other means as described below. Below are more detailed examples of how such GCF–MF correlations were obtained for known compounds from bacilli and pseudomonads.
Nonribosomally Produced Peptides from Bacilli.
Mapping the searchable molecules through the creation of a molecular network from 60 organisms revealed a large cluster of 78 nodes representing molecules with masses ranging from 1,002 to 1,116 Da found only within the bacilli data (Fig. 2A). The data incorporated in the nodes came from 23 different datasets (Table S4). Generation of sequence tags using only proteinogenic amino acids revealed a 113 Da and a 113–113 Da pair of signatures characteristic of peptides (Fig. 2B). For the purposes of this study, the longest consecutive sequence tag was used to carry out peptidogenomics, because longer tags are more likely to lead to correct identifications. Future algorithms with high-resolution data will enable one to take into account all of the tags that are generated, including those tags with nonproteinogenic amino acids. For this MS/MS cluster, a search tag of 113–113 Da, corresponding to Leu-Leu, Leu-Ile, Ile-Leu, or Ile-Ile, was used to search all of the predicted NRPS sequences obtained from the A-domain specificity predictions of the publicly available sequences of bacilli and pseudomonads. This 113–113 Da sequence tag matched to sequence tags from B. subtilis, B. amyloliquefaciens, B. atrophaeus, and B. licheniformis but not predicted sequence tags from the pseudomonads. This GCF included the B. subtilis surfactin and B. lichenformis lichenysin synthetases. Comparing the gene cluster matches from the bacilli revealed that all of the gene clusters had related A-domain specificities and similar gene cluster organization, with over 80% protein sequence similarity (Fig. 2D). This sequence tag and A-domain specificities are in agreement with the known structures of surfactin and lichenysin. At least 17 lichenysins and 53 surfactins are described in the literature with different fatty acid lengths and geometries as well as different amino acids in the backbone of the molecule, because the promiscuity of many A domains leads to the production of MFs. Thus, the surfactin/lichenysin family GCF was identified. We had included some sequenced strains, such as B. subtilis 3610, making it possible to verify from the fragmentation data alone whether the MF contained surfactin. Indeed, the surfactin fragmentation data from B. subtilis 3610 is found in this cluster (Fig. S2). Using this approach, four candidate GCF–MF pairs were identified from bacilli (Fig. S1).
Fig. 2.

Molecular network from bacilli and pseudonomads with the identification of the surfactin MF. (A) Surfactin MF (boxed and enlarged) originating from the bacilli MS/MS clusters. (B) Random selection of nodes for raw MS/MS spectra analysis and sequence tag generation. (C) Genome mining by antiSMASH of all publicly available sequenced bacilli genomes. (D) Matching the generated sequence tags to all of the predicted NRPS gene clusters from bacilli genomes. Starred domains are starter condensation domains.
Nonribosomally Produced Peptides from Pseudomonads.
Similar results were obtained for the pseudomonads. For example, a 17-node MS/MS cluster ranging from 1,133 to 1,193 Da contained a tag of 87–113-87–113 Da corresponding to Ser-Leu-Ser-Leu, Ser-Ile-Ser-Leu, Ser-Leu-Ser-Ile, Ser-Ile-Ser-Ile, and reverse sequences (Fig. S3). This sequence tag, from MS/MS data obtained from unsequenced P. tolaasii, P. putida, and P. aurantiaca, matched to the predicted GCFs only from the pseudomonads and not the bacilli. The matches included the viscosin, WLIP, and massetolide gene clusters. Therefore, both the gene clusters and molecules that were identified from this GCF–MF pair belong to the viscosin/WLIP and massetolide family of molecules. We confirmed the viscosin cluster by adding MS/MS data from P. putida RW10S2, a known WLIP producer (58). Four candidate GCF–MF pairs were identified from the pseudomonads (Fig. S1). To date, despite the importance of the strain in agriculture, P. tolaasii strains are not described to make a molecule belonging to this MF. On closer inspection, however, a GCF, with the correct gene and domain organization to the viscosin MF, is found in the draft genomes of P. tolaasii PMS117, 2192, and 6264, consistent with our observations. Based on these two proof-of-principle results, we applied this strategy of genome mining using MFs to all MS/MS clusters with peptidic signatures. This strategy revealed that 8 of 121 MS/MS signatures could be correlated to GCFs (Fig. S1): the GCFs of iturin, surfactin/lichenysin, kurstakin, bacitracin, viscosin, thanamycin, entolysin, and amphisin were successfully paired with their respective MFs.
Dereplication and Validation of GCF–MF Correlations.
When making such correlations, there are at least four possible outcomes. First, the gene cluster and MS data for a given molecule may match perfectly with a known molecule–gene cluster pair already described in the literature, which was the case for the bacilli and pseudomonad examples (Fig. S1). Second, a known molecule is successfully associated to a gene cluster or family of gene clusters, where this pair had no prior example in the literature. Third, a family of gene clusters may be associated with a known molecule based on the MS, MS/MS, and GCF analysis. Fourth, there is the possibility that, using the dereplication strategies that we used here, a newly discovered gene cluster may match a newly discovered molecule not previously associated with any molecule already described in the literature. This outcome may indicate either a new molecular entity or an incorrect match.
How can we validate any of these correlations? At this stage, we cannot validate them unless additional confirmation is acquired. There are many avenues to perform such verifications. These avenues include matching the MS/MS data to MS/MS data published in the literature, comparative in silico dereplication to databases such as Norine, isolation and NMR analysis of the molecule, creating KOs of the gene cluster, and (partially) sequencing the gene cluster to verify that it is, indeed, present within the genome of the unsequenced organism. Because the costs for validation are so significant, it is our opinion that these approaches should only be performed when the molecules are of great biological or chemical interest. However, if the effort required for verification of a single molecule takes place, this verification can be extended to the entire GCF–MF correlation and will never have to be carried out again. Furthermore, any new data from molecules or organisms that are added to a network that also clusters to an existing GCF–MF pair can have the original verification extended to them. However, if such additional verification fails, then the GCF–MF association is incorrect. Thus far, we have not encountered such a scenario with our data. GCF–MF pairs that could not be verified by the literature or where no literature is found should only be considered putative associations. Although the above analysis was not an exhaustive search, the data provided sufficient evidence that the methodology works and is providing the foundation for future algorithmic development.
Associating GCFs with Biologically Interesting MFs from Unsequenced Organisms.
Having established the methodology of MS/MS-guided genome mining of unsequenced organisms, we wanted to show the use of the method to identify a gene cluster for a molecule showing antimicrobial activity from unsequenced organisms. Two Pseudoalteromonas species (strains OT59 and 04M1A) were isolated from the Panamanian octocorals Leptogorgia alba and Psammogorgia sp., respectively. Both of these strains showed inhibitory activity against B. subtilis 3610 when cocultured on agar. We used microbial MALDI imaging MS (MALDI-IMS) to monitor the distribution of metabolites and determine which of these metabolites are responsible for the observed bioactivity (22). Subjecting a coculture of Pseudoalteromonas and B. subtilis 3610 to IMS revealed two MS signals, m/z 880 and 960, from strain 04M1A that sit at the zone of inhibition, suggesting that these molecules may contribute to antibiotic activity (Fig. 3A). We isolated these molecules by HPLC and tested the fractions in a conventional disk diffusion assay against B. subtilis 3610. This isolation revealed that a molecule with mass of 921.191 Da (protonated vs. potassiated adduct at m/z 960 Da) was a major contributor to the antibiotic activity. Cytological profiling of both DNA and the cell membrane suggested that the mechanism of action of the 921.191 Da compound is similar to the mechanism of action of nisin, which is an amphipathic cationic peptide that disrupts cytoplasmic membranes and is distinct from other membrane active compounds (Fig. 3 B and C).
Fig. 3.

IMS and MS/MS networking of the bromoalterochromide family and fluorescence microscopy of the 921.191 Da dibromoalterochromide and its effect on B. subtilis 3610 cells. (A) MALDI-IMS showing bromoalterochromide production by Pseudoalteromonas OT59 and 04M1A and its special correlation with B. subtilis 3610 inhibition. (B) Fluorescence micrographs of growing B. subtilis 3610 cells treated with DMSO, 2,4-dinitrophenol (DNP), or the 921.191 Da dibromoalterochromide. Red stain is FM 4–64, a fluorescent membrane stain; green stain is Sytox Green, a DNA stain that is membrane-impermeable and shows increased fluorescence in permeabilized cells. (C) Fluorescence micrographs of growing B. subtilis 3610 cells treated with DMSO, DNP, and two concentrations of nisin; the 921.191 Da dibromoalterochromide is at or below the minimum inhibitory concentration. (D) MS/MS networking from nanoDESI MS of Pseudoalteromonas OT59 and 04M1A. The monobromoalterochromide gives two major isotopes, whereas the dibromoalterochromide gives three major isotopes. At least one of these isotopes was detected by MS/MS networking. (E) Node selection of predicted bromoalterochromide species (possibly present as protonated, sodiated, and potassiated adducts) for raw MS/MS spectra analysis and sequence tag generation. Amino acid mass shifts of 113–114 Da correspond to a sequence tag of Ile-Asn or Leu-Asn.
Subjecting colonies of Pseudoalteromonas OT59 and 04M1A grown on agar to nanoDESI and MS/MS networking revealed that the mass of 921.191 Da belonged to a cluster of related molecules (Fig. 3D). Inspecting the MS/MS data from the 921.191 Da and surrounding nodes revealed that the molecules were peptidic and had a sequence tag of Ile/Leu and Asn (Fig. 3E). A search in the AntiMarin database did not find a match for the 921.191 ion, but there was a match to a related node. The match was to a molecule with a mass of 843.280 Da named bromoalterochromide A and A′, an unusual monobrominated lipopeptide (Fig. 3E) (50, 51). To confirm that the 921.191 Da compound isolated from both OT59 and 04M1A was, indeed, a bromoalterochromide, the MS/MS spectra were further examined, and an NMR analysis of the purified compound was performed (Table S5). These data were compared with the data found by Kalinovskaya et al. (51). Both the NMR and MS/MS analysis support the assignment of this molecule to the bromoalterochromide family. This finding highlights how MS/MS networking tools can be used to dereplicate related molecules. Our molecule was 77.911 Da larger than the bromoalterochromide found in AntiMarin, suggesting that our molecule was a doubly brominated bromoalterochromide. To find a candidate GCF, every publicly available Pseudoalteromonas sp. genome was mined for NRPS or NRPS/polyketide synthase (PKS) hybrid gene clusters (which we had done with the bacilli and pseudomonads), and the A-domain specificities were examined until we found a positive hit within P. piscicida JCM 20779T (52). The A-domain and gene cluster analyses revealed that the gene cluster from P. piscicida contained a halogenase, type II polyketide synthase/type II fatty acid proteins, and NRPS modules that are predicted to load Thr-Val-Asn-Asn-Ile/Leu (Table S6). This evidence means we have found a putative GCF–MF pair.
Confirming the GCF–MF Pairing of the Bromoalterochromides from Pseudoalteromonas.
Several complementing approaches were used to verify that this molecule was, indeed, a member of the bromoalterochromide family of NRPS-derived molecules. If our prediction of the GCF–MF pair was indeed correct, then the sequenced organism P. piscicida JCM 20779T should also produce the bromoalterochromides, although this finding has not been described in the literature. To confirm the production of the bromoalterochromides from P. piscicida JCM 20779T, the organism was obtained and subjected to nanoDESI. MS/MS data generated from P. piscicida JCM 20779T were merged with the MS/MS networking data from OT59 and 04M1A, revealing that P. piscicida JCM 20779T does, indeed, produce compounds that fall within the bromoalterochromide cluster. This result suggests that the biosynthetic machinery is present in P. piscicida JCM 20779T like in OT59 and 04M1A (Fig. 4). Interestingly, P. piscicida JCM 20779T only produces the 843.280 Da monobromoalterochromide and not the 921.191 Da dibromoalterochromide, whereas OT59 and 04M1A produce both. These results provide additional confirmation that the GCF–MF pair has correctly been identified and that it is possible to connect MFs from unsequenced organisms to GCFs in publicly available sequencing data. Having candidate molecules and the gene cluster in hand, it is now possible to evaluate if the molecule and biosynthetic gene cluster match as well. The gene cluster contains all of the biosynthetic components needed to produce the bromoalterochromides and was identified bioinformatically (Fig. 4 and Table S6). The condensation and epimizerization domains were subjected to phylogenetic analysis with starter C domains, LCL and DCL condensation domains, dual C/E domains, and standalone E domains as described by Rausch et al. (59). Interestingly, the epimerization domains from P. piscicida JCM 20779T do not clade tightly with the epimerization domains from B. cereus, B. licheniformis, or B. subtilis, most likely because of phylogenetic divergence of the organisms, which also inhabit different ecological niches (Fig. S4). Still, the epimerization domains are in the correct locations to encode for d-Thr, d-Val, l-Asn, d-Asn, and d-Leu/Ile as previously described (50, 51). The polyketide portion of the biosynthetic pathway is missing the enoyl reductase, which one would predict based on the structure of the molecule. Lastly, the pathway contains a flavin-dependent halogenase. The only other candidate brominating flavin-dependent halogenase described to date is found in the jamaicamide pathway (60). Again, the gene cluster analysis matches perfectly with the expected biosynthesis of the bromoalterochromides, supporting the notion that this molecule family, including 921.191 Da, belongs to the bromoalterochromide family. Finally, to further confirm this finding of the bromoalterochromide GCF–MF pair, we set out to show that similar biosynthetic genes exist in our strains. For this reason, OT59 and 04M1A were subjected to partial genome sequencing using Illumina sequencing, which revealed that the same NRPS genes are present with 96% identity to the genes found in P. piscicida JCM 20779T based on BLASTN sequence alignments (Fig. S5). The extensive tasks, ranging from NMR analysis of the purified bromoalterochromide to the gene cluster analysis and partial sequencing of OT59 and 04M1A, were carried out to verify, with complete certainty, that we had the correct molecule as well as the correct GCF–MF pairing. All of this information was dedicated to the analysis of the 921.191 Da dibromoalterochromide, but it can now be extended to the various family members of this molecule. Additionally, if any other data are added to this network and cluster to this MF, the steps for verification of the molecule and GCF–MF pairing do not need to be carried out again, thus increasing the speed and reducing the cost of studying these molecules. Combined, these data show that MS/MS networking peptidogenomics analysis enables the mapping of observed MFs to already available sequenced genomes and that it can lead to the discovery of previously unidentified GCFs, which we showed for the 921.191 Da antimicrobial agent dibromoalterchromide from unsequenced Pseudoalteromonas species.
Fig. 4.
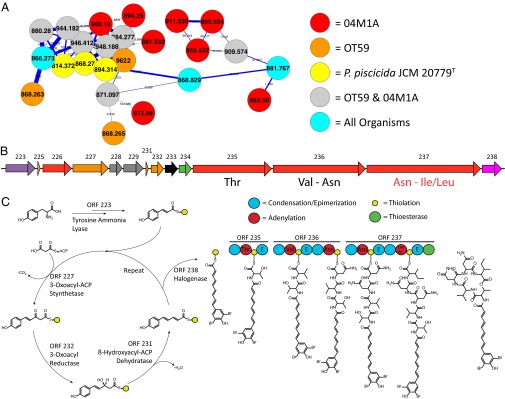
MS/MS networking of Pseudoalteromonas OT59 and 04M1A and piscicida JCM 20779T. (A) MS/MS cluster of bromoalterochromide (red, orange, yellow, gray, and teal nodes are 04M1A, OT59, P. piscicida JCM 20779T, OT59/04M1A, and metabolites originating from all organisms, respectively). (B) Bromoalterochromide gene cluster. Purple, ammonia lyase; orange, type II PKS/fatty acid synthase; red, NRPS; gray, transporters; green, thioesterase; pink, halogenase; black, hypothetical proteins. (C) Proposed biosynthetic pathway with speculative double halogenation by ORF 238 after acyl chain elongation.
Conclusion
One of the major bottlenecks in genome mining is that it takes a significant amount of time and money to connect a molecule to its biosynthetic signature. Here, we have highlighted one example of how we can increase the speed and reduce the cost of the analysis of specialized metabolites from a large cohort of organisms using sequence information already available in public databases. We targeted NRPS systems with our MS/MS network-based genome mining strategy to show that genome mining can be accomplished for unsequenced organisms by borrowing an already sequenced genome of a related organism. We expect, however, that, through the creative adaptation of this approach, additional small-molecule classes, such as isoprenoids, polyketides, oligosaccharides, glycolipids, and lipids, can be mined as well. Connecting the GCFs and MFs is additive, because it provides an approach to correlate molecules to genetic information that, after linked in a manner that is analogous to annotations in sequence repositories, can be extrapolated quickly to new samples, especially as more genome sequences become available. This additivity saves time and effort, and so far, we have not yet reached a limitation in terms of the number of samples that can be compared. Such an approach (or related approaches) will become the first step in the molecular characterization of unsequenced microbes, even in field-collected samples, especially as mass spectrometers interfaced with ambient ionization are becoming cheaper and even portable (39, 40). Our approach could serve nicely as a strain preselection strategy for therapeutic discovery applications, and it is now beginning to be used in our laboratories to mine metagenomics data rather than strictly full genome sequencing data. With this approach, one can begin to create GCF–MF associations for molecules analyzed directly from environmental and personal microbial communities, such as the ones found on our skin, our gut, soil, coral reefs, or plant roots—something not commonly attempted with today’s genome mining technologies—thereby avoiding the requirement of producing viable cultures in the laboratory.
Materials and Methods
Bacilli, Pseudomonad, OT59, 04M1A, and P. piscicida JCM20779T Culture Conditions.
The 42 bacilli and 18 pseudomonads are listed in Table S1. All strains were grown in LB broth (Fischer Scientific) overnight, shaken at 28 °C, transferred to 1 L medium containing 4 g yeast extract (Sigma Aldrich), 10 g malt extract (Sigma-Aldrich), 4 g dextrose (EMD), and 10 g agar (Sigma-Aldrich) to make ISP2 agar, and incubated for 48 h at 30 °C. OT59, 04M1A, and P. piscicida JCM 20779T were grown on 500 mL medium contained 9 g agar (Sigma-Aldrich), 5 g potato starch (Sigma-Aldrich), 2 g yeast extract (Sigma-Aldrich), 1 g peptone (Sigma-Aldrich), and 14 g aquarium salt (Aquatic Systems; Instant Ocean) to make M1 agar.
Sample Preparation for MALDI.
After the strains were grown individually for 48 h on ISP2 agar, ∼1 μL cells was scraped directly from the live colony and transferred to an microScout Plate 96 MALDI anchor plate. The cells were then covered with 1 μL saturated matrix solution [35 mg/mL Universal MALDI Matrix (1:1 mixture of 2-5-Dihydroxybenzoic acid (2,5-DHB) and α-cyano-4-hydroxy-cinnamic acid; Sigma-Aldrich) in 78%/21%/1% (vol/vol) acetonitrile/water/formic acid] until proper crystal formation. The MALDI plate was inserted into an Autoflex Bruker Daltonics mass spectrometer, and data were recorded in reflectron positive mode. Data analysis was carried out using ClinProTools to generate heat maps to analyze chemical profiles of the strains simultaneously.
Live Colony NanoDESI MS/MS Data Acquisition.
Overnight cultures of bacilli and pseudomonads were prepared as stated above. Four cultures (0.5 μL each) were spotted on an ISP2 agar plate and grown for 48 h at 30 °C. Colonies of OT59, 04M1A, and P. piscicida JCM20779T were grown as stated above. NanoDESI was carried out as described by Watrous et al. (7) using a solvent mixture of 65:35 acetonitrile:water with 0.05% formic acid for the bacilli and pseudomonads and 50:50 MeOH:water with 1% formic acid for the Pseudoalteromonas. Spray voltage was kept between 2.0 and 3.0 kV. Data were collected using a data-dependent MS/MS method on a hybrid 6.4T LTQ-FT (Thermo Electron) mass spectrometer. In this method, an MS1 scan of 50–1,600 m/z was followed by MS/MS of the four most intense ions (2 m/z isolation width, a normalized collision energy of 35%, and an activation time of 30 ms), which were then added to an exclusion list, allowing for another MS1 scan followed by MS/MS of the next four most intense ions.
MS/MS Networking and Sequence Tagging.
The MS/MS data of 42 bacilli, 18 pseudomonads, OT59, 04M1A, and P. piscicida JCM 20779T were clustered as described by Pierce et al. (34). Algorithms assumed a precursor mass tolerance of 1.0 Da and a fragment mass tolerance of 0.3 Da with the cosine threshold set at 0.7. Two plugins were used for aid with data visualization. The FM3 layout was used to organize and align the nodes within the network, and the HiderSlider plugin was used to hide or show nodes within the network to determine whether the origin of the node was bacilli or pseudomonad. After clusters of specific molecules were located, individual nodes were selected, and the MS/MS spectra were examined for sequence tags.
Peptidogenomics and Genome Mining.
All available genome sequences for the bacilli and pseudomonads were gathered from the National Center for Biotechnology Information, US Department of Energy Joint Genome Institute, and PseudoDB. Pseudoalteromonas spp. genomes used for peptidogenomics and genome mining are described by Xie et al. (52). Targeted nucleotide sequences were subject to antiSMASH, NP.searcher, NRPSpredictor2, and PKS/NRPS analysis to determine the amino acid specificity of the NRPS A domain (4, 16, 43, 44, 57). NRPS and NRPS/PKS hybrid gene clusters were screened with the Ile/Leu-Asn sequence tag obtained from molecular networking. After obtaining potential NRPS gene clusters, the protein sequences were pulled out, and A-domain accuracy was examined by PKS/NRPS analysis to eliminate NRPS genes that were unlikely to produce the bromoalterochromides. For all remaining gene clusters, BLAST analysis was performed on the NRPS-surrounding genes to determine their functions.
MALDI-IMS Screening of Pseudoalteromonas OT59 and 04M1A Against B. subtilis 3610.
B. subtilis 3610 was grown to an OD of 0.2–0.5 in M1 liquid media, and 20 μL were spotted onto an M1 agar plate (described above) and spread into a lawn using glass beads. The cultures were allowed to dry, at which point 2 μL OT59 or 04M1A stock, frozen at an OD of 1.0 in 20% glycerol in M1 liquid media, were spotted at the center of the plate. The cultures were incubated at 30 °C in the dark for 48 h. The interactions of OT59 with B. subtilis 3610 were prepared as stated above. These interactions, as well as the corresponding controls, were excised out of the agar and placed on a Bruker MSP 96 stainless steel target plate. A film of Universal MALDI Matrix (Sigma-Aldrich) was applied to the surface of the excised agar using a 53-μm sieve (Hogentogler & Co., Inc.). The target plate was dried at 37 °C until the agar pieces had dried completely and adhered to the target plate. The samples were subjected to MALDI-IMS using reflectron positive mode on a Bruker Microflex with Compass 1.2 software suite containing flexImaging 2.0, flexControl 3.0, and flexAnalysis 3.0.
Extraction and Isolation of the 921.191 Da Dibromoalterochromide.
OT59 stock (2 μL), frozen at an OD of 1.0–1.2, was inoculated onto M1 agar plates. The colonies were grown for 48 h at 30 °C, at which point the colonies were excised from the agar plate and extracted with methanol. The crude extract was fractionated on a Sephadex LH-20 column (MeOH) at a flow rate of 1.5 mL/4 min, where the fractions were tested for bioactivity against B. subtilis 3610. Lawns of B. subtilis 3610 were prepared as stated above. The fractions were dried down and resuspended in 10–100 μL methanol; 2–8 μL were spotted onto a paper disk, allowed to dry, and then placed onto the newly prepared lawn of B. subtilis 3610. The cultures were incubated in the dark at 30 °C for 48 h. Bioactive fractions were analyzed by MALDI for molecular signature. Bioactive sephadex fractions containing the bromoalterochromides were pooled together and finally purified by HPLC to obtain the 921.191 Da dibromoalterochromide. Purification was performed on an Agilent 1260 HPLC equipped with a Discovery reverse-phase C18 5-μm, 180 A, 25-cm × 10-mm column (Supelco) using the water/acetonitrile gradient listed below. Solvent A is HPLC-grade water (J. T. Baker) with 0.1% TFA (Sigma-Aldrich), and solvent B is HPLC-grade acetonitrile (J. T. Baker) with 0.1% TFA. The gradient was run at a flow rate of 2 mL/min.
| Minute | 0 | 1 | 31 | 37.5 | 38 | 39 | 40 |
| A (%) | 60 | 60 | 35 | 0 | 0 | 60 | 60 |
| B (%) | 40 | 40 | 65 | 100 | 100 | 40 | 40 |
NMR Measurements of the 921.191 Da Dibromoalterochromide.
NMR data were acquired at the University of California at San Diego Skaggs School of Pharmacy and Pharmaceutical Sciences NMR Facility. Proton and 2D NMR of the purified 921.191 Da dibromoalterochromide were measured on a 600 MHz NMR (Manex superconducting magnet, 14.1 T) fitted with a 1.7-mm cryoprobe and Bruker Avance console and operated using Bruker TopSpin software.
Fluorescence Microscopy.
B. subtilis PY79 was grown in LB to an OD600 of 0.3, centrifuged, and resuspended in 1/10th of the volume; 14.25 μL concentrated cells were added to 1.7-mL microcentrifuge tubes. At t = 0, 0.75 μL 100% DMSO and appropriately diluted samples of 2,4-dinitrophenol, nisin, or 921.191 Da dibromopeptide (in 100% DMSO) were added to cell aliquots. The tubes were capped and incubated at 37 °C in a roller. After 20 min, 3 μL cells were added to 0.75 μL stain mix containing 30 μg/mL FM 4–64, 2.5 μM Sytox Green, and 1 μg/mL DAPI prepared in 1× T base and placed on a 10% LB 1.0% agarose pad containing 0.375 μg/mL FM 4–64 and 0.025 μg/mL DAPI.
De Novo Assembly for OT59 and O4M1A.
Paired-end Illumina reads generated on Illumina GAIIx were used for the de novo assembly of the genomes of O4M1A and OT59. The quality-trimmed reads were assembled de novo using the assembler Velvet (v1.2.07) with hash-length parameter of 25 (PubMed Identifier: 18349386). This process resulted in an assembly of 5.4 Mb for O4M1A comprised of 5,793 contigs with an N50 of 1.8 kb. The OT59 genome was assembled into 1,484 contigs corresponding to 5.26 Mb with an N50 of 17.5 kb. Similar to earlier de novo assembly approaches (PMID: 20544019), the assembled genome was annotated using the RAST server (PMID: 18261238) with default parameters, which resulted in 4,231 predicted coding sequences in O4M1A and 4,530 predicted coding sequences in OT59.
Supplementary Material
Acknowledgments
We thank the Government of Panama (Autoridad Nacional del Ambiente and Aquatic Resources Authority of Panama) for granting permission to make the collections of the corals for the isolation of strains OT59 and 04M1A. M.H.M. was supported by The Netherlands Technology Foundation (STW), which is the applied science division of The Netherlands Organization for Scientific Research (NWO) and the Technology Programme of the Ministry of Economic Affairs (Grant STW 10463). R.D.M. acknowledges support from Katholieke Universiteit Leuven Research Council Grant GOA/011/2008. Financial support was provided by National Institute of Health (NIH) Grants GM103809 (to V.V.P.), GM097509 (to B.S.M., N.B., and P.C.D.), GM098105 (to B.Ø.P.) AI095125 (to K.P. and P.C.D.), and GM094802 (to P.C.D.) and the Fogarty International Center’s International Cooperative Biodiversity Groups Program TW006634 (to M.G.). Instrumentation used in this study is supported by Bruker Therapeutic Discovery Mass Spectrometry Center and NIH Grant GMS10RR029121 (to P.C.D.). N.B. was partially supported by the NIH/National Institute of General Medical Sciences Grant 8 P41 GM103485-05.
Footnotes
The authors declare no conflict of interest.
This article is a PNAS Direct Submission.
This article contains supporting information online at www.pnas.org/lookup/suppl/doi:10.1073/pnas.1303471110/-/DCSupplemental.
References
- 1.Corre C, Challis GL. New natural product biosynthetic chemistry discovered by genome mining. Nat Prod Rep. 2009;26(8):977–986. doi: 10.1039/b713024b. [DOI] [PubMed] [Google Scholar]
- 2.Kersten RD, et al. A mass spectrometry-guided genome mining approach for natural product peptidogenomics. Nat Chem Biol. 2011;7(11):794–802. doi: 10.1038/nchembio.684. [DOI] [PMC free article] [PubMed] [Google Scholar]
- 3.de Bruijn I, et al. Genome-based discovery, structure prediction and functional analysis of cyclic lipopeptide antibiotics in Pseudomonas species. Mol Microbiol. 2007;63(2):417–428. doi: 10.1111/j.1365-2958.2006.05525.x. [DOI] [PubMed] [Google Scholar]
- 4.Li MH, Ung PM, Zajkowski J, Garneau-Tsodikova S, Sherman DH. Automated genome mining for natural products. BMC Bioinformatics. 2009;10:185. doi: 10.1186/1471-2105-10-185. [DOI] [PMC free article] [PubMed] [Google Scholar]
- 5.Bode HB, Müller R. The impact of bacterial genomics on natural product research. Angew Chem Int Ed Engl. 2005;44(42):6828–6846. doi: 10.1002/anie.200501080. [DOI] [PubMed] [Google Scholar]
- 6.Maksimov MO, Pelczer I, Link AJ. Precursor-centric genome-mining approach for lasso peptide discovery. Proc Natl Acad Sci USA. 2012;109(38):15223–15228. doi: 10.1073/pnas.1208978109. [DOI] [PMC free article] [PubMed] [Google Scholar]
- 7.Watrous J, et al. Mass spectral molecular networking of living microbial colonies. Proc Natl Acad Sci USA. 2012;109(26):E1743–E1752. doi: 10.1073/pnas.1203689109. [DOI] [PMC free article] [PubMed] [Google Scholar]
- 8.Shendure J, Ji H. Next-generation DNA sequencing. Nat Biotechnol. 2008;26(10):1135–1145. doi: 10.1038/nbt1486. [DOI] [PubMed] [Google Scholar]
- 9.Médigue C, Moszer I. Annotation, comparison and databases for hundreds of bacterial genomes. Res Microbiol. 2007;158(10):724–736. doi: 10.1016/j.resmic.2007.09.009. [DOI] [PubMed] [Google Scholar]
- 10.Markowitz VM, et al. IMG: The Integrated Microbial Genomes database and comparative analysis system. Nucleic Acids Res. 2012;40(Database issue):D115–D122. doi: 10.1093/nar/gkr1044. [DOI] [PMC free article] [PubMed] [Google Scholar]
- 11.Fischbach MA, Walsh CT. Assembly-line enzymology for polyketide and nonribosomal Peptide antibiotics: Logic, machinery, and mechanisms. Chem Rev. 2006;106(8):3468–3496. doi: 10.1021/cr0503097. [DOI] [PubMed] [Google Scholar]
- 12.Finking R, Marahiel MA. Biosynthesis of nonribosomal peptides1. Annu Rev Microbiol. 2004;58:453–488. doi: 10.1146/annurev.micro.58.030603.123615. [DOI] [PubMed] [Google Scholar]
- 13.Donadio S, Monciardini P, Sosio M. Polyketide synthases and nonribosomal peptide synthetases: The emerging view from bacterial genomics. Nat Prod Rep. 2007;24(5):1073–1109. doi: 10.1039/b514050c. [DOI] [PubMed] [Google Scholar]
- 14.Caboche S, et al. NORINE: A database of nonribosomal peptides. Nucleic Acids Res. 2008;36(Database issue):D326–D331. doi: 10.1093/nar/gkm792. [DOI] [PMC free article] [PubMed] [Google Scholar]
- 15.Mossialos D, et al. Identification of new, conserved, non-ribosomal peptide synthetases from fluorescent pseudomonads involved in the biosynthesis of the siderophore pyoverdine. Mol Microbiol. 2002;45(6):1673–1685. doi: 10.1046/j.1365-2958.2002.03120.x. [DOI] [PubMed] [Google Scholar]
- 16.Rausch C, Weber T, Kohlbacher O, Wohlleben W, Huson DH. Specificity prediction of adenylation domains in nonribosomal peptide synthetases (NRPS) using transductive support vector machines (TSVMs) Nucleic Acids Res. 2005;33(18):5799–5808. doi: 10.1093/nar/gki885. [DOI] [PMC free article] [PubMed] [Google Scholar]
- 17.Grünewald J, Marahiel MA. Chemoenzymatic and template-directed synthesis of bioactive macrocyclic peptides. Microbiol Mol Biol Rev. 2006;70(1):121–146. doi: 10.1128/MMBR.70.1.121-146.2006. [DOI] [PMC free article] [PubMed] [Google Scholar]
- 18.Chen Y, et al. A proteomic survey of nonribosomal peptide and polyketide biosynthesis in actinobacteria. J Proteome Res. 2012;11(1):85–94. doi: 10.1021/pr2009115. [DOI] [PMC free article] [PubMed] [Google Scholar]
- 19.Rounge TB, Rohrlack T, Nederbragt AJ, Kristensen T, Jakobsen KS. A genome-wide analysis of nonribosomal peptide synthetase gene clusters and their peptides in a Planktothrix rubescens strain. BMC Genomics. 2009;10:396. doi: 10.1186/1471-2164-10-396. [DOI] [PMC free article] [PubMed] [Google Scholar]
- 20.Wang X, Chen H, Lee J, Reilly PT. Increasing the trapping mass range to m/z = 10(9)—a major step toward high resolution mass analysis of intact RNA, DNA and viruses. Int J Mass Spectrom. 2012;328–329:28–35. doi: 10.1016/j.ijms.2012.07.024. [DOI] [PMC free article] [PubMed] [Google Scholar]
- 21.Denisov E, Damoc E, Lange O, Makarov A. Orbitrap mass spectrometry with resolving powers above 1,000,000. Int J Mass Spectrom. 2012;325–327:80–85. [Google Scholar]
- 22.Watrous JD, Dorrestein PC. Imaging mass spectrometry in microbiology. Nat Rev Microbiol. 2011;9(9):683–694. doi: 10.1038/nrmicro2634. [DOI] [PMC free article] [PubMed] [Google Scholar]
- 23.Lasonder E, et al. Analysis of the Plasmodium falciparum proteome by high-accuracy mass spectrometry. Nature. 2002;419(6906):537–542. doi: 10.1038/nature01111. [DOI] [PubMed] [Google Scholar]
- 24.Zaia J. Mass spectrometry and glycomics. OMICS. 2010;14(4):401–418. doi: 10.1089/omi.2009.0146. [DOI] [PMC free article] [PubMed] [Google Scholar]
- 25.Herring KD, Oppenheimer SR, Caprioli RM. Direct tissue analysis by matrix-assisted laser desorption ionization mass spectrometry: Application to kidney biology. Semin Nephrol. 2007;27(6):597–608. doi: 10.1016/j.semnephrol.2007.09.002. [DOI] [PMC free article] [PubMed] [Google Scholar]
- 26.Marvin LF, Roberts MA, Fay LB. Matrix-assisted laser desorption/ionization time-of-flight mass spectrometry in clinical chemistry. Clin Chim Acta. 2003;337(1-2):11–21. doi: 10.1016/j.cccn.2003.08.008. [DOI] [PubMed] [Google Scholar]
- 27.Claydon MA, Davey SN, Edwards-Jones V, Gordon DB. The rapid identification of intact microorganisms using mass spectrometry. Nat Biotechnol. 1996;14(11):1584–1586. doi: 10.1038/nbt1196-1584. [DOI] [PubMed] [Google Scholar]
- 28.Zhang Z, Cooks RG, Ouyang Z. Paper spray: A simple and efficient means of analysis of different contaminants in foodstuffs. Analyst (Lond) 2012;137(11):2556–2558. doi: 10.1039/c2an35196j. [DOI] [PubMed] [Google Scholar]
- 29.Van Berkel GJ, Pasilis SP, Ovchinnikova O. Established and emerging atmospheric pressure surface sampling/ionization techniques for mass spectrometry. J Mass Spectrom. 2008;43(9):1161–1180. doi: 10.1002/jms.1440. [DOI] [PubMed] [Google Scholar]
- 30.Ferguson CN, Benchaar SA, Miao Z, Loo JA, Chen H. Direct ionization of large proteins and protein complexes by desorption electrospray ionization-mass spectrometry. Anal Chem. 2011;83(17):6468–6473. doi: 10.1021/ac201390w. [DOI] [PMC free article] [PubMed] [Google Scholar]
- 31.Roach PJ, Laskin J, Laskin A. Molecular characterization of organic aerosols using nanospray-desorption/electrospray ionization-mass spectrometry. Anal Chem. 2010;82(19):7979–7986. doi: 10.1021/ac101449p. [DOI] [PubMed] [Google Scholar]
- 32.Takáts Z, Wiseman JM, Gologan B, Cooks RG. Mass spectrometry sampling under ambient conditions with desorption electrospray ionization. Science. 2004;306(5695):471–473. doi: 10.1126/science.1104404. [DOI] [PubMed] [Google Scholar]
- 33.Song Y, Talaty N, Tao WA, Pan Z, Cooks RG. Rapid ambient mass spectrometric profiling of intact, untreated bacteria using desorption electrospray ionization. Chem Commun (Camb) 2007;(1):61–63. doi: 10.1039/b615724f. [DOI] [PubMed] [Google Scholar]
- 34.Pierce CY, et al. Ambient generation of fatty acid methyl ester ions from bacterial whole cells by direct analysis in real time (DART) mass spectrometry. Chem Commun (Camb) 2007;(8):807–809. doi: 10.1039/b613200f. [DOI] [PubMed] [Google Scholar]
- 35.Alberici RM, et al. Ambient mass spectrometry: Bringing MS into the “real world.”. Anal Bioanal Chem. 2010;398(1):265–294. doi: 10.1007/s00216-010-3808-3. [DOI] [PubMed] [Google Scholar]
- 36.Demirev PA, Fenselau C. Mass spectrometry for rapid characterization of microorganisms. Annu Rev Anal Chem (Palo Alto Calif) 2008;1(2008):71–93. doi: 10.1146/annurev.anchem.1.031207.112838. [DOI] [PubMed] [Google Scholar]
- 37.Meetani MA, Shin YS, Zhang S, Mayer R, Basile F. Desorption electrospray ionization mass spectrometry of intact bacteria. J Mass Spectrom. 2007;42(9):1186–1193. doi: 10.1002/jms.1250. [DOI] [PubMed] [Google Scholar]
- 38.Takáts Z, Wiseman JM, Cooks RG. Ambient mass spectrometry using desorption electrospray ionization (DESI): Instrumentation, mechanisms and applications in forensics, chemistry, and biology. J Mass Spectrom. 2005;40(10):1261–1275. doi: 10.1002/jms.922. [DOI] [PubMed] [Google Scholar]
- 39.Keil A, et al. Ambient mass spectrometry with a handheld mass spectrometer at high pressure. Anal Chem. 2007;79(20):7734–7739. doi: 10.1021/ac071114x. [DOI] [PubMed] [Google Scholar]
- 40.Soparawalla S, Tadjimukhamedov FK, Wiley JS, Ouyang Z, Cooks RG. In situ analysis of agrochemical residues on fruit using ambient ionization on a handheld mass spectrometer. Analyst (Lond) 2011;136(21):4392–4396. doi: 10.1039/c1an15493a. [DOI] [PubMed] [Google Scholar]
- 41.Roongsawang N, Washio K, Morikawa M. Diversity of nonribosomal Peptide synthetases involved in the biosynthesis of lipopeptide biosurfactants. Int J Mol Sci. 2010;12(1):141–172. doi: 10.3390/ijms12010141. [DOI] [PMC free article] [PubMed] [Google Scholar]
- 42.Challis GL, Ravel J, Townsend CA. Predictive, structure-based model of amino acid recognition by nonribosomal peptide synthetase adenylation domains. Chem Biol. 2000;7(3):211–224. doi: 10.1016/s1074-5521(00)00091-0. [DOI] [PubMed] [Google Scholar]
- 43.Medema MH, et al. antiSMASH: Rapid identification, annotation and analysis of secondary metabolite biosynthesis gene clusters in bacterial and fungal genome sequences. Nucleic Acids Res. 2011;39(Web Server issue):W339–W346. doi: 10.1093/nar/gkr466. [DOI] [PMC free article] [PubMed] [Google Scholar]
- 44.Rottig M, et al. NRPSpredictor2—a web server for predicting NRPS adenylation domain specificity. Nucleic Acids Res. 2011;39(Web Server issue):W362–W367. doi: 10.1093/nar/gkr323. [DOI] [PMC free article] [PubMed] [Google Scholar]
- 45.Prieto C, García-Estrada C, Lorenzana D, Martín JF. NRPSsp: Non-ribosomal peptide synthase substrate predictor. Bioinformatics. 2012;28(3):426–427. doi: 10.1093/bioinformatics/btr659. [DOI] [PubMed] [Google Scholar]
- 46.Gross H, Loper JE. Genomics of secondary metabolite production by Pseudomonas spp. Nat Prod Rep. 2009;26(11):1408–1446. doi: 10.1039/b817075b. [DOI] [PubMed] [Google Scholar]
- 47.Sansinenea E, Ortiz A. Secondary metabolites of soil Bacillus spp. Biotechnol Lett. 2011;33(8):1523–1538. doi: 10.1007/s10529-011-0617-5. [DOI] [PubMed] [Google Scholar]
- 48.Raaijmakers JM, De Bruijn I, Nybroe O, Ongena M. Natural functions of lipopeptides from Bacillus and Pseudomonas: More than surfactants and antibiotics. FEMS Microbiol Rev. 2010;34(6):1037–1062. doi: 10.1111/j.1574-6976.2010.00221.x. [DOI] [PubMed] [Google Scholar]
- 49.Ongena M, Jacques P. Bacillus lipopeptides: Versatile weapons for plant disease biocontrol. Trends Microbiol. 2008;16(3):115–125. doi: 10.1016/j.tim.2007.12.009. [DOI] [PubMed] [Google Scholar]
- 50.Speitling M, Smetanina OF, Kuznetsova TA, Laatsch H. Bromoalterochromides A and A’, unprecedented chromopeptides from a marine Pseudoalteromonas maricaloris strain KMM 636T. J Antibiot (Tokyo) 2007;60(1):36–42. doi: 10.1038/ja.2007.5. [DOI] [PubMed] [Google Scholar]
- 51.Kalinovskaya NI, et al. “Pseudoalteromonas januaria” SUT 11 as the source of rare lipodepsipeptides. Curr Microbiol. 2008;56(3):199–207. doi: 10.1007/s00284-007-9023-6. [DOI] [PubMed] [Google Scholar]
- 52.Xie BB, et al. Genome sequences of type strains of seven species of the marine bacterium Pseudoalteromonas. J Bacteriol. 2012;194(10):2746–2747. doi: 10.1128/JB.00265-12. [DOI] [PMC free article] [PubMed] [Google Scholar]
- 53.Smoot ME, Ono K, Ruscheinski J, Wang PL, Ideker T. Cytoscape 2.8: New features for data integration and network visualization. Bioinformatics. 2011;27(3):431–432. doi: 10.1093/bioinformatics/btq675. [DOI] [PMC free article] [PubMed] [Google Scholar]
- 54.Cline MS, et al. Integration of biological networks and gene expression data using Cytoscape. Nat Protoc. 2007;2(10):2366–2382. doi: 10.1038/nprot.2007.324. [DOI] [PMC free article] [PubMed] [Google Scholar]
- 55.Shannon P, et al. Cytoscape: A software environment for integrated models of biomolecular interaction networks. Genome Res. 2003;13(11):2498–2504. doi: 10.1101/gr.1239303. [DOI] [PMC free article] [PubMed] [Google Scholar]
- 56.Moree WJ, et al. Interkingdom metabolic transformations captured by microbial imaging mass spectrometry. Proc Natl Acad Sci USA. 2012;109(34):13811–13816. doi: 10.1073/pnas.1206855109. [DOI] [PMC free article] [PubMed] [Google Scholar]
- 57.Bachmann BO, Ravel J. Chapter 8. Methods for in silico prediction of microbial polyketide and nonribosomal peptide biosynthetic pathways from DNA sequence data. Methods Enzymol. 2009;458:181–217. doi: 10.1016/S0076-6879(09)04808-3. [DOI] [PubMed] [Google Scholar]
- 58.Rokni-Zadeh H, et al. Genetic and functional characterization of cyclic lipopeptide white-line-inducing principle (WLIP) production by rice rhizosphere isolate Pseudomonas putida RW10S2. Appl Environ Microbiol. 2012;78(14):4826–4834. doi: 10.1128/AEM.00335-12. [DOI] [PMC free article] [PubMed] [Google Scholar]
- 59.Rausch C, Hoof I, Weber T, Wohlleben W, Huson DH. Phylogenetic analysis of condensation domains in NRPS sheds light on their functional evolution. BMC Evol Biol. 2007;7:78. doi: 10.1186/1471-2148-7-78. [DOI] [PMC free article] [PubMed] [Google Scholar]
- 60.Edwards DJ, et al. Structure and biosynthesis of the jamaicamides, new mixed polyketide-peptide neurotoxins from the marine cyanobacterium Lyngbya majuscula. Chem Biol. 2004;11(6):817–833. doi: 10.1016/j.chembiol.2004.03.030. [DOI] [PubMed] [Google Scholar]
Associated Data
This section collects any data citations, data availability statements, or supplementary materials included in this article.