

Abstract
Essential genome transactions, such as homologous recombination, are achieved by concerted and dynamic interactions of multiple protein components with DNA. Which proteins do what and how, will be reflected in their relative arrangements. However, obtaining high-resolution structural information on the variable arrangements of these complex assemblies is a challenge. Here we demonstrate the versatility of a combined total internal reflection fluorescence and scanning force microscope (TIRF-SFM) to pinpoint fluorescently labeled human homologous recombination protein RAD54 interacting with presynaptic (ssDNA) and postsynaptic (dsDNA) human recombinase RAD51 nucleoprotein filaments. Labeled proteins were localized by superresolution imaging on complex structures in the SFM image with high spatial accuracy. We observed some RAD54 at RAD51 filament ends, as expected. More commonly, RAD54 interspersed along RAD51–DNA filaments. RAD54 promotes RAD51-mediated DNA strand exchange and has been described to both stabilize and destabilize RAD51–DNA filaments. The different architectural arrangements we observe for RAD54 with RAD51–DNA filaments may reflect the diverse roles of this protein in homologous recombination.
Keywords: DNA break repair, genome stability, DNA–protein interaction, image registration, single-molecule microscopy
To understand how proteins cooperate to perform elaborate genome transactions, we need to know how they are arranged relative to each other in functional complexes. Determining the structure of such complex and often variable assemblies is a challenge. The scanning force microscope (SFM) is ideal for visualizing DNA–protein assemblies under native conditions at a resolution limited by the radius of curvature of the scanning tip (usually 5–10 nm) (1–3). This method is limited because identification of specific proteins in heterogeneous assemblies depends on distinct structural features, whereas most proteins have a similar globular shape. Molecular recognition in high-resolution SFM images can be achieved by combining SFM with a fluorescence microscope capable of single-fluorescence detection (4–6). By labeling individual proteins or single DNA molecules, it is possible to distinguish the position of different components in a highly resolved complex.
The multiprotein complexes of homologous recombination (HR) are an ideal example to establish methods for hybrid microscopy that can be validated on the basis of known structures and used to describe unknown arrangements. HR is a mesoscale DNA rearrangement process achieved by the coordinated action of several proteins and used for DNA repair (7, 8). In the core reaction of HR, human recombinase RAD51–DNA filaments search and invade homologous undamaged dsDNA. After strand exchange between the invading ssDNA and its complement, the homologous strand of the duplex is used as template for repair synthesis. Genetic and biochemical evidence show that several mediator proteins, such as RAD54, are required to regulate RAD51 nucleoprotein filament function and properly control recombination (7, 9, 10).
The accumulated in vivo and in vitro data on RAD54 function is consistent with roles for this protein in HR before, during, and after synapsis (ie, at almost every step of the reaction). Many of the likely roles of RAD54 involve interaction with RAD51–DNA filaments. Interaction between Rad54 and Rad51 are functionally important both in yeast (11) and in humans (12). The dsDNA-dependent ATPase activity of Rad54 (13, 14) is enhanced by Rad51–DNA complexes (13). Depletion of RAD54 in mammalian cells results in abnormal distribution of RAD51 on chromosomes (15), and RAD54 ATPase activity is associated with protein turnover in DNA repair foci (16). Oligomers of yeast Rad54 have been observed at the end of Rad51–dsDNA filaments by electron microscopy (EM) (17), leading to the suggestion of processive Rad51-filament dissociation by a translocating Rad54 complex to set the stage for downstream events (18). However, other arrangements are possible and may be important for mediating HR.
To understand the multiple and sometimes conflicting roles of RAD54 in HR, we determined the relative position of RAD54 and RAD51 proteins bound to DNA. Using a hybrid total internal reflection fluorescence (TIRF)-SFM microscope, we revealed the structure and composition of higher-order DNA–protein complexes under native conditions. Notably, using this approach, we detected different arrangements of human RAD54 commonly interspersed among RAD51 filament patches on dsDNA and interacting at multiple sites with RAD51–ssDNA presynaptic filaments. The differential arrangements of the protein components may provide the basis for different functions of RAD54 in controlling RAD51 activity.
Results
Locating Specific Proteins in Complex Assemblies on DNA by Hybrid TIRF-SFM Microscopy.
To identify RAD54 proteins in RAD51–DNA complexes, we used a hybrid TIRF-SFM system (6) capable of single-fluorophore detection and nanometer-scale topography of the same sample (Fig. 1). Our experimental approach was to form RAD51 filaments on linear dsDNA and ssDNA in conditions that inhibited ATPase activity (ATP-Ca2+) (19). The filaments were incubated with biotinylated RAD54 that was subsequently labeled with streptavidin, Alexa Fluor 633 conjugate (AF633-streptavidin). Efficient and practical use of a hybrid TIRF-SFM system for single-molecule studies requires a suitable substrate for both techniques. Samples must be deposited on a surface that is transparent for optical imaging with roughness less than the size of the object to be analyzed (6). We found that a thin layer of mica glued to a thin coverslip was sufficiently flat, transparent, and thin enough for the working distance of our TIRF objective.
Fig. 1.
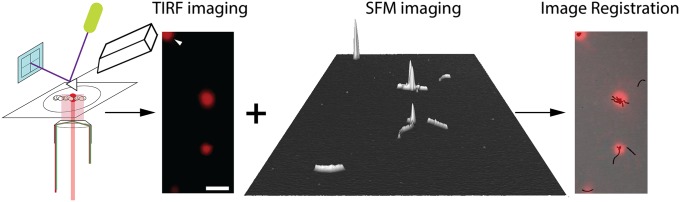
TIRF-SFM microscopy localizes RAD54 protein on RAD51–DNA filaments. Schematic representation of the set-up; the sample, RAD54–dsDNA–RAD51 complex, is on a transparent and flat substrate made of mica and glass. The sample is first imaged with the TIRF system situated below and then scanned with the SFM. The resulting images, fluorescence (in color) and topographic (in black and white), are then registered (overlaid). White arrow indicates one fiducial fluorosphere; the three red spots are, from top to bottom, a cluster of RAD51–DNA filaments associated via a large globular RAD54 structure, a RAD51–DNA filament with a large globular RAD54 structure, and a RAD51–DNA filament with RAD54 interspersed, respectively. (Scale bar, 500 nm.)
Hybrid microscopes present the common challenge of registering different types of data. The software provided with our SFM microscope permitted a straightforward combination of the different images but with registration accuracy below that needed for nanometer precision localization (6). We have previously described the use of fluorescent fiducials for image registration (6, 20). Here, additional software routines were developed and validated for consistent accurate and convenient image registration. DNA–protein complexes were observed by TIRF and SFM, and both images were registered for accurately localizing labeled RAD54 relative to the end of the RAD51–dsDNA and RAD51–ssDNA filaments.
Image Processing to Accurately Map Fluorophores onto Topography.
Precise determination of the number and position of single-fluorophore molecules in molecular complexes with nanometer dimensions requires proper data acquisition and dedicated analytical tools. Acquisition of TIRF images consisted of taking 300 sequential frames (exposure time, 300 ms) from the same area. This had a threefold purpose: to increase the signal-to-noise ratio, correct for potential drift during the acquisition procedure, and extract intensity traces over time from selected regions. This stack of images was used to create a maximum-intensity composite image that allowed calculation of a background image and identification of the regions of interest (ROIs) (Fig. S1). SFM images were acquired by scanning large areas of 35 × 35 μm (4,096 × 4,096 pixels) at a line rate of 0.2 Hz. This imaging procedure avoided image distortion cause by piezo hysteresis, and drift in the stage was undetectable (Fig. S2). We developed custom software in MATLAB that permits fully controlled analysis of the TIRF-SFM data (see flowchart illustrating the procedure in Fig. 2). The algorithm has three differentiated goals: localizing the position of the fiducials and the sample from the fluorescence signals, image registration of TIRF and SFM images, and quantification of the amount of fluorescence for each ROI.
Fig. 2.

Accurate image processing of TIRF-SFM images requires versatile software tools. Flowchart describing the procedure followed for data analysis divided in three steps. (A) Pointillistic determination of the position of fiducials and RAD54 from the fluorescence signals. (B) Registration of fluorescence and topographical coordinates by global least-squared transformation. (C) Quantification of the fluorescence signal with a step-fitting algorithm.
For determining the position of fluorescent signals on structures defined by topography, we needed to know how certain the position and registration were. Our instrument offered the unique possibility of assessing the accuracy of these measurements. Fiducial position calculated from TIRF images could be compared with the reference position in the SFM image. The difference in these quantities defined the error. The uncertainty is expressed by the SD. Locations of fiducials and RAD54 molecules from the optical image (Fig. 2A and Fig. S1) were calculated as follows: The signal of the first 10 consecutive frames was accumulated (3 s total exposure time) in a single frame. From each ROI, the mean of the intensity distribution was calculated after fitting with a 2D Gaussian function by nonlinear least-squares method. This operation was repeated with the next 10 consecutive frames until frame 291, generating a cluster of successful positions per ROI (SD < 200 nm and coefficient of determination, R2 > 0.9). Finally, from each ROI, both from the fiducials and RAD54, the centroid of the cluster (x, y ± SD optical) was estimated from a normal fitting. For examples with multiple RAD54 molecules along RAD51–ssDNA filaments, we increased resolution by analyzing each 0.3-s-exposure frame in the fitting procedure and reduced the threshold for position identification (SD < 200 nm and coefficient of determination, R2 > 0).
Image registration of TIRF and SFM images (Fig. 2B and Fig. S3) was achieved by matching the “optical” centroid with the “topographic” center of mass of the fiducials (A, B, and C in Fig. 2B), using a global least-squared transformation (21). The generated matrix contained the scaling (S) and translation factor (T) in the x and y axis that was necessary for localizing the unknown sample (Fig. 2 B and D). The uncertainty associated with this mapping (σregistration) was calculated by leaving out a single fiducial at a time and calculating a map with the rest, as described in ref. 22. Finally, we quantified the number of fluorophores per ROI by using the stepwise photobleaching of single fluorophores (Fig. 2C and Fig. S1C). Individual frames were corrected for background and ROIs selected, as performed previously. From each ROI, the intensity (N) trace over time was extracted. Intensity variations were estimated by a step-fitting algorithm (23, 24), and the intensity of a single fluorophore was defined as the average step size for each ROI. This number (ΔN) divided by the maximum N in the ROI represents the estimated number of fluorophores.
Proof of Concept: Find a Single Fluorophore at One DNA End.
To validate our method, we imaged a 1-kbp dsDNA fragment labeled with a single fluorophore attached to one strand at the 5′ end. Fluorescent polystyrene beads, 40 nm in diameter, were used as fiducials. The sample was first illuminated with a 633-nm laser to excite the Alexa 647 fluorophore on DNA, and the emission images were collected as a stack of 300 frames. After that, the fiducials were excited with a 488-nm laser, and another image stack with the same number of frames was collected. Then the same area was scanned with the SFM. Centroid position from the DNA-end fluorophore and from the fiducials was calculated and registered with the SFM image, as mentioned earlier. DNA fragments in the SFM images measured 335 ± 53 nm (SD) in length without any notable additional structural features (Fig. 3). Large, 40-nm-high objects corresponding to the fiducials were clearly identified in positions not interfering with the DNA sample in the SFM image. Fiducial coordinates in the optical image were determined with an average uncertainty of 3.3 ± 0.75 nm (SD) in x and 3.9 ± 1.5 nm (SD) in y. The coordinates of fluorescent signal from the DNA were determined with an average uncertainty of 6.3 ± 4.1 nm (SD) in x and 5.8 ± 4.6 nm (SD) in y (Fig. 3 D and E). The smaller uncertainty in fiducial localization was a consequence of the higher number of photons collected from these very bright objects. The position of fluorophores relative to the DNA molecules was plotted as a two-color cross overlaid on the SFM image representing the registration uncertainty in x (yellow) and y (red), (Fig. 3 A–C). These calculated positions registered well to one end of the DNA molecules in the SFM topographic image. To determine the actual error in localizing the fluorophores, we measured the distance between the fluorescent signal centroid and the closest end of the matched DNA fragment (Fig. 3 A–C green line). The averaged error for 80 molecules was 53 ± 57.5 nm (SD) (Fig. 3F). We also extracted the intensity traces from 144 ROIs corresponding to singly labeled DNA molecules. After applying the described procedure for intensity analysis, we estimated the number of fluorophores per ROI with an average of 1.4 ± 0.6 (SD) (Fig. S4A). This fractional number reflects the averaging procedure applied for the calculation of the step size in each ROI (ΔN).
Fig. 3.

TIRF-SFM microscopy localizes single fluorophores in topographic images of small DNA fragments. (A–C) Three examples of localization of a single fluorophore at one end of a DNA molecule after TIRF-SFM imaging and analysis. The two-color crosses overlaid on the SFM images (300 × 300 nm) represent the registration uncertainty in x (yellow) and y (red) generated by the sum in quadrature of σoptical(xy) (D and E) and the SD of the mapping procedure (σregistration). Yellow lines represent the measured error between the calculated position of the fluorophore and the actual position of the DNA end, as determined by SFM. (D and E) Distribution analysis of the SD (σoptical(xy)) in x and y coordinates after analyzing the optical images. (F) Distribution analysis of the measured error (green lines); red lines are normal fitting to the histograms with average μ.
Human RAD54 in Expected and Unexpected Locations Along the RAD51 Filament.
EM imaging could distinguish the large structure of oligomeric ScRad54 at the end of Rad51–dsDNA filaments (17). However, possible association of Rad54 with Rad51 filaments that will not change their overall dimensions would not have been detected by this method. We chose this protein–DNA complex, RAD54 in association with RAD51–DNA filaments, to investigate the relative arrangement of these two proteins with dsDNA and ssDNA. For this, we first developed a convenient method for labeling RAD54 without significantly disturbing its biochemical activities (Fig. S5). Human RAD54 was expressed with an AviTag sequence (25), biotinylated in vivo, and purified. AF633-streptavidin was used for localization of biotinylated RAD54. Image analysis from samples of AF633-streptavidin alone was used to determine the degree of labeling, which was on average 2.7 dye molecules per streptavidin. We analyzed the intensity trace of 740 ROIs from isolated AF633-streptavidin molecules and, after applying the described procedure, estimated the number of fluorophores per streptavidin to be higher than one and lower than five in 93% of the cases (Fig. S4B). Incorporation of biotin in RAD54 protein was confirmed by specific interaction with streptavidin-coated magnetic beads (Fig. S5A). The biotinylated protein maintained dsDNA-dependent ATPase activity (Fig. S5B); it is stimulated by dsDNA partially coated with RAD51 (Fig. S5C), and it stimulated DNA strand invasion activity of RAD51 (Fig. S5D). We have shown previously by SFM that RAD54 oligomerizes in the presence of dsDNA (26). This activity was used to monitor the detection of biotinylated RAD54 with AF633-streptavidin by quantifying the number of DNA–RAD54 complexes with fluorescent signal. RAD54–DNA complexes labeled with AF633-streptavidin were deposited on a mica-glass substrate and visualized by TIRF-SFM (Fig. 4). The efficiency of RAD54 identification was more than 78%; 37 of 47 complexes visualized by SFM also contained fluorescent signal observed in the TIRF image.
Fig. 4.
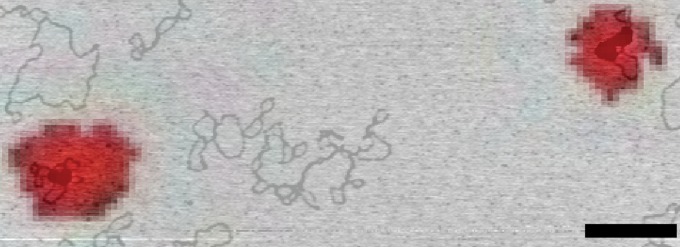
Biotinylated RAD54 oligomerizes on supercoiled dsDNA. Visualization of bioRAD54- circular dsDNA complex. The overlay of the TIRF and SFM images highlights the presence of RAD54 (red signal) in the protein complex after labeling with AF633-streptavidin. Overlay made with JPK Image Processing software. (Scale bar, 500 nm.)
The position of RAD54 associated with RAD51–dsDNA or RAD51–ssDNA filaments was determined. RAD51–DNA filaments were assembled on DNA in the presence of ATP-Ca2+. In this condition, ATP hydrolysis by RAD51, but not that of RAD54, is inhibited, increasing the stability of the filaments (1, 19, 27). RAD54 (1:30 ratio, protein monomers per bp or nt) was then added. Finally, AF633-streptavidin was included in the reaction and the RAD51–DNA–RAD54–AF633-streptavidin complexes were visualized by TIRF-SFM (Fig. 5). The centroid position of the fluorescent signal from AF633-streptavidin was determined and mapped over an SFM image of the same visualized area. The complexes in the SFM image that also showed fluorescence were classified into three types on the basis of appearance (Fig. 5 A–C for RAD51–dsDNA and Fig. 5 D–F for RAD51–ssDNA). Class 1 were filaments with a large globular structure at one end, class 2 were collapsed filaments or clusters associated via a large globular structure, and class 3 consisted of isolated filaments without any special terminal structure. In the case of RAD51–dsDNA filaments, only a minority of complexes (four of 52 complexes visualized in a total of 15 images from five different experiments) had a fluorescent RAD54 signal associated with a distinct larger structure at the end of the filament (class 1) similar to those observed previously by EM (17) (Fig. 5A). The size of this oligomeric RAD54 was similar to that observed on dsDNA alone (Fig. 4). In the somewhat more prevalent class 2 complexes (38% of the filaments with associated fluorescence), the fluorescent signal was associated with large structure that held several filaments together (Fig. 5B). The fluorescence intensity correlates well (r = 0.8, Pearson coefficient) with the measured volume of the structure. Unexpectedly, the majority of filaments with associated fluorescence (54%, class 3) had a regular shape that is typical of RAD51 alone, indicating RAD54 dispersed among RAD51 in the filaments.
Fig. 5.

TIRF-SFM imaging reveals different binding modes of human RAD54 on dsDNA and ssDNA RAD51 nucleofilaments. (A) Three-dimensional view of a class 1 RAD51–dsDNA–RAD54 complex imaged by SFM (Upper, 1 × 1 μm) and localization of fluorophores after TIRF-SFM imaging and analysis (Lower). The two-color crosses overlaid on the SFM images represent the registration uncertainty in x (yellow) and y (red). (B) Three-dimensional view of a class 2 RAD51–dsDNA–RAD54 complex and localization of fluorophores. (C) Class 3 complexes visualized as described earlier. The 3D view of this kind of filaments shows a regular shape. However, the fluorescence signal reveals the position of RAD54 interspersed among RAD51 in the filament on DNA. (D) Class 1 RAD51–ssDNA–RAD54 complex imaged by SFM (Upper, 0.5 × 0.5 μm) and localization of fluorophores after TIRF-SFM imaging and analysis (Lower). (E) Class 2 RAD51–ssDNA–RAD54 complex. (F) Class 3 RAD51–ssDNA–RAD54 complex.
The topographic images of these complexes were indistinguishable from RAD51–dsDNA filaments formed in the absence of RAD54 (Fig. 5C). The filaments including RAD54 measured 470 ± 96 (SD) nm, indicating that the 1-kbp DNA fragment was stretched by the expected 50% after RAD51 polymerization and that it was comparable to the length of filaments without associated fluorescence [496 ± 97 (SD) nm]. Adding AF633-streptavidin to RAD51 filaments in the absence of RAD54 did not show any associated fluorescence (113 filaments analyzed), indicating the fluorescent signal was specific for RAD54. The position of RAD54 was determined with an average uncertainty of 61 ± 17 (SD) nm in x and y and was found at any place along the filaments. The number of fluorophores per filament ranged between one and four in 27 of the 28 complex of class 3; the remaining filament had eight fluorophores, indicating the presence of more than one RAD54 monomer. The distribution of classes did not change on glutaraldehyde fixation; here also the median number of fluorophores from 32 class 3 filaments was 4.5 (Fig. S4C). These data, together with the absence of a significant increase in the size of the filaments compared with no-RAD54 conditions, indicated that only one or a few monomers of RAD54 were present and apparently interspersed among RAD51s in the filament on dsDNA.
With ssDNA, the arrangement of RAD54 with RAD51 filaments showed a very different spectrum of complexes. Most of the complexes (154 of 209 visualized in a total of seven images from two different experiments) with fluorescence signal were small in size (smaller than 200 nm) and difficult to assess. Cross-linking of the complex with glutaraldehyde increased the number of bigger complexes (205 of 417 visualized in a total of 15 images from four different experiments) without having an effect on the distribution of the different classes. In general, filaments were more irregular [as observed previously by SFM (1)], reflecting the different binding mode of RAD51 with dsDNA and ssDNA. However, we could classify them in equivalent groups. Elongated complexes with a distinguishable structure with associated fluorescence at one of the ends represented 18% of the total (Fig. 5D). Almost half of the complexes (45%) appeared as class 2 (Fig. 5E). The remaining complexes (37% class 3) were elongated, similar to the RAD51–dsDNA class 3. The RAD51–ssDNA class 3 complexes had pronounced irregularities along the axis (Fig. 5F) if compared with no-RAD54 conditions. Fluorescence analysis of class 3 revealed the localization of multiple RAD54 proteins distributed along the filament. The median number of fluorophores per filament was six (Fig. S4C). In conclusion, more RAD54 proteins were associated with RAD51–ssDNA filaments than with RAD51–dsDNA filaments. The interaction was multiple and found along the filaments, which favored higher-level interactions between presynaptic complexes and RAD54.
Discussion
The different positions of RAD54 associated with RAD51 filaments we observed suggest multiple mechanisms for controlling RAD51 recombination activity. Our results show that RAD54 interacts differently with RAD51–dsDNA and RAD51–ssDNA filaments: RAD54 is present at a single location along the RAD51–dsDNA filaments, often intercalated as one or a few monomers, perhaps between the discontinuous RAD51 filament patches (28, 29). We present unique structural information on the architecture of RAD54 in complex with RAD51–ssDNA filaments. This revealed that RAD54 interacts at multiple positions along the RAD51–ssDNA filament, using the same-length DNA, possibly indicating that the RAD51 domain interacting with RAD54 is accessible at more positions along the nucleoprotein filament formed on ssDNA. We used TIRF-SFM, an imaging system that combines nanometer resolution with color identification of single molecules, to reveal structural features of the RAD51–DNA–RAD54 complexes inaccessible with other techniques; overall arrangement, length/size, position of marker, and protein identification are correlated directly on the same sample.
One of our goals was to develop tools that would make TIRF-SFM as accessible as any of the individual techniques for use in more laboratories. We developed a reproducible and versatile use of the hybrid TIRF-SFM system for single-molecule studies based on three fundamental concepts. First, flatness and transparency of the sample, which we achieved by gluing a few layers of mica to a thin glass coverslip (6, 20). The advantages over using only glass (4, 30) or only mica (5) are the improved visibility of DNA and mechanical stability, respectively. Second, image registration with nanometer resolution requires nanometer-size fiducial markers unrelated to the analyzed molecules. Fluorescent beads have these features, with a shape and size distinguishable from DNA–protein complexes. Registration uncertainty is smaller, using smaller objects such as quantum dots (5). However, because of the heterogeneous emission signal (6, 31) and size similar to many proteins, quantum dots are unreliable fiducials for the study of the DNA–protein complex. Third, identification and analysis of molecules labeled with single fluorophores from TIRF-SFM images requires open software tools that combine superresolution approaches with image registration routines that can be adapted to particular situations. We developed a software package that localizes the fluorescent signal of labeled proteins by fitting individual point-spread functions of each fluorophore (32). To increase the accuracy of the method, low-quality fits are rejected (33). The average position of the resulting fittings with low uncertainty (∼3 nm for the fiducials and ∼6 nm for DNA or proteins) was used for registration in the SFM image (21). This time-lapse acquisition of data also allows determining the number of labeled molecules with appropriate control samples and calibration by counting fluorophores per ROI (24).
RAD54 has multiple functions mediating RAD51 strand exchange activity, supported by numerous biochemical and in vivo experiments (as reviewed in ref. 34). RAD54 facilitates DNA strand exchange between a RAD51 presynaptic filament on ssDNA and a homologous dsDNA partner (35) (Fig. S5D). Although the detailed molecular mechanism of this remains unknown, several possibilities based on biochemical and cell biology behavior of RAD54 include RAD51–ssDNA filament stabilization by RAD54 in a manner independent of RAD54 ATPase activity; RAD54 ATPase-driven translocation along target dsDNA, inducing topology changes that favor strand invasion; and RAD54 ATPase activity clearing RAD51 that is inappropriately bound to dsDNA. Furthermore, in a postsynaptic stage, after dsDNA invasion has taken place, RAD54 likely removes RAD51 from the joint molecule to provide access for DNA polymerase (34).
These diverse activities could result from diverse RAD54–RAD51–DNA complexes in which the components are arranged differently, as we observe. Here we propose possibilities for functions consistent with the different complexes we observe. In class 1 RAD51–dsDNA complexes, oligomeric RAD54 is at the end of the filaments in agreement with previous results using EM (17). This arrangement would be useful after strand exchange in which RAD51/RAD54 are bound to the dsDNA product of HR. The oligomeric RAD54 as an active ATPase on dsDNA could enhance RAD51 dissociation (36, 37). This role is supported by the observation that dissociation of RAD51 from chromatin is impaired in cells expressing ATPase-defective RAD54 (16). However, the same arrangement with RAD54 oligomers associated at the end of RAD51 filaments on ssDNA is consistent with ATPase-independent filament stabilization described in vitro because RAD54 ATPase activity is not stimulated by ssDNA. Stabilization of presynaptic filaments is consistent with the in vivo observations that although RAD51 accumulation at DNA damage is attenuated in cells lacking RAD54 protein, it is normal in cells expressing ATPase-defective RAD54 (16). The ssDNA filament-associated RAD54 oligomers maybe functional on encounter with target dsDNA to potentially facilitate homology search.
We interpret class 2 complexes, both with dsDNA and ssDNA, as RAD54-mediated association of multiple filaments or different regions of the same filament. This could reflect nonspecific interactions, but we favor the idea that it is a result of specific self-interaction of RAD54s, some of which are bound to DNA and RAD51. Because oligomers are the form of the protein that translocates on dsDNA and can change DNA topology (17, 26, 38–40), we speculate that association of filament-bound RAD54 could promote ATP-dependent movement of linked presynaptic filaments and target dsDNA to facilitate homology search or strand exchange.
The most common arrangement we observed was RAD51 filaments with one or a few RAD54 monomers intercalated along the filaments (class 3 complexes). This arrangement could not have been detected by the previous EM experiments. One possibility is that this particular association of RAD54 with RAD51 filaments is DNA-dependent. The amount of RAD54 associated with RAD51–ssDNA and dsDNA complex would then reflect filament formation as incomplete patches, as previously described based on the nucleation and extension rates of RAD51 (29, 41). This proposed arrangement of one or few RAD54s adjacent to a RAD51 filament patch end is consistent with an ATPase-independent role stabilizing RAD51 filaments (42). RAD54 interacts with RAD51 independent of DNA (12). DNA-independent interaction possibly accounts for the association of RAD54 with RAD51 filaments. In this case, more RAD54 associated with RAD51 filaments on ssDNA could indicate that the interaction domain is exposed more often when bound to ssDNA. If RAD54 in class 3 complexes associated along filaments become nucleation sites for RAD54 oligomer formation, then ATP-dependent roles in RAD51 disassembly, homology search, or strand exchange as indicated earlier also could develop from this form.
Architecturally diverse arrangements among components of protein–DNA complexes can allow the same mediators to affect reactions in multiple ways. The TIRF-SFM approach we described here is ideally suited to explore the generality of this concept.
Materials and Methods
Sample Preparation for TIRF-SFM Visualization.
DNA–protein complexes were visualized as follows. RAD54 was incubated with circular dsDNA M13mp18 RFI (1:50 ratio, protein per bp) in buffer containing 20 mM Hepes⋅KOH (pH 7.5), 10 mM KCl, 10 mM MgCl2, and 2 mM ATP. After incubation at 30 °C for 10 min, glutaraldehyde was added to a final concentration of 0.1%, followed by additional incubation at 30 °C for 5 min. After quenching glutaraldehyde with Tris⋅HCl (10 mM at pH 7.5), complexes were labeled with AF633-streptavidin (1:25 ratio, RAD54 per streptavidin). Unbound label was separated by size-exclusion chromatography.
Nucleoprotein filaments, RAD51-coated DNA, were made by incubation of a PCR fragment of 1,000 bp (or nt) and human RAD51 in the presence of ATP-Ca2+, as previously described (28). Briefly, DNA (1.5 μM in bp or nt) were incubated in binding buffer (Tris⋅HCl at pH 7.5, 60 mM KCl, 2 mM CaCl2, 1 mM DTT, and 1 mM ATP) with RAD51 (1 μM) for 5 min at 30 °C. RAD54 (0.03 μM) or buffer was then added and incubated for 5 min more. Where indicated, glutaraldehyde was added to a final concentration of 0.1%, followed by additional incubation at 30 °C for 5 min and quenching with Tris⋅HCl (10 mM at pH 7.5). Finally, the labeled streptavidin (0.75 μM) was added and incubated for an additional 5 min. Labeled protein–DNA binding reactions were fractionated on a Sepharose CL-4B (Sigma) column equilibrated with binding buffer. Fractions (30 μL) were collected drop-wise in a 96-multiwell plate and imaged with a Typhoon Trio scanner (GE Healthcare). Images obtained were analyzed with ImageQuant version 5.2 (Molecular Dynamics). Fractions containing only fluorescent streptavidin were discarded. Fractions containing DNA–protein complexes were diluted in 10 mM Hepes⋅KCl at pH 7.5, 2 mM MgCl2 buffer with 3 pM TransFluospheres. Samples were deposited on freshly cleaved mica (muscovite V-1 quality, from Electron Microscopy Science) mounted on glass coverslips (24-mm round from Menzel-glazer, thickness 000), after eliminating autofluorescence by reduction with a drop of sodium borohydride (43) (0.25% wt/vol) for 20 min at room temperature, as previously described (6, 20). After 1 min, the sample drop was rinsed with MilliQ water and dried with filtered air. Labeled DNA was visualized by incubating 1 ng of the PCR product in deposition buffer (10 mM Hepes⋅KCl at pH 7.5, 2 mM MgCl2) with 3 pM TransFluospheres, as described earlier. Description of proteins and DNA substrates can be found in SI Materials and Methods.
TIRF-SFM Setup.
Samples were observed with a Nikon TE 2000U microscope. Excitation source beams at 488 and 633 nm (Melles Griot) were used for TIRF illumination through a Nikon 100× (NA 1.45) oil objective. Fluorescence emission was collected by the objective, passed through a Z488/647rpc Dual Laser filter (Chroma), one for each excitation source. Back reflection from the lasers was eliminated further by 405/488/557/640-nm StopLine quad-notch filter (Semrock). Imaging was performed with a Cascade II:512B EMCCD camera (Princeton Instruments) driven by MetaMorph 6.3.r3. Scanning force microscopy was done with a NanoWizardII scanner (JPK Instruments) mounted on the fluorescence microscope, as previously described (6, 20). Air-dried samples were scanned in intermittent contact mode (air). Silicon Tapping/Non-Contact Mode tips 125 μm in length with a spring constant of 25–75 N/m were from Applied Nanostructures. Drive frequency of the cantilevers used was on average 300 kHz. Correlation of fluorescence and topographic images was accomplished first by the JPK DirectOverlay software and then refined to nanometer accuracy ,as described in Results.
Data Analysis.
Stacks of frames were acquired with MetaMorph 6.3.r3 software and processed with ImageJ and MATLAB 7.12. Analysis was performed with custom-made software written in MATLAB (available at http://cluster15.erasmusmc.nl/TIRF-SFM-scripts).
Supplementary Material
Acknowledgments
We thank J. Lebbink, I. Pfeiffer, and M. Reuter for helpful comments on the manuscript. Our work is supported by grants from the Netherlands Organization for Scientific Research (TOP to R.K. and VICI 700.56.441 to C.W.), CancerGenomiCs.nl (Netherlands Organization for Scientific Research gravitation), Marie Curie Intra-European Fellowship (FP7-221069), and Reintegration Grant FP7-276898 (to H.S.). This work is supported by NanoNextNL, a micro and nanotechnology consortium of the Government of the Netherlands and 130 partners.
Footnotes
The authors declare no conflict of interest.
This article is a PNAS Direct Submission.
This article contains supporting information online at www.pnas.org/lookup/suppl/doi:10.1073/pnas.1306467110/-/DCSupplemental.
References
- 1.Ristic D, et al. Human Rad51 filaments on double- and single-stranded DNA: Correlating regular and irregular forms with recombination function. Nucleic Acids Res. 2005;33(10):3292–3302. doi: 10.1093/nar/gki640. [DOI] [PMC free article] [PubMed] [Google Scholar]
- 2.Ristic D, Kanaar R, Wyman C. Visualizing RAD51-mediated joint molecules: Implications for recombination mechanism and the effect of sequence heterology. Nucleic Acids Res. 2011;39(1):155–167. doi: 10.1093/nar/gkq766. [DOI] [PMC free article] [PubMed] [Google Scholar]
- 3.Bustamante C, Keller D, Yang G. Scanning force microscopy of nucleic acids and nucleoprotein assemblies. Curr Opin Struct Biol. 1993;3(3):363–372. [Google Scholar]
- 4.Ebenstein Y, Gassman N, Kim S, Weiss S. Combining atomic force and fluorescence microscopy for analysis of quantum-dot labeled protein-DNA complexes. J Mol Recognit. 2009;22(5):397–402. doi: 10.1002/jmr.956. [DOI] [PMC free article] [PubMed] [Google Scholar]
- 5.Fronczek DN, et al. High accuracy FIONA-AFM hybrid imaging. Ultramicroscopy. 2011;111(5):350–355. doi: 10.1016/j.ultramic.2011.01.020. [DOI] [PMC free article] [PubMed] [Google Scholar]
- 6.Sanchez H, Kanaar R, Wyman C. Molecular recognition of DNA-protein complexes: A straightforward method combining scanning force and fluorescence microscopy. Ultramicroscopy. 2010;110(7):844–851. doi: 10.1016/j.ultramic.2010.03.002. [DOI] [PMC free article] [PubMed] [Google Scholar]
- 7.Holthausen JT, Wyman C, Kanaar R. 2010. Regulation of DNA strand exchange in homologous recombination. DNA Repair (Amst) 9(12):1264-1272. [DOI] [PubMed]
- 8.Wyman C, Kanaar R. DNA double-strand break repair: All’s well that ends well. Annu Rev Genet. 2006;40:363–383. doi: 10.1146/annurev.genet.40.110405.090451. [DOI] [PubMed] [Google Scholar]
- 9.San Filippo J, Sung P, Klein H. Mechanism of eukaryotic homologous recombination. Annu Rev Biochem. 2008;77:229–257. doi: 10.1146/annurev.biochem.77.061306.125255. [DOI] [PubMed] [Google Scholar]
- 10.Qing Y, et al. The epistatic relationship between BRCA2 and the other RAD51 mediators in homologous recombination. PLoS Genet. 2011;7(7):e1002148. doi: 10.1371/journal.pgen.1002148. [DOI] [PMC free article] [PubMed] [Google Scholar]
- 11.Clever B, et al. Recombinational repair in yeast: Functional interactions between Rad51 and Rad54 proteins. EMBO J. 1997;16(9):2535–2544. doi: 10.1093/emboj/16.9.2535. [DOI] [PMC free article] [PubMed] [Google Scholar]
- 12.Golub EI, Kovalenko OV, Gupta RC, Ward DC, Radding CM. Interaction of human recombination proteins Rad51 and Rad54. Nucleic Acids Res. 1997;25(20):4106–4110. doi: 10.1093/nar/25.20.4106. [DOI] [PMC free article] [PubMed] [Google Scholar]
- 13.Kiianitsa K, Solinger JA, Heyer WD. Rad54 protein exerts diverse modes of ATPase activity on duplex DNA partially and fully covered with Rad51 protein. J Biol Chem. 2002;277(48):46205–46215. doi: 10.1074/jbc.M207967200. [DOI] [PubMed] [Google Scholar]
- 14.Swagemakers SM, Essers J, de Wit J, Hoeijmakers JH, Kanaar R. The human RAD54 recombinational DNA repair protein is a double-stranded DNA-dependent ATPase. J Biol Chem. 1998;273(43):28292–28297. doi: 10.1074/jbc.273.43.28292. [DOI] [PubMed] [Google Scholar]
- 15.Wesoly J, et al. Differential contributions of mammalian Rad54 paralogs to recombination, DNA damage repair, and meiosis. Mol Cell Biol. 2006;26(3):976–989. doi: 10.1128/MCB.26.3.976-989.2006. [DOI] [PMC free article] [PubMed] [Google Scholar]
- 16.Agarwal S, et al. ATP-dependent and independent functions of Rad54 in genome maintenance. J Cell Biol. 2011;192(5):735–750. doi: 10.1083/jcb.201011025. [DOI] [PMC free article] [PubMed] [Google Scholar]
- 17.Kiianitsa K, Solinger JA, Heyer WD. Terminal association of Rad54 protein with the Rad51-dsDNA filament. Proc Natl Acad Sci USA. 2006;103(26):9767–9772. doi: 10.1073/pnas.0604240103. [DOI] [PMC free article] [PubMed] [Google Scholar]
- 18.Li X, Stith CM, Burgers PM, Heyer WD. PCNA is required for initiation of recombination-associated DNA synthesis by DNA polymerase delta. Mol Cell. 2009;36(4):704–713. doi: 10.1016/j.molcel.2009.09.036. [DOI] [PMC free article] [PubMed] [Google Scholar]
- 19.Bugreev DV, Mazin AV. Ca2+ activates human homologous recombination protein Rad51 by modulating its ATPase activity. Proc Natl Acad Sci USA. 2004;101(27):9988–9993. doi: 10.1073/pnas.0402105101. [DOI] [PMC free article] [PubMed] [Google Scholar]
- 20.Ristic D, Sanchez H, Wyman C. Sample preparation for SFM imaging of DNA, proteins, and DNA-protein complexes. Methods Mol Biol. 2011;783:213–231. doi: 10.1007/978-1-61779-282-3_12. [DOI] [PubMed] [Google Scholar]
- 21.Goshtasby A. Image registration by local approximation methods. Image Vis Comput. 1988;6(4):255–261. [Google Scholar]
- 22.Churchman LS, Okten Z, Rock RS, Dawson JF, Spudich JA. Single molecule high-resolution colocalization of Cy3 and Cy5 attached to macromolecules measures intramolecular distances through time. Proc Natl Acad Sci USA. 2005;102(5):1419–1423. doi: 10.1073/pnas.0409487102. [DOI] [PMC free article] [PubMed] [Google Scholar]
- 23.Kerssemakers JW, et al. Assembly dynamics of microtubules at molecular resolution. Nature. 2006;442(7103):709–712. doi: 10.1038/nature04928. [DOI] [PubMed] [Google Scholar]
- 24.van Mameren J, et al. Counting RAD51 proteins disassembling from nucleoprotein filaments under tension. Nature. 2009;457(7230):745–748. doi: 10.1038/nature07581. [DOI] [PMC free article] [PubMed] [Google Scholar]
- 25.Schatz PJ. Use of peptide libraries to map the substrate specificity of a peptide-modifying enzyme: A 13 residue consensus peptide specifies biotinylation in Escherichia coli. Biotechnology (N Y) 1993;11(10):1138–1143. doi: 10.1038/nbt1093-1138. [DOI] [PubMed] [Google Scholar]
- 26.Ristic D, Wyman C, Paulusma C, Kanaar R. The architecture of the human Rad54-DNA complex provides evidence for protein translocation along DNA. Proc Natl Acad Sci USA. 2001;98(15):8454–8460. doi: 10.1073/pnas.151056798. [DOI] [PMC free article] [PubMed] [Google Scholar]
- 27.Mazina OM, Mazin AV. Human Rad54 protein stimulates DNA strand exchange activity of hRad51 protein in the presence of Ca2+ J Biol Chem. 2004;279(50):52042–52051. doi: 10.1074/jbc.M410244200. [DOI] [PubMed] [Google Scholar]
- 28.Modesti M, et al. Fluorescent human RAD51 reveals multiple nucleation sites and filament segments tightly associated along a single DNA molecule. Structure. 2007;15(5):599–609. doi: 10.1016/j.str.2007.04.003. [DOI] [PubMed] [Google Scholar]
- 29.van der Heijden T, et al. Real-time assembly and disassembly of human RAD51 filaments on individual DNA molecules. Nucleic Acids Res. 2007;35(17):5646–5657. doi: 10.1093/nar/gkm629. [DOI] [PMC free article] [PubMed] [Google Scholar]
- 30.Brown AE, Hategan A, Safer D, Goldman YE, Discher DE. Cross-correlated TIRF/AFM reveals asymmetric distribution of force-generating heads along self-assembled, “synthetic” myosin filaments. Biophys J. 2009;96(5):1952–1960. doi: 10.1016/j.bpj.2008.11.032. [DOI] [PMC free article] [PubMed] [Google Scholar]
- 31.Owen RJ, Heyes CD, Knebel D, Röcker C, Nienhaus GU. An integrated instrumental setup for the combination of atomic force microscopy with optical spectroscopy. Biopolymers. 2006;82(4):410–414. doi: 10.1002/bip.20414. [DOI] [PubMed] [Google Scholar]
- 32.Yildiz A, et al. Myosin V walks hand-over-hand: Single fluorophore imaging with 1.5-nm localization. Science. 2003;300(5628):2061–2065. doi: 10.1126/science.1084398. [DOI] [PubMed] [Google Scholar]
- 33.Cronin B, de Wet B, Wallace MI. Lucky imaging: Improved localization accuracy for single molecule imaging. Biophys J. 2009;96(7):2912–2917. doi: 10.1016/j.bpj.2008.12.3945. [DOI] [PMC free article] [PubMed] [Google Scholar]
- 34.Ceballos SJ, Heyer WD. Functions of the Snf2/Swi2 family Rad54 motor protein in homologous recombination. Biochim Biophys Acta. 2011;1809(9):509–523. doi: 10.1016/j.bbagrm.2011.06.006. [DOI] [PMC free article] [PubMed] [Google Scholar]
- 35.Petukhova G, Stratton S, Sung P. Catalysis of homologous DNA pairing by yeast Rad51 and Rad54 proteins. Nature. 1998;393(6680):91–94. doi: 10.1038/30037. [DOI] [PubMed] [Google Scholar]
- 36.Li X, et al. Rad51 and Rad54 ATPase activities are both required to modulate Rad51-dsDNA filament dynamics. Nucleic Acids Res. 2007;35(12):4124–4140. doi: 10.1093/nar/gkm412. [DOI] [PMC free article] [PubMed] [Google Scholar]
- 37.Solinger JA, Kiianitsa K, Heyer WD. Rad54, a Swi2/Snf2-like recombinational repair protein, disassembles Rad51:dsDNA filaments. Mol Cell. 2002;10(5):1175–1188. doi: 10.1016/s1097-2765(02)00743-8. [DOI] [PubMed] [Google Scholar]
- 38.Amitani I, Baskin RJ, Kowalczykowski SC. Visualization of Rad54, a chromatin remodeling protein, translocating on single DNA molecules. Mol Cell. 2006;23(1):143–148. doi: 10.1016/j.molcel.2006.05.009. [DOI] [PubMed] [Google Scholar]
- 39.Petukhova G, Van Komen S, Vergano S, Klein H, Sung P. Yeast Rad54 promotes Rad51-dependent homologous DNA pairing via ATP hydrolysis-driven change in DNA double helix conformation. J Biol Chem. 1999;274(41):29453–29462. doi: 10.1074/jbc.274.41.29453. [DOI] [PubMed] [Google Scholar]
- 40.Sanchez H, Suzuki Y, Yokokawa M, Takeyasu K, Wyman C. Protein-DNA interactions in high speed AFM: Single molecule diffusion analysis of human RAD54. Integr Biol (Camb) 2011;3(11):1127–1134. doi: 10.1039/c1ib00039j. [DOI] [PubMed] [Google Scholar]
- 41.Holthausen JT. 2012. Mechanism of genome protection by homologous recombination repair. PhD thesis (Erasmus Univ Medical Center, Rotterdam, the Netherlands)
- 42.Mazin AV, Alexeev AA, Kowalczykowski SC. A novel function of Rad54 protein. Stabilization of the Rad51 nucleoprotein filament. J Biol Chem. 2003;278(16):14029–14036. doi: 10.1074/jbc.M212779200. [DOI] [PubMed] [Google Scholar]
- 43.Raghavachari N, Bao YP, Li G, Xie X, Müller UR. Reduction of autofluorescence on DNA microarrays and slide surfaces by treatment with sodium borohydride. Anal Biochem. 2003;312(2):101–105. doi: 10.1016/s0003-2697(02)00440-2. [DOI] [PubMed] [Google Scholar]
Associated Data
This section collects any data citations, data availability statements, or supplementary materials included in this article.