

Abstract
Objectives
The aim of this work was to explore the physiological and perceptual limits to exercise in children with varying degrees of motor impairment, and the relationships to measures of health.
Design and methods
In a group comparison design, 35 boys aged 12–15 years completed the Movement ABC test for the assessment of motor impairment, followed by an incremental cycle ergometer test to exhaustion for the assessment of maximal oxygen uptake (VO2peak), respiratory exchange ratio (RER), heart rate (HR) and rating of perceived exertion (RPE). Ten participants classified as having either high or no motor impairment also performed a maximal voluntary isometric contraction (MVIC) for the assessment of lower limb extensor strength.
Results
18 boys were classified as having high motor impairment. There was a significant difference in  peak (34.9 vs 48.5 mL kg/min), workload (12.5 vs 10.0 mL W), maximal HR (176 vs 188 bpm), maximal oxygen pulse (12.1 vs 15.9 mL beat) and MVIC (5.7 vs 9.1 Nm kg) between the high and non-motor impaired participants, respectively, (p<0.05). There was no significant difference in the RER or RPE between groups.
Conclusions
When performing cycling ergometry, perceived exertion was not a limiting factor in children with high motor impairment. The lower maximal HR, coupled with reduced movement efficiency and muscle strength reported in this group, suggests that exercise is limited by impairment at the muscular level. This finding was supported by high RER values despite low maximal HR values attained at exercise cessation and reduced maximal strength. Perception of effort is not heightened in children with high motor impairment and future-exercise interventions should be focused on improving muscular condition in these participants to enable them to be better prepared to engage in physical activity for health.
Keywords: PAEDIATRICS, Muscle, Health, Motor competence
Article summary.
Article focus
Exercise tolerance was not limited by the high motor impairment (HMI) group not willing to push itself maximally, with the level of motor impairment being significantly related to the VO2 peak and muscular strength.
Children with HMI have a reduced movement economy during cycling exercise.
Key messages
Children with HMI fail to exercise hard enough to maximally tax the cardiovascular system.
Children with HMI are willing to push themselves maximally during exercise, despite the limited exercise capacity. Utilising short duration, high-intensity exercise bouts, focusing on the development of the exercising musculature may be a better method for improving the limited fitness parameters in this population.
Strengths and limitations of this study
Few studies have directly measured the limiting factors to exercise alongside standard motor impairment tests.
The use of cycle ergometry is a safe option for maximal testing, allowing participants to give a maximal effort. However, owing to the nature of the exercise, the weakness in the exercising musculature may be accentuated.
Introduction
Physical activity levels in childhood have been shown to predict adult activity behaviour1 2 affecting life expectancy and quality of life years. As such, successfully achieving an active lifestyle in childhood is critical. Children with movement difficulties and poor coordination tend to have lower levels of physical activity participation than their typically developing peers.3–5 Further, this group of children, with reduced motor coordination and low activity levels, has been found to have significantly higher metabolic syndrome indicators6 including: abdominal adiposity, blood pressure and triglyceride levels compared with their typically developing peers.7 8 Of added concern is that such motor impairments are known to persist into adulthood, further impacting on the ability of these individuals to achieve a physically active lifestyle as adults.9–11 The number of people with some form of motor impairment in the UK population is 2.6 million,12 and as such, this group is an important proportion of society which should be considered within public health policy. Understanding factors particularly affecting the exercise experience in these individuals is essential if higher physical activity levels are to be achieved.
In a series of interviews with adolescents with Developmental Coordination Disorder13 14 and with children with cerebral palsy,15 exercise-induced symptoms of muscle fatigue, poor physical tolerance and low energy levels have also been reported as major factors reducing enjoyment, tolerance and participation. However, as yet, the underpinning physiological limits have not been fully explored. We know that individuals judge and limit effort during exercise from symptoms arising from muscles, joints and the cardiovascular system, choosing to reduce how hard they are exercising when symptoms become too strong.16 17 Children with increased motor impairment are known to perform poorly in sport and exercise fitness screening tests,18 19 but the physiological and perceptual responses limiting exercise performance have not been explored in these individuals.18 20 21
Aims
The study set out to explore, in individuals with different levels of motor impairment, the physiological and perceptual measures during, and limiting, maximal exercise performance.
Methods
Procedure
The study was approved by the University Research Ethics Committee. Participants were recruited through two routes, either through a database of those who had taken part in our previous research or through advertisements and posters. Families indicating that they were interested in taking part were sent separate child and parent information sheets and gave their written consent prior to the study. Participants attended the Human Performance Laboratory for testing, with parents attending only to help complete a health screening questionnaire for their child. The testing session consisted of the participant completing the Movement ABC-2 Test (MABC-2)22 for a measure of motor impairment, followed by the exercise testing. Details of these measures can be found below.
Participants were asked to refrain from eating, performing exercise or drinking caffeine in the 2 h period before attending the sessions.
Participants
Thirty-five men aged 12–15 years with no known neurological condition were recruited. Individuals were classified on the level of motor ability using the MABC-2 test.
Measures
MABC-2 test
This standardised test of motor skill was used to confirm the presence of significant movement difficulties.22 Eight age-appropriate items were individually administered as described in the test manual. Raw scores for each task were converted to standard scores, summed across three subsections to obtain a standard score for Manual Dexterity, Aiming & Catching and Balance. A total test score and centile rank were also obtained. For the diagnosis of motor impairment, it has been recommended that scores below the 5th centile indicate definite motor impairment while scores between the 5th and 15th centiles indicate borderline scores.23 Therefore, any child scoring below the 15th centile in this current study was classed as having high motor impairment (HMI). Children scoring above the 15th centile were classified as having no motor impairment (NMI).
Exercise testing
Height (Holtain stadiometer), weight (Seca scales) and body mass index were recorded prior to the exercise test. After resting for 6 min, participants underwent an incremental cycle ergometer exercise test (Lode Excalibur Sport, Gronigen, the Netherlands) of 1 min stages after an initial 2 min of unloaded cycling. Workload was progressed based on Godfrey et al's protocol24 (increasing workload by 15–20 W from unloaded cycling based on the height of the participant). The test ended at volitional exhaustion or if the participant was unable to maintain a cadence of 60 rpm, with verbal encouragement given throughout.
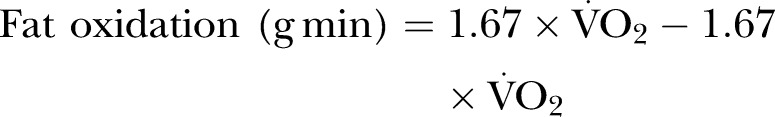
Pulmonary gas exchange was measured breath-by-breath using an automated metabolic analysis system (Cortex Metalyzer, Leipzig Germany). The system was calibrated prior to each test in accordance with the manufacturer's instructions. All participants wore a face mask covering the nose and mouth connected to a low-resistance volume transducer (Triple V, Hoechberg, Germany). Heart rate (HR) was recorded continuously throughout the testing protocol using short-range telemetry (Polar S810, Finland). Oxygen uptake () was calculated as the average in the last 30s of each stage, while the peak was recorded as the highest 60 s average before the termination of the test. The respiratory exchange ratio (RER) was calculated from the ratio of to at each workload level throughout the exercise test. Maximal fat oxidation was calculated using the equations of Frayn25 in equation 1 below
 |
The relationship between the amount of oxygen utilised for a given work rate was calculated from the linear slope of the relationship between and Watts (/W) and was used as a measure of muscular efficiency. Oxygen pulse, a non-invasive indicator of cardiac function, was calculated by dividing by HR (/HR). Maximum workload (Workloadmax) was calculated as the final completed workload. Rating of perceived exertion (RPE) was measured at the end of each stage using the Cart and Load scale (CALER), which has previously been used to assess children's perception of effort during exercise.26 CALER has a scale from 1 to 10 with 1 being classed as ‘very easy’ and 10 being ‘so hard I'm going to stop’. Illustrations of a child pulling a cart behind their bicycle, which was progressively laden with bricks, accompanied the scale.
The criteria for true maximal effort included a plateau in max, maximal HR >95% of age predicted maximum and RER >1.06.27 All children were fully familiarised with the testing protocol prior starting the session.
Maximal voluntary isometric contraction protocol
Participants performed a 1RM leg extensor strength test on a specially designed isometric strength-testing chair. The knee angle was 90° and the rotation axis of the strength chair was aligned with the knee axis. Participants were asked to relax for 30 s; thereafter, participants performed maximum knee extension for approximately 5 s. Verbal encouragement was given to reach the maximum force. After this maximum knee extension, participants relaxed for 30 s. This test was repeated three times; 1RM was the maximum output reached.
Electrical signals from the torque transducer were amplified (Digitimer Neurolog NL107 Recorder Amplifier) and digitised (Cambridge Electronic Design, micro1401). Torque from maximal voluntary isometric contractions (MVICs) was recorded on a PC for subsequent analysis using Spike data analysis software (Spike 2 V.5.0 for Windows).
Data analysis
Descriptive statistics (mean±SD, range) were calculated for all variables.
All exercise testing measure distributions were examined for normality. Linear regression analysis was performed to examine relationships between the MABC score and the exercise variables. Ten participants reporting HMI returned to the laboratory to repeat the exercise test to establish reliability data in this population. Test–retest reliability was analysed to test for systematic and random error using student t test, intraclass correlation coefficient (ICC) (3,1), bias (average difference) and random error (1.96×SD of differences). Statistical significance was accepted at p<0.05.
Results
MABC-2 test
Eighteen participants obtained total scores considered to be HMI, that is, below the MABC 15th centile, with 5 at or below the 5th centile, and 17 were classified as having NMI (MABC >15 centile). Table 1 displays the participant characteristics from the test battery.
Table 1.
Participant characteristics and outcome measures
| HMI (n=18) | NMI (n=17) | |
|---|---|---|
| MABC | 4.0 (4.7) | 62.8 (20.7)* |
| Age (years) | 14.1 (1.5) | 14.9 (0.9) |
| Height (m) | 1.70 (0.10) | 1.74 (0.10) |
| Weight (kg) | 62.8 (17.9) | 60.3 (10.6) |
| BMI | 21.5 (4.0) | 19.5 (2.1) |
| VO2 max (mL kg min) | 34.9 (6.3) | 48.5 (7.9)* |
| VO2/workload (mL W) | 12.5 (3.9) | 10.0 (1.3)* |
| O2 pulse (mL beat) | 12.1 (3.7) | 15.9 (4.0)* |
| Heart rate maximum (bpm) | 176 (19.7) | 188 (8.8)* |
| RER maximum | 1.15 (0.09) | 1.18 (0.09) |
| RPE maximum | 9.1 (1.5) | 9.6 (0.5) |
*p<0.05
BMI, body mass index; HMI,high motor impairment; MABC, Movement ABC; NMI, nomotor impairment; RER, respiratory exchange ratio; RPE, rating of perceived exertion.
As expected, there was a significant difference in the MABC centile score between the HMI and NMI groups (4.0 (4.7) vs 62.8 (20.7), p<0.05).
Exercise testing
There was a significant difference in the peak (34.9 (6.3) vs 48.5 (7.9) mL kg/min), /workload (12.5 (3.9) vs 10.0 (1.3) /W), oxygen pulse (12.1 (3.7) vs 15.9 (4.0) mL beat), maximum HR (176 (19.7) vs 188 (8.8) beats min) and MVIC (5.7 (1.0) vs 9.0 (1.8) Nm kg) with the NMI group achieving higher , oxygen pulse, maximum HR and MVIC.
There was no difference between the groups in RER, with all but one participant demonstrating a maximal value greater than 1.0 at the end of the test. There was also no significant difference in maximal fat oxidation levels between the groups.
Compared with the established maximal criteria for typically developing children,28 all but one of the participants met the criteria for a maximal effort during the exercise test, with no significant difference between the HMI and NMI groups. There was no difference in the perception of effort throughout the exercise trial and at exercise termination, with all participants reporting an RPE rating of 9 or 10 at the end of the test, despite individuals in the HMI group having significantly lower maximum HR values at the end of the cycle ergometer test.
There were significant relationships between the MABC score and peak (r=0.36, p<0.05) (figure 1) and MVIC (r=0.76, p<0.01; figure 2).
Figure 1.
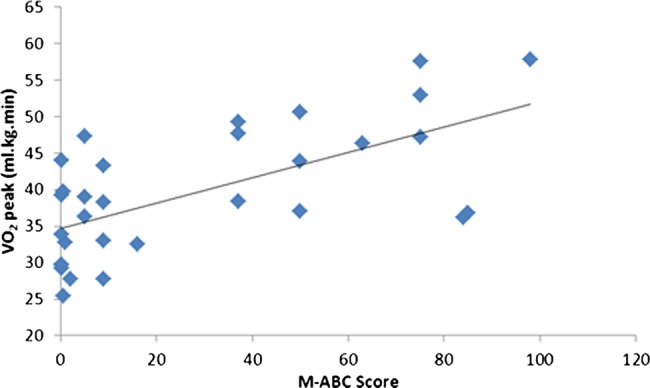
Relationship between the Movement ABC score and the peak.
Figure 2.
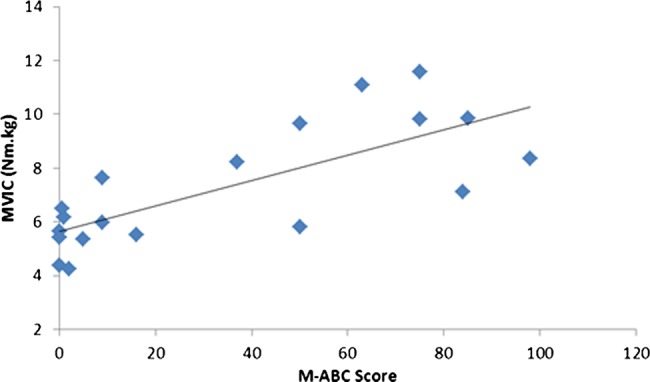
Relationship between the Movement ABC score and maximal voluntary isometric contraction.
Table 2 below displays the characteristics of the participants who undertook the MVIC testing.
Table 2.
MABC and MVIC for the HMI and NMI participants
| HMI (n=10) | NMI (n=10) | |
|---|---|---|
| MABC | 4.3 (5.4) | 68.6 (19.9)* |
| MVIC (Nm kg) | 5.7 (1.0) | 9.0 (1.8)* |
*p<0.05
HMI, high motor impairment; MABC, Movement ABC; MVIC, maximal voluntary isometric contraction; NMI, no motor impairment.
Test–retest reliability of exercise measures
Ten HMI participants returned to the laboratory to complete a second maximal exercise test for the assessment of reliability in this population. The maximal exercise data demonstrated good reliability with ICC scores for the peak 0.75 (CI 0.23 to 0.94; t 0.39, bias 3.54, random error 6.93), maximal HR 0.93 (CI 0.73 to 0.98; t −0.86, bias 7.8, random error 15.4) and maximal RER 0.89 (CI 0.59 to 0.98; t −0.14, bias 0.07, random error 0.14). Maximal RPE ICC scores were all rated 9–10, thus affecting ICC 0.05 (CI −0.60 to 0.66), but had a low bias (t −2.14, bias 0.86, random error 1.68).
Discussion
The study set out to explore, in individuals with different levels of motor impairment, the physiological and perceptual factors during, and limiting, maximal exercise performance. Examination of the exercise test data showed a significant difference in the peak, /workload, oxygen pulse, maximum HR and MVIC between the HMI and NMI groups. Interestingly, there was no difference in maximal RPE or RER. When considering the limits to exercise in people with HMI, the maximal RER and fat oxidation levels at test termination suggest that low levels of aerobic muscle performance and not a heightened perceived level of exertion were limiting exercise performance. These findings are important as they highlight a low level of aerobic muscle performance as a major factor limiting exercise performance in children with poor coordination. Muscle plays a central role in health and disease across the lifespan29 and, if left unaddressed in children with HMI, is likely to continue into adulthood and contribute to the development of metabolic disorders in this population.
Despite children with HMI demonstrating a linear /workload response, the value of 12.5 (3.9) mL W reflects a reduced movement economy throughout the exercise.30
normally rises at a rate of about 8.5–11 mL min W and is independent of sex, age, body weight or height.31 Thus, in children with HMI, exercise participation may be limited by the impaired ability of the muscle to work aerobically. The reduced muscular strength of the quadriceps reported in this study further supports the main limiting factor at the muscular level, and this finding supports the findings from previous studies citing a reduced strength in other muscle groups in children with greater motor impairment.19
In comparison to the NMI group, the HMI group had a reduced exercise capacity, with a mean peak of 34.9 mL kg/min. The peak was below the cardiovascular fitness threshold in the HMI children32 and, as such, associated with an increased risk of obesity, type II diabetes and cardiovascular and metabolic disorders in adulthood.33 Considered alongside the low maximum HRs demonstrated by these children (mean 176 bpm) in comparison to NMI participants (188 bpm) and those reported in normal healthy children at the end of a similar cycling protocol,34 our findings suggest that a low level of aerobic muscle performance was limiting the ability of children with HMI to push themselves hard enough to maximally tax the cardiovascular system. Despite a significantly lower oxygen pulse level between the groups (12.1 (3.7) vs 15.9 (4.0) mL beat, p<0.05), the HMI group was not different from those the group of healthy individuals reported previously.35 This further supports the findings that the limiting factor is of peripheral, and not central, origin. Given the emerging role of mitochondrial dysfunction in many neuromuscular disorders, a lack of aerobic capability in the muscles of children with poor motor control may impact on their long-term health and prevent them from increasing their HR to the level required to achieve an aerobic training stimulus and attain fitness, health and well-being benefits according to current guidelines for physical activity in children.36 Interestingly, despite the reduced aerobic fitness, there was no difference in the utilisation of fat as a substrate during the exercise protocol between the groups in this study. The levels of fat oxidation in this current study were within the range previously reported in healthy participants of similar age.37 The number of individuals in this sample is relatively small; however, we included a range of individuals with different motor capabilities and in the subgroup of HMI participants that returned to the laboratory, we established good reliability in the clinical exercise testing in this population.
Muscle function has been found to have an important role in long-term health29 and considering our observation of reduced muscle capacity in individuals with HMI, it is important to investigate interventions that can be implemented in childhood to improve muscle function and performance.38 This is further supported with the significantly lower MVIC in the HMI group in comparison to NMI. The reduced strength of the major locomotor muscle group in HMI not only has implications for function, with some reports of increased cocontraction,39 but also for the impact on health and the quality of life. In a recent study by Buchan et al,40 high intensity exercise has been shown to reduce cardiovascular risk and improve muscle function in healthy children. As yet, this type of intensity has not been investigated in the population of children included in this study; however, the evidence of their willingness to push themselves maximally in this study warrants the application of such intensities of exercise to measure the impact on health and movement measures. Work by Cairney et al18 suggested that the reduced exercise performance of children with motor impairment was partly related to the level of perceived adequacy for the task. The findings of this current work suggest that the limitations to exercise in the HMI group had strong physiological underpinnings reflected in the criteria for a maximal effort being attained in all but one of the participants.
The findings from this work highlight the significant relationship between the motor impairment level and health status. The reduced exercise capacity and muscular performance demonstrated by the participants with greater motor impairment highlight the need for any exercise interventions to target the development of muscular function. Research has shown that exercise interventions play a possible role in improving motor competence levels in children with movement difficulties41; however, how these changes relate to alterations in markers of cardiovascular and muscular health and the long-term involvement in physical activity have yet to be elucidated.
Supplementary Material
Footnotes
Contributors: MM, HD and RJ participated in the conception and design; acquisition of data or analysis and interpretation of data; and drafting of the article or revising it critically for important intellectual content. KH participated in the conception and design and drafting of the article or revising it critically for important intellectual content. All authors have read and approved the final manuscript.
Funding: This research received no specific grant from any funding agency in the public, commercial or not-for-profit sectors.
Competing interests: None.
Patient consent: Obtained.
Ethics approval: University Research Ethics Committee.
Provenance and peer review: Not commissioned; externally peer reviewed.
Data sharing statement: No additional data are available.
References
- 1.Powell KE, Dysinger W. Childhood participation in organized school sports and physical education as precursors of adult physical activity. Am J Prev Med 1987;3:276–81 [PubMed] [Google Scholar]
- 2.Rejeski WJ, Miller ME, King AC, et al. Predictors of adherence to physical activity in the Lifestyle Interventions and Independence for Elders pilot study (LIFE-P). Clin Interv Aging 2007;2:485–94 [PMC free article] [PubMed] [Google Scholar]
- 3.Poulsen AA, Ziviani JM, Cuskelly M. Leisure time physical activity energy expenditure in boys with developmental coordination disorder: the role of peer relations self-concept perceptions. Otjr Occup Participation Health 2008;28:30–9 [Google Scholar]
- 4.Haga M. Physical fitness in children with high motor competence is different from that in children with low motor competence. Phys Ther 2009;89:1089–97 [DOI] [PubMed] [Google Scholar]
- 5.Calley A, Williams S, Reid S, et al. A comparison of activity, participation and quality of life in children with and without spastic diplegia cerebral palsy. Disabil Rehabil 2012;34:1306–10 [DOI] [PubMed] [Google Scholar]
- 6.Zimmet P, Alberti KG, Kaufman F, et al. The metabolic syndrome in children and adolescents—an IDF consensus report. Pediatr Diabetes 2007;8:299–306 [DOI] [PubMed] [Google Scholar]
- 7.Wahi G, LeBlanc PJ, Hay JA, et al. Metabolic syndrome in children with and without developmental coordination disorder. Res Dev Disabil 2011;32:2785–9 [DOI] [PubMed] [Google Scholar]
- 8.Maffeis C, Zaffanello M, Pellegrino M, et al. Nutrient oxidation during moderately intense exercise in obese prepubertal boys. J Clin Endocrinol Metab 2005;90:231–6 [DOI] [PubMed] [Google Scholar]
- 9.Powell KE, Dysinger W. Childhood participation in organized school sports and physical education as precursors of adult physical activity. Am J Prev Med 1987;3:276–81 [PubMed] [Google Scholar]
- 10.Kirby A, Edwards L, Sugden D, et al. The development and standardization of the Adult Developmental Co-ordination Disorders/Dyspraxia Checklist (ADC). Res Dev Disabil 2010;31:131–9 [DOI] [PubMed] [Google Scholar]
- 11.Heymsfield SB, Thomas D, Bosy-Westphal A, et al. Evolving concepts on adjusting human resting energy expenditure measurements for body size. Obes Rev 13:1001–14 [DOI] [PMC free article] [PubMed] [Google Scholar]
- 12.ODI Disability statistics and research, 2013
- 13.Barnett A, Dawes H, Morris M, et al. Barriers and facilitators to participation in physical activity in teenagers with Developmental Coordination Disorder. British Psychological Society, Developmental Section Annual Conference University of Nottingham & Nottingham Trent University, 2009 [Google Scholar]
- 14.Barnett A, Dawes H, Wilmut K. Constraints and facilitators to participation in physical activity in teenagers with developmental co-ordination disorder: an exploratory interview study. Child: Care Health Dev 2013;39:393–403 [DOI] [PubMed] [Google Scholar]
- 15.Buffart LM, Westendorp T, Van den Berg-Emons RJ, et al. Perceived barriers to and facilitators of physical activity in young adults with childhood-onset physical disabilities. J Rehabil Med 2009;41:881–5 [DOI] [PubMed] [Google Scholar]
- 16.Rejeski W. Not what, but how one feels: the measurement of affect during exercise. J Sport Exerc Psychol 1989;11:304–17 [Google Scholar]
- 17.Weiser PC, Stamper DA. Psychophysiological interactions leading to increased effort, leg fatigue, and respiratory distress during prolonged strenuous bicyle riding. In: Borg G. ed. Physical work and effort. Oxford: Pergamon Press, 1977:401–16 [Google Scholar]
- 18.Cairney J, Hay JA, Wade TJ, et al. Developmental coordination disorder and aerobic fitness: is it all in their heads or is measurement still the problem? Am J Hum Biol 2006;18:66–70 [DOI] [PubMed] [Google Scholar]
- 19.Schott N, Alof V, Hultsch D, et al. Physical fitness in children with developmental coordination disorder. Res Q Exerc Sport 2007;78:438–50 [DOI] [PubMed] [Google Scholar]
- 20.Chia LC, Guelfi KJ, Licari MK. A comparison of the oxygen cost of locomotion in children with and without developmental coordination disorder. Dev Med Child Neurol 2009;52:251–5 [DOI] [PubMed] [Google Scholar]
- 21.Wu SK, Lin HH, Li YC, et al. Cardiopulmonary fitness and endurance in children with developmental coordination disorder. Res Dev Disabil 2009;31:345–9 [DOI] [PubMed] [Google Scholar]
- 22.Henderson SE, Sugden DA, Barnett A. Movement assessment battery for children 2 checklist. London: Pearson, 2007 [Google Scholar]
- 23.Sugden D. Developmental coordination disorder as a specific learning difficulty. Leeds Consensus Statement. Cardiff: The Dyscovery Trust, 2006 [Google Scholar]
- 24.Godfrey S, Davies CT, Wozniak E, et al. Cardio-respiratory response to exercise in normal children. Clin Sci 1971;40:419–31 [DOI] [PubMed] [Google Scholar]
- 25.Ziemann U, Ishii K, Borgheresi A, et al. Dissociation of the pathways mediating ipsilateral and contralateral motor-evoked potentials in human hand and arm muscles. J Physiol 1999;518(Pt 3):895–906 [DOI] [PMC free article] [PubMed] [Google Scholar]
- 26.Parfitt G, Shepherd P, Eston R. Reliability of effort production using the children's CALER and BABE perceived exertion scales. J Exerc Sci Fitness 2007;5:49–55 [Google Scholar]
- 27.Winter EM. Sport and exercise physiology testing guidelines: the British Association of Sport and Exercise Sciences guide. London: Routledge, 2007 [Google Scholar]
- 28.Armstrong N, Welsman JR, Kirby BJ. Peak oxygen uptake and maturation in 12-yr olds. Med Sci Sports Exerc 1998;30:165–9 [DOI] [PubMed] [Google Scholar]
- 29.Wolfe RR. The underappreciated role of muscle in health and disease. Am J Clin Nutr 2006;84:475–82 [DOI] [PubMed] [Google Scholar]
- 30.Hansen JE, Casaburi R, Cooper DM, et al. Oxygen uptake as related to work rate increment during cycle ergometer exercise. Eur J Appl Physiol Occup Physiol 1988;57:140–5 [DOI] [PubMed] [Google Scholar]
- 31.Wasserman K, Sietsema K, Sue DY, et al. Principles of exercise testing & interpretation: including pathophysiology and clinical applications. 5th edn Lippinkott Williams and Wilkins, 2011 [Google Scholar]
- 32.Ruiz JR, Ortega FB, Rizzo NS, et al. High cardiovascular fitness is associated with low metabolic risk score in children: the European Youth Heart Study. Pediatr Res 2007;61:350–5 [DOI] [PubMed] [Google Scholar]
- 33.Anderssen SA, Cooper AR, Riddoch C, et al. Low cardiorespiratory fitness is a strong predictor for clustering of cardiovascular disease risk factors in children independent of country, age and sex. Eur J Cardiovasc Prev Rehabil 2007;14:526–31 [DOI] [PubMed] [Google Scholar]
- 34.Karila C, De Blic J, Waernessyckle S. Cardiopulmonary exercise testing in children. An individualized protocol for workload increase. Chest 2001;120:81–7 [DOI] [PubMed] [Google Scholar]
- 35.Buys R, Budts W, Reybrouck T, et al. Serial exercise testing in children, adolescents and young adults with Senning repair for transposition of the great arteries. BMC Cardiovasc Disord 2012;12:88. [DOI] [PMC free article] [PubMed] [Google Scholar]
- 36.ACSM ACSM's guidelines for exercise testing and prescription. Guidelines for graded exercise testing and training. 7th edn Philadelphia: Lea and Febiger: Lippincott Williams and Wilkins, 2005 [Google Scholar]
- 37.Riddell MC, Jamnik VK, Iscoe KE, et al. Fat oxidation rate and the exercise intensity that elicits maximal fat oxidation decreases with pubertal status in young male subjects. J Appl Physiol 2008;105:742–8 [DOI] [PubMed] [Google Scholar]
- 38.Verschuren O, Ketelaar M, Takken T, et al. Exercise programs for children with cerebral palsy: a systematic review of the literature. Am J Phys Med Rehabil 2008;87:404–17 [DOI] [PubMed] [Google Scholar]
- 39.Raynor AJ. Strength, power, and coactivation in children with developmental coordination disorder. Dev Med Child Neurol 2001;43:676–84 [DOI] [PubMed] [Google Scholar]
- 40.Buchan DS, Ollis S, Thomas NE, et al. Physical activity interventions: effects of duration and intensity. Scand J Med Sci Sports 2011;21:E341–50 [DOI] [PubMed] [Google Scholar]
- 41.Hung WWY, Pang MYC. Effects of group-based versus individual-based exercise training on motor performance in children with developmental coordination disorder: a randomized controlled pilot study. J Rehabil Med 2010;42:122–8 [DOI] [PubMed] [Google Scholar]
Associated Data
This section collects any data citations, data availability statements, or supplementary materials included in this article.