

Abstract
We are overwhelmed by experimental data, and need better ways to understand large interaction datasets. While clustering related nodes in such networks—known as community detection—appears a promising approach, detecting such communities is computationally difficult. Further, how to best use such community information has not been determined. Here, within the context of protein function prediction, we address both issues. First, we apply a novel method that generates improved modularity solutions than the current state of the art. Second, we develop a better method to use this community information to predict proteins' functions. We discuss when and why this community information is important. Our results should be useful for two distinct scientific communities: first, those using various cost functions to detect community structure, where our new optimization approach will improve solutions, and second, those working to extract novel functional information about individual nodes from large interaction datasets.
Recently, network science has been used to provide a framework for investigating the structure and dynamics of complex systems in various biological and social sciences1,2,3. Typical real-world networks adopt hierarchical structures, including communities composed of more densely inter-connected subgraphs. Uncovering the hidden community structure of a network, known as community or module detection, has been a subject of active research in mathematical, social and physical sciences4,5,6,7,8. Nodes in a community likely share common characteristics, so proper community detection in principle allows extraction of hidden information from the network, without additional a priori knowledge. Biologically, a group of proteins or genes in the same community, within a larger protein interaction network, often coincides with known functional modules and/or protein complexes9,10. Similar functional correspondence is observed in gene co-expression networks11. In metabolic networks, nodes can be classified according to their topological characteristics in the community, which allows one to predict the roles of metabolites12.
Such communities are thus in principle invaluable in understanding biological networks, but the utility of this information has been limited both by the difficulty in accurately detecting the communities, and also by the lack of formal optimized ways to use this community information. Thus, to date, module-assisted methods have been inferior to simple neighbor-assisted approaches for protein function prediction13,14,15.
Community detection involves two parts: first, definition of what constitutes a ‘community', typically measured by some cost function, and second, computationally partitioning the elements into subgroups (communities) such that the value of the cost function is either maximized or minimized (depending on the function). While significant attention has been paid to details of the cost function, much less has been paid to its implementation. Nonetheless, the actual partitioning of the group into sub-groups is computationally challenging (NP-hard), and in practice, a cost-function is only useful if appropriate communities — that optimize it — can be found.
Among various definitions of a community, modularity is most widely used6,16. The modularity (Q) measures the relative density of intra-community connectivity, compared to a randomly re-wired counterpart with the same degree of nodes. Maximization of Q recasts the community detection problem into a global optimization problem. As the network size increases, the computational complexity of Q-maximization increases more rapidly than exponential growth, so simple enumeration is impractical. Rather than attacking the difficult problem of developing methods to find the optimal solution, many fast heuristic methods have been employed. Therefore, despite its popularity, little is known about the utility of a community detected via Q-maximization. A fundamental assumption is that the quality of community structure correlates with its Q, and that from higher quality communities one can ultimately derive more accurate insights, but the actual validity of this hypothesis in the context of real-world applications has not been shown.
Here, we present a new community detection approach based on Q-maximization, using the global optimization technique called conformational space annealing (CSA)17,18 (Fig. 1). CSA is quite efficient in solving difficult combinatorial optimization problems, with recent success in protein structure prediction19,20,21,22. The similarity between community detection and protein structure prediction is that both are computationally challenging. Here, we show that applying CSA to community detection via Q maximization provides higher Q and more converged solutions, displaying far less variability than the usually used simulated annealing (SA) — considered to be the most accurate method so far12,23,24. Secondly, we demonstrate that partitioning with a higher Q value does indeed result in a more coherent organization of a biological network, and that such a community structure allows extraction of additional hidden information. Thirdly, building on this improved detection of community structure, we developed a systematic approach to integrate this community information with neighbor information, which significantly enhances protein function prediction. Finally, we note that CSA can also be used to improve partitioning based on other cost functions.
Figure 1. Schematic representation of the CSA algorithm is shown.
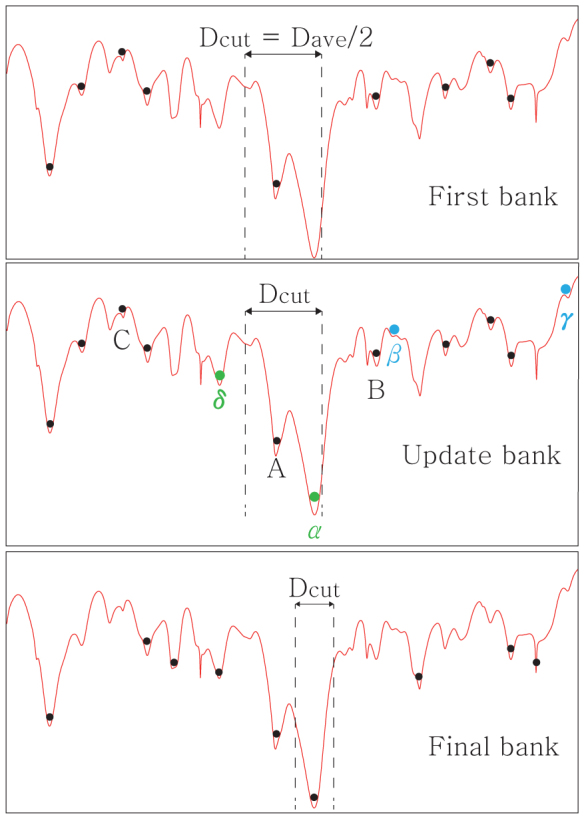
The x-axis shows the schematic representation of the solution space, and y-axis represents the objective function: energy for physical systems or -Q for community detection. For the first stage of CSA (top panel), a bank of initial solutions are randomly generated, minimized (black dots) and initial distance cutoff, Dcut, is set to the half of average distance between solutions. Middle panel: For each generation of CSA, trial solutions (green and blue dots) are generated by perturbing a subset of solutions using others in the bank. Four update rules are used to find good solutions while keeping the diversity of bank. First, if a trial solution (γ) is worse than the worst solution (C) in the bank, it is discarded immediately. If a trial solution is better than C, it is compared with its nearest neighboring solution in the bank. If the distance between the trial solution and its nearest neighbor is less than Dcut (α and β), the solution with better objective function value remains: α replaces A, B remains and β is discarded. If a trial solution (δ) is away from others further than Dcut, it is considered as a novel solution and replaces the worst solution (C). Dcut decreases gradually as the simulation proceeds. When no better solutions are found, CSA terminates, and the final bank solutions correspond to various local minima (bottom panel).
Results
Benchmark tests for Q optimization on synthetic networks
We first apply CSA-based Q-maximization to LFR graphs25, test graphs used to simulate real-world networks, with known pre-defined properties. These artificially generated graphs use a total of 1000 nodes, by assigning 4000 edges between them. Nodes are grouped into pre-determined communities, and various mixing probabilities (abundance ratio between inter- and intra-community edges) are used. Thus, the actual communities are known by construction, allowing one to quantitatively assess the efficacy of specific approaches in computationally detecting them. How representative are these test graphs? In networks with higher mixing probabilities, it is expected to be more difficult to use Q optimization to detect the actual community structure. While each biologically relevant network will have somewhat different parameters, many (like those below) have between a few hundred and a few thousand nodes, and a modularity Q in the range of 0.4 to 0.8. Thus, the range of test graphs used here spans many relevant conditions. To compare the optimization efficiency in a statistically relevant manner, we performed 50 independent runs of CSA and SA.
As summarized in Table 1, CSA outperforms the current state-of-the-art SA. As the optimization problem becomes difficult (increased mixing) the community structure generated by CSA is of higher Q, and critically, is more consistent with the pre-set community structure, represented by the higher value of recovery accuracy (ACC). As an added benefit, regardless of optimization difficulty, the computational cost of CSA is significantly less than that of SA. Unlike SA, in addition to running faster, CSA can be efficiently operated in a parallel fashion26. Thus, CSA using 8 CPU cores can generate SA-equivalent results using less than 1% of wall-clock time. Maximization of Q by CSA also worked well with other benchmark networks27.
Table 1. Benchmark results on LFR graphs with 1,000 nodes and 4,000 edges are summarized. Entries in bold indicate improved accuracy of one method relative to the other.
| Mixing Prob. | <QCSA>/<QSA> | <ACC1CSA>/<ACC1SA> | CSA time (sec) | SA time (sec) | Time (CSA = SA)2 |
|---|---|---|---|---|---|
| 0.05 | 0.9045/0.9045 | 1.0000/1.0000 | 63.5 | 2199.5 | – |
| 0.10 | 0.8638/0.8638 | 0.9994/0.9994 | 107.5 | 2422.4 | – |
| 0.15 | 0.8115/0.8115 | 1.000/1.000 | 103.7 | 2563.2 | – |
| 0.20 | 0.7585/0.7585 | 0.9990/0.9990 | 100.4 | 4095.3 | – |
| 0.25 | 0.7090/0.7090 | 1.0000/1.0000 | 104.0 | 2994.3 | – |
| 0.30 | 0.6641/0.6641 | 0.9974/0.9974 | 128.1 | 3596.5 | – |
| 0.35 | 0.6141/0.6140 | 0.9952/0.9946 | 142.8 | 4417.5 | 35.2 |
| 0.40 | 0.5641/0.5639 | 0.9936/0.9926 | 175.1 | 4784.9 | 40.9 |
| 0.45 | 0.5118/0.5114 | 0.9811/0.9794 | 219.6 | 6442.2 | 44.4 |
| 0.50 | 0.4675/0.4665 | 0.9705/0.9675 | 276.4 | 8350.1 | 54.3 |
| 0.55 | 0.4209/0.4190 | 0.9367/0.9342 | 405.0 | 24408.8 | 70.8 |
| 0.60 | 0.3711/0.3691 | 0.8671/0.8545 | 699.2 | 94170.1 | 126.5 |
1ACC measures the accuracy of the identified community structure against the preset arrangement.
2Average wall-clock time of CSA using 8 cores reaching to the average modularity obtained by SA is shown.
Application to biological networks
We next applied community detection to three biological networks: metabolic networks of Treponema pallidum and Escherichia coli, and the protein-protein-interaction (PPI) network of Saccharomyces cerevisiae. For the T. pallidum study, we generated the network according to the previous study7; details are provided in Supplementary Materials. The other two networks and related meta data were kindly provided by Ahn, Bagrow and Lehmann7. The results from these three networks are summarized in Fig. 2.
Figure 2. For three biological networks we display the relationship between modularity Q and two quality measures, the number of enriched functional clusters (left) and quality E (right).

We used P-value thresholds of 10−2, 10−4 and 10−7 for T. pallidum, E. coli and S. cerevisiae, respectively. For all three networks, CSA results (ο) are showing higher Q values and better qualities in both measures than SA ones (+). Note that CSA runs all converged into identical solutions for metabolic networks of T. pallidum and E. coli.
We observe that CSA-generated community structures are of higher modularity than SA-generated ones, as judged by Q-value. How useful are the detected communities? Despite many modularity-based studies6,12, it has not yet been clear whether a higher Q partition is more meaningful. To determine the effectiveness of the partitioning, we used two measures. First, we looked at the number of enriched functional clusters, i.e. those that belong to a particular community in a significantly non-random fashion (see Supplementary Materials). In all cases, relative to SA, the CSA-generated community structure has a larger number of enriched functional clusters (Fig. 2, left), suggesting that the sub-groups are more meaningful. We emphasize that the result is insensitive to the variation the P-value threshold (Fig. S4–S9). As a particular example, for the E. coli metabolic network, from the P-value analysis on functional clusters of the KEGG pathway annotation, the average numbers of enriched functional clusters of CSA and SA solutions respectively were found to be 27.0 and 22.3, with a P-value threshold of 10−4. The entire list of enriched functional clusters of E. coli metabolic and S. cerevisiae PPI networks is provided in the Supplementary Materials.
We also looked at the quality of the partitioning, E, which measures the extent of common features shared between nodes in the community (see Methods). In general, we found a correlation between increased modularity Q and increased quality E (Fig. 2, right). Thus, two distinct criteria suggest that relative to SA, the communities detected by CSA — with increased modularity — are likely to capture more useful ‘hidden' information.
To build intuition into how the partitioning differed between CSA and SA, we looked in more detail at partitioning of the E. coli metabolic network. While the Q values of the detected community structures between the best SA (Q = 0.3989) and CSA (Q = 0.4021) solutions might not appear that different, at the level of partitioning there is an obvious difference (Fig. 3). In the SA-generated partitioning, we observe a large single community (larger purple squares, top) that, in the CSA solution, is actually divided into three smaller communities (two indicated by red and blue shaded areas, and the other by large squares, bottom). These smaller communities are useful in that they represent additional functional modules. In the CSA solution, four additional enriched functional modules (Phenylalanine, tyrosine and tryptophan biosynthesis; Aminosugars metabolism; Peptideoglycan biosynthesis; D-glutamate and D-glutamate metabolism) are identified with P-value of 10−4.
Figure 3. A comparison of community structures of metabolic network of E. coli from CSA (Q = 0.4021) and SA (Q = 0.3989) is shown.

Nodes of one community by SA are split into three communities by CSA (two indicated by red and blue shaded areas and the other one by the other large squares). Meaningful functional clusters of KEGG pathway annotations with P-value less than 10−4 are listed.
One important feature of CSA-mediated community detection is that it is more reproducible. This can be seen in Fig. 2: for the smaller T. pallidum and E. coli networks, CSA repeatedly found a single solution (red circle), better than any of the many solutions (blue crosses) found by SA. Similarly, for the more challenging S. cerevisiae network, the multiple solutions found by CSA (red circles) are both better than the multiple solutions found by SA (blue crosses), and more closely grouped.
In principle, there could be degeneracy in Q values, that is, different community structures could have the same Q. We therefore wanted to test whether the similarity or identity in Q-values found for the different CSA runs in Fig. 2(top) actually reflected true similarity or identity in partitioning. To answer this question, we more deeply investigated the T. pallidum test case, a network containing 411 nodes of metabolites. After carrying out 50 independent CSA and SA runs, the highest Q solution from each run was chosen. These 100 solutions—sorted in Q—are shown in Fig. 4, along with pair-wise normalized mutual information (NMI) score. NMI measures the similarity between two partitions, with unity corresponding to identical partitions. Notably, all 50 CSA runs generated the identical solution with Q = 0.5477, which indicates that this is likely the global maximum Q solution, considering both the stochastic nature of the method, and the relatively small size of the network. Because the NMI between these solutions was 1, they represent the same partitioning, suggesting that here, degeneracy is not an issue. On the other hand, the 50 SA runs produced 50 separate solutions where Q ranges between 0.5426 and 0.5341, and for these, the average NMI between SA solutions was 0.913, suggesting that indeed, each time SA is applied to the same network, it results in a somewhat distinct partitioning.
Figure 4. Q and pair-wise NMI are shown for 100 community structures (the first 50 from CSA and the second 50 from SA).

Solutions are sorted according to their Q values. 50 independent CSA runs generated the identical solution with Q = 0.5477 while SA solutions (~1% worse in Q) are rather diverse24. Average computational times for CSA and SA are 31 s and 2004s, respectively, and the average CSA time to obtain an equivalent SA result is 16.3 s.
Recently, the difficulty of Q-maximization by SA was suggested to originate from the highly degenerate nature of Q24. However, the current study with the LFR networks and the metabolic networks of T. pallidum and E. coli, as tested by NMI, suggests that this is not a problem: finding a reproducible globally optimal Q partition—leading to a unique partitioning of a network with about 103 nodes—appears to be possible with CSA. If so, at least for small to moderate networks, the community detection problem by Q-maximization is essentially solved, and future advances will be based either on optimizing functions other than modularity Q, or, on better use of the detected community data.
Using community information to improve protein function prediction
Protein function prediction is one of the most important issues in the current post-genomic era. Biological interaction networks are modular, so finding the community structure of a PPI network has been regarded as a promising approach to improve function prediction over existing methods. Surprisingly, however, attempts to incorporate community structure for function prediction have been somewhat limited and not very successful, especially compared to simple neighbor-assisted methods13,14,15,28,29. We suggest that this failure of community-based methods reflects both a failure in correct detection of the underlying communities (see above), combined with an over-simplified way of utilizing community information (see next).
In most community-based approaches to date, if a function from a community is signified by a low P-value, the function is assigned to all nodes in the community. This approach is likely to induce large false-positives, leading to low prediction accuracy, and makes such approaches of limited utility14,15.
As an alternative to such a low-resolution assignment of function, we employed a random forest (RF)30 machine learning technique. We applied it on the yeast PPI network by carrying out leave-one-out cross-validation with GO annotations31. That is, for each protein, we assumed that its function(s) were unknown. We then made predictions of its function(s) based on a set of input features generated only from the network topology (including e.g. which communities its neighbors were in, their functions, etc.). By completely deleting a node/protein and considering the network and GO annotations from the other 2728 proteins, an RF consisting of 500 classification trees was trained to maximize the function prediction for 2728 proteins. The trained machine was then used to predict the function of the deleted protein. This procedure was repeated independently for all 2729 proteins. Community structure was used as one of the inputs into the prediction by including it in the feature vector for RF. To determine the importance of this information, this feature vector was constructed with and without community information (see Supplementary Materials). In addition, for comparison, we also carried out all currently available outstanding methods including majority voting28, neighborhood enrichment14,15 and two Markovian random field (MRF) methods29,32,33 which all utilize only local information such as the ranking of functional frequency present in the neighboring proteins. These methods are currently the state of the art in the field of protein function prediction34.
When making predictions, two aspects are important: what percentage of the time a prediction is correct (precision), and overall, how many correct predictions are made relative to the total number that in principle could be made (recall). Obviously, there is a trade-off: one can make only those few predictions about which one has high certainty, or one can strive to make more predictions, at the cost of increased error. In practice, this can be summarized by a Precision-Recall curve, where  and
and  , with TP the number of correctly predicted functions, FP the number of incorrect predictions, and FN the number of annotated functions predicted not to exist. Overall, the integrated area under this curve (AUC)35 is a quantitative measure of a particular method, with increased AUC corresponding to increased precision for a particular amount of coverage (recall) on average.
In Table 2, we use this AUC metric to compare the efficiency of various methods. MRF methods are currently considered to be the most efficient, and indeed MRF by Karaoz et al.33 performs better than other existing methods in our hands. However, for all three GO domains (biological process (BP), cellular component (CC) and molecular function (MF)), our new implementation of the RF method (RF-comm-CSA), utilizing the best CSA solution performed the best overall. While not as good as RF-comm-CSA, the AUC values of RF-local (without community information) were still better than MRF on average. Importantly, when the community information was properly used, the improvement of RF-comm-CSA over MRF by Karaoz et al. was 15.9%/4.4%/8.7% for BP/CC/MF.
Table 2. The efficiency of protein function prediction methods are summarized. RF-comm/neigh refers to the random forest method with/without community information. MRF and MCL refer to Markovian random field and Markov clustering algorithm.
| AUC | |||
|---|---|---|---|
| Methods | BP | CC | MF |
| RF-comm-CSA (Q = 0.7737) | 0.343 | 0.528 | 0.201 |
| RF-comm-SA (Q = 0.7684) | 0.333 | 0.524 | 0.189 |
| RF-comm-MCL | 0.255 | 0.362 | 0.139 |
| RF-local | 0.330 | 0.490 | 0.185 |
| MRF by Karaoz et al. | 0.296 | 0.506 | 0.185 |
| MRF by Deng et al. | 0.266 | 0.436 | 0.165 |
| Neighborhood enrichment | 0.273 | 0.379 | 0.146 |
| Majority voting | 0.159 | 0.389 | 0.131 |
Armed with RF-local and RF-comm, as well as better and worse partitioning (from application of CSA vs. SA), we are now able for the first time to address the question: ‘when is community information useful in protein function prediction, and what aspects of the community structure are important?'. RF-local performed slightly better than MRF by Karaoz et al.33, by 2.8% on average for three GO domains. Thus, using RF with only local information is already quite good, better than the current gold standard. When we use RF-comm, as input we give it either the SA- or CSA-determined community structure. There is indeed an improvement of RF-comm over RF-local for both SA- or CSA-determined solutions (Table 2), answering part of the question: properly used, community information is valuable.
Intriguingly, the improvement of RF-comm-CSA and that of RF-comm-SA was roughly similar to each other for prediction of cellular component (CC) information (7.8% improvement in AUC using CSA, and 6.9% improvement using SA), but the improvement of RF-comm-CSA over SA was more pronounced for both biological process (BP) prediction (3.9% for CSA vs. 0.9% for SA) and for Molecular Function (MF) prediction (8.6% for CSA vs. 2.2% for SA). Thus, the additional information in the CSA-determined community was useful for both BP and MF prediction, but particularly important for MF prediction. Why is this so? We reasoned that there are likely some ‘easy' aspects of community detection that both CSA and SA do reasonably well, that are useful for CC, and some harder aspects of community detection that CSA does better at than SA, and that matter for BP and especially MF.
In general, if nodes are close by, they are easy/likely to be together in a community; the further apart two nodes are in a network, the harder it is to accurately place them in a community. Thus, we hypothesized that perhaps proximity is a relevant factor to consider, and the improvement in MF and to a lesser extent BP came from the fact that non-local information—as summarized by correctly detected extended community structures—was useful in those cases. To test this idea, we calculated two node similarity measures: p(n), the probability of sharing a common feature between two nodes separated by n edges, and the Jaccard coefficient, defined as the size of the intersection divided by the size of the union of the annotations (see Fig. 5).
Figure 5. Correlations between node-to-node distance and similarities of function annotations in the PPI network are displayed.

(a) Fraction of protein pairs sharing a common GO term of biological process (red), cellular component (blue) and molecular function (green) domains is shown. (b) Jaccard coefficient is used as a similarity measure.
With both measures, we observed that the node similarity for CC decays monotonically as a function of n, while the similarity for MF increases for n > 5. The similarity for BP is about constant for n > 3. The behaviors of BP and CC are consistent with a previous study36, whereas the increase of MF beyond n = 5 has not been reported. To test the statistical significance of the increase of MF, we performed t-tests of Jaccard measures between the n = 5, 6 and n = 6, 7 of MF results. The obtained t-values are 23.03 and 16.38, respectively, which indicates that the increase of correlation is statistically highly significant and that the distribution of MF annotations is qualitatively different from that of BP and CC.
Thus, for CC, most common features are shared between small n pairs, and one might expect that the differences between two community structures are not crucial. However, for MF, large n pairs contribute relatively more, and therefore details of community structures are important. This matches the improvement we see from incorporating community structure—when long-range relationships are not negligible, correct community-partitioning capturing these relationships correctly can be especially useful. Thus, our data suggest that although community information is in general useful, accurate community structure is particularly important for prediction of molecular function and to a lesser extent biological processes, where non-local community information is relevant
The above data suggest that long-range non-local data is particularly present for MF, and therefore may under specific conditions be a significant contributor to accuracy of prediction. Intuitively, its utility will likely depend not only on how well such long-range information is captured (by appropriate community structure) but also how much local information there is to use in its place—if local information is lacking, non-local information should be particularly important. To test this idea, we calculated the improvement of AUC values separately, considering nodes within a range of a number of neighbors. That is, we considered separately nodes that had only a few local inputs (k < = 3) to nodes with many local inputs (k > 20). The result is shown in Table 3.
Table 3. AUC values and relative improvements of prediction of molecular function by using community information are displayed. AUC values are calculated considering nodes with k in the range shown.
| Number of neighbors (k) | Number of proteins | RF-comm-CSA | RF-local | Improvement (%) |
|---|---|---|---|---|
| K ≤ 3 | 1358 | 0.114 | 0.103 | 10.7 |
| 3 < k ≤ 10 | 689 | 0.229 | 0.192 | 19.1 |
| 10 < k ≤ 20 | 343 | 0.340 | 0.334 | 1.8 |
| K > 20 | 340 | 0.360 | 0.368 | −2.2 |
Community information was most useful in predicting functions of sparsely connected proteins with less than ten interacting proteins for MF. Not only does this conceptually make sense, it is encouraging from a practical point of view, since newly investigated unannotated proteins are likely to have a small number of edges/connections to other proteins.
With this new validated approach, we thus attempted to predict functions of unannotated proteins. We find results that are quite consistent among domains (Table S1, Supplementary Materials). One example is YBR190W which is predicted to have BP of “RNA splicing”, CC of “Prp19 complex” and MF of “first spliceosomal transesterification activity”. Prp19 complex is involved in the transition from the precatalytic spliceosome to the activated form that catalyzes step 1 of splicing37. Another example is YOR379C whose BP and MF are predicted to be “regulation of transcription, DNA-dependent” and “sequence-specific DNA binding transcription factor activity”. The entire list of prediction results is provided in Supplementary Materials.
Discussion
Overall, our study shows that for small to moderate networks, CSA not only maximizes Q, but also in addition finds a unique community partitioning that is likely Q-optimal. This is faster, more reproducible, and more accurate than partitioning via SA. We demonstrate that the Q measure is indeed correlated with the quality/coherence of a community structure in the context of real-world data, providing direct support for the importance of devising an efficient Q optimization method. Combined with an RF-based prediction approach, a high quality community structure resulted in improved prediction of function (Fig. S10–12 and Table 2). This implies that many other existing community-based studies, such as a gene-disease network38, a disease-drug network39,40 and cancer diagnosis41,42, can possibly benefit from using a more accurate community structure without additional information.
A large advantage of CSA is that because it is a general global optimization algorithm, it can be readily used with other cost functions such as finding overlapping community structure43; various objective functions have already been proposed to detect overlapping communities of networks6,44,45. To demonstrate the generality of CSA, we applied it to the measure proposed by Shen et al.45, and assessed its performance on a word association network (see Fig. S2). The result shows that CSA generates more optimal solutions also for overlapping communities in terms of the measure used. Note that this was a ‘proof of concept' study, and while it demonstrates the utility of CSA, it should still be determined whether the improved partitioning achieved by CSA for overlapping communities actually corresponds to a higher utility community structure. Our results suggest that extensive search by CSA can be used as a starting point to assess the relative utility of various suggested measures for the overlapping communities, following the quantitative comparative approach used in this work.
The Markov Clustering (MCL) algorithm is one of the most popular algorithms in bioinformatics5,6. It simulates a stochastic flow through a network by alternating dissipation and reinforcement steps. MCL is simple to implement and works efficiently even for large networks. However, the application of MCL clustering of the yeast PPI network for function prediction resulted in relatively poor performance (RF-comm-MCL in Table 2), which could be attributed to many small communities generated by MCL (Fig. S3). Thus, for moderate size networks where a Q-maximization/CSA approach can be used, the current approach is preferred. Computationally, the increased speed of CSA relative to SA should allow its application to larger networks (see below).
Our approach is the first network-based method for protein function prediction utilizing community information which clearly outperforms local-information based methods28,32,33. We show that the community structure itself contains useful information, and that it can be combined with a machine learning approach by using the purely topological properties of nodes as input features, which has not been reported. There are several studies, which employed machine-learning approaches to combine the network information with the external information to enhance the prediction quality13,14,46,47,48,49. It is promising that with only computational efforts, without additional information, the quality of prediction can be significantly enhanced.
To identify the origin of the improvement of MF prediction, using the PPI network, we measured the amount of improvement in each subclass of molecular function. The largest improvement was observed in the prediction of ‘DNA binding' function, GO:0003677, and more specifically, 4 out of the 6 most improved proteins were involved in DNA repair processes. In general, analysis of a PPI-network might not reveal much information about MF, since, typically, proteins of different molecular functions interact with each other to accomplish a particular biological goal. For example, a typical ribosomal protein complex consists of proteins with separate molecular functions, which work properly only when the complex is formed. For this reason, most network analyses consider only BP and CC annotations. However, many proteins with the function of ‘DNA binding' work in a sequential fashion, rather than forming a large direct complex. For example, DNA repair involves a series of biological processes executed sequentially by different complexes; initial damage recognition, opening of DNA double helix, DNA exonuclease, DNA polymerase and DNA ligase. After each complex finishes its function, it recruits and interacts only with the proteins of the subsequent complex on the queue. In this case, each complex needs at least one ‘DNA binding' protein but not all participants need to have the ‘DNA binding' function. Therefore, proteins with ‘DNA binding' function are likely to have a small number of direct neighbors sharing the function. Neighbor-assisted methods are not efficient to predict such cases. However, by considering community structure, the indirect relevance can be captured by calculating statistical significance of the function within the community. For instance, ‘YOL090W': MSH2 protein, which forms heterodimers with Msh3p and Msh6p in order to bind at a DNA mismatch location to initiate the mismatch repair, possesses 12 MF annotations. By using an MRF method, only one function (DNA binding) is correctly predicted because the majority of its direct neighbors do not share the other functions. However, in our method, nine additional annotations are correctly predicted due to their highly enriched characteristics signified by the community information.
Our approach, data-mining from global and local topological features of a network, can be a general framework for predicting hidden properties from social as well as biological networks. In particular, we believe that the conceptual advance clarifying when local vs. longer-range community information is important—and how to approach such a question—will have ramifications for many disciplines where network science is used.
The limitation of CSA method is its scalability, which makes it hard to be applied to very large networks27. Previously, we estimated the complexity of CSA as  , where
  is the number of nodes. This is better than that of SA,
  , but worse than that of MCL,
  , where
  is the pruning parameter (k ≪ n). This limitation can be overcome in two ways: 1) by using a fast heuristic for local Q maximization and 2) with the help of parallel computing. In this work, for local Q maximization, we used quenching, equivalent to SA at T = 0, which is quite slow but explores solution space more thoroughly. Replacing it with a fast heuristic can significantly reduce the computational cost. Unlike SA, CSA can be implemented in a parallel way, which makes it applicable to large networks that are inaccessible by SA.
All data used and generated in this work including networks and identified community structures are available by request. In addition, we developed a web server to provide an automated way for researchers interested in using community detection to analyze their network data. For networks containing up to 2,000 nodes, our server will perform Q optimization and return the generated community structures.
Methods
CSA is a global optimization method, which combines essential ingredients of three methods: Monte Carlo with minimization (MCM)50, genetic algorithm (GA)51, and SA23. As in MCM, we consider only the solution space of local minima; i.e., all solutions are minimized by a local minimizer. As in GA, we consider many solutions (called ‘bank' in CSA) collectively, and we perturb a subset of bank solutions using others in the bank. This procedure is similar to mating in GA. Finally, as in SA, we introduce a parameter Dcut, which plays the role of the temperature in SA. In CSA, each solution is assumed to represent a hyper-sphere of radius Dcut in the solution space. Diversity of sampling is directly controlled by introducing a distance measure between two solutions and comparing it with Dcut to deter two solutions from coming too close to each other. The value of Dcut is slowly reduced just as in SA, hence the name CSA.
In CSA for modularity optimization, a community structure is represented by assigning an index to each node, where nodes with an identical index belong to the same community. We start with 50 random partitions which are locally optimized by quench procedures; this is equivalent to SA at T = 0. We call this set the first bank, which remains unchanged and works as a reservoir for future perturbations. We make a copy of the first bank and call it the bank. The partitions in the bank are updated by better ones found during the search. The initial Dcut value is set as half of the average distance between solutions in the first bank, Dave. The distance between two community structures is measured by the variation of information52 defined by, 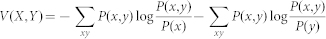 with
with  and
and  .
.  is the number of nodes included in the community
  and
and  is the number of nodes included both in the community
  in partition
  and community
  in partition
  .
.
For each generation of CSA, 30 partitions are selected as seed partitions. With each seed partition, 20 trial partitions are generated by cross-over between the seed and a randomly chosen partition from the bank, and 5 trial partitions are generated by random mutation of the seed. For a cross-over, we use two operators: a convergent copy and a divisive copy. In both operators, one community structure from a source partition is copied to a target partition. For the convergent copy, the new index is chosen from one of the neighboring indices of the copied nodes from the target in a random fashion. For a divisive copy, a new index not present in the target is chosen. The rationale of using these operators is that the community index itself has no particular meaning, while a well-defined community structure from one solution can serve as an advantageous feature that should be preserved to generate a better solution. Mutations are performed by random merge and split operations. The random merge consolidates two neighboring communities. The random split divides a community into two groups by randomly assigning new indices. All trial partitions are locally optimized by quench, and compared with the existing partitions in the bank.
Four update rules are used to find good solutions while keeping the diversity of bank. First, if a trial solution is worse than the worst solution in the bank (C in Figure 1), it is discarded immediately. For trial solutions better than the worst one in the bank, the following procedure is carried out. A trial solution is compared with its nearest neighboring solution in the bank. If the distance between the trial solution and its nearest neighbor is less than Dcut, the solution with better objective function value remains (the other is discarded). If the trial solution is away from others further than Dcut, it is considered as a novel solution and it replaces the worst solution in the bank. Dcut decreases gradually as the simulation proceeds until it reaches to the lower bound of the cutoff, Dave/5. When no better solutions are found, CSA terminates. The pseudo code for the CSA procedure is provided in Supplementary Materials (Fig. S1).
Below, we compare community structures as determined by SA and CSA. To do so, we need measures —independent of how well Q was minimized—to assess the utility of the communities. To quantify the usefulness of the detected communities, we used a metadata-based approach7. Metadata of network nodes are separately constructed, independent from the network itself. Properties of each node of a network are collected and assigned into its tag. The Quality (E) of a community's structure is expressed as:  , where
  is the average metadata similarity of all pairs in community c containing
  nodes. The metadata similarity between two nodes is defined as unity if they share a tag.
Another quality measure used is the hyper-geometric P-value, which is especially useful when analyzing biological networks. If f is the total number of proteins associated with a particular function out of n proteins, the probability of observing at least k proteins with the same function inside a module containing m proteins can be computed as:  . The P-value corresponds to the probability that a number of proteins sharing the same function are grouped into a module by chances.
In this case, a function associated with a lower P-value is statistically more meaningful, and the P-value can thus be used to measure the functional enrichment by community detection.
Author Contributions
J.L. and J.L. designed and performed research, analyzed data and wrote the paper; S.G. analyzed data and wrote paper. All authors discussed the results and commented on the manuscript.
Supplementary Material
Supplementary Materials
Acknowledgments
The authors thank Y.-Y. Ahn, J.P. Bagrow and S. Lehmann for providing their networks and corresponding meta data for E.coli metabolic network and S. Cerevisiae PPI network. This work was supported by the National Research Foundation of Korea (NRF) grant funded by the Korea government (MSIP) (No. 2008-0061987). We also like to acknowledge the support from the KISTI Supercomputing Center (KSC-2012-C3-01).
References
- Watts D. J. & Strogatz S. H. Collective dynamics of ‘small-world'networks. Nature 393, 440–442 (1998). [DOI] [PubMed] [Google Scholar]
- Jeong H., Tombor B., Albert R., Oltvai Z. N. & Barabasi A. L. The large-scale organization of metabolic networks. Nature 407, 651–654 (2000). [DOI] [PubMed] [Google Scholar]
- Newman M. E. J. & Watts D. J. The structure and dynamics of networks. (Princeton Univ Press, 2006). [Google Scholar]
- Girvan M. & Newman M. E. J. Community structure in social and biological networks. Proceedings of the National Academy of Sciences of the United States of America 99, 7821–7826 (2002). [DOI] [PMC free article] [PubMed] [Google Scholar]
- Enright A. J., Van Dongen S. & Ouzounis C. A. An efficient algorithm for large-scale detection of protein families. Nucleic Acids Research 30, 1575–1584 (2002). [DOI] [PMC free article] [PubMed] [Google Scholar]
- Fortunato S. Community detection in graphs. Physics Reports 486, 75–174 (2010). [Google Scholar]
- Ahn Y. Y., Bagrow J. P. & Lehmann S. Link communities reveal multiscale complexity in networks. Nature 466, 761–764 (2010). [DOI] [PubMed] [Google Scholar]
- Aldecoa R. & Marín I. Deciphering network community structure by surprise. PLoS ONE 6, e24195 (2011). [DOI] [PMC free article] [PubMed] [Google Scholar]
- Rives A. W. & Galitski T. Modular organization of cellular networks. Proceedings of the National Academy of Sciences of the United States of America 100, 1128–1133 (2003). [DOI] [PMC free article] [PubMed] [Google Scholar]
- Spirin V. & Mirny L. A. Protein complexes and functional modules in molecular networks. Proceedings of the National Academy of Sciences of the United States of America 100, 12123–12128 (2003). [DOI] [PMC free article] [PubMed] [Google Scholar]
- Wilkinson D. M. & Huberman B. A. A method for finding communities of related genes. Proc. Natl. Acad. Sci. USA 101, 5241–5248 (2004). [DOI] [PMC free article] [PubMed] [Google Scholar]
- Guimera R. & Amaral L. A. N. Functional cartography of complex metabolic networks. Nature 433, 895–900 (2005). [DOI] [PMC free article] [PubMed] [Google Scholar]
- Rentzsch R. & Orengo C. A. Protein function prediction-the power of multiplicity. Trends in Biotechnology 27, 210–219 (2009). [DOI] [PubMed] [Google Scholar]
- Sharan R., Ulitsky I. & Shamir R. Network-based prediction of protein function. Molecular Systems Biology 3, 88 (2007). [DOI] [PMC free article] [PubMed] [Google Scholar]
- Song J. & Singh M. How and when should interactome-derived clusters be used to predict functional modules and protein function? Bioinformatics 25, 3143–3150 (2009). [DOI] [PMC free article] [PubMed] [Google Scholar]
- Newman M. E. J. & Girvan M. Finding and evaluating community structure in networks. Phys. Rev. E: Stat. Phys., Plasmas, Fluids 69, 026113 (2004). [DOI] [PubMed] [Google Scholar]
- Lee J., Lee I.-H. & Lee J. Unbiased Global Optimization of Lennard-Jones Clusters for N ≤ 201 Using the Conformational Space Annealing Method. Physical Review Letters 91, 080201 (2003). [DOI] [PubMed] [Google Scholar]
- Lee J., Scheraga H. A. & Rackovsky S. New optimization method for conformational energy calculations on polypeptides: conformational space annealing. Journal of Computational Chemistry 18, 1222–1232 (1997). [Google Scholar]
- Joo K., Lee J., Kim I., Lee S. J. & Lee J. Multiple sequence alignment by conformational space annealing. Biophysical Journal 95, 4813–4819 (2008). [DOI] [PMC free article] [PubMed] [Google Scholar]
- Joo K. et al. High accuracy template based modeling by global optimization. Proteins: Structure, Function, and Bioinformatics 69, 83–89 (2007). [DOI] [PubMed] [Google Scholar]
- Joo K. et al. All atom chain building by optimizing MODELLER energy function using conformational space annealing. Proteins: Structure, Function, and Bioinformatics 75, 1010–1023 (2009). [DOI] [PubMed] [Google Scholar]
- Lee J., Sasaki T. N., Sasai M. & Seok C. De novo protein structure prediction by dynamic fragment assembly and conformational space annealing. Proteins: Structure, Function, and Bioinformatics (2011). [DOI] [PubMed] [Google Scholar]
- Kirkpatrick S., Gelatt C. D. & Vecchi M. P. Optimization by simulated annealing. Science 220, 671–680 (1983). [DOI] [PubMed] [Google Scholar]
- Good B. H., De Montjoye Y. A. & Clauset A. Performance of modularity maximization in practical contexts. Phys. Rev. E: Stat. Phys., Plasmas, Fluids 81, 046106 (2010). [DOI] [PubMed] [Google Scholar]
- Lancichinetti A., Fortunato S. & Radicchi F. Benchmark graphs for testing community detection algorithms. Phys. Rev. E: Stat. Phys., Plasmas, Fluids 78, 046110 (2008). [DOI] [PubMed] [Google Scholar]
- Lee J. et al. Efficient parallel algorithms in global optimization of potential energy functions for peptides, proteins, and crystals. Computer Physics Communications 128, 399–411 (2000). [Google Scholar]
- Lee J., Gross S. P. & Lee J. Modularity optimization by conformational space annealing. Physical Review E: Statistical Physics, Plasmas, Fluids, and Related Interdisciplinary Topics 85, 056702 (2012). [DOI] [PubMed] [Google Scholar]
- Schwikowski B., Uetz P. & Fields S. A network of protein-protein interactions in yeast. Nature Biotechnology 18, 1257–1261 (2000). [DOI] [PubMed] [Google Scholar]
- Vazquez A., Flammini A., Maritan A. & Vespignani A. Global protein function prediction from protein-protein interaction networks. Nature Biotechnology 21, 697–700 (2003). [DOI] [PubMed] [Google Scholar]
- Breiman L. Random forests. Machine Learning 45, 5–32 (2001). [Google Scholar]
- Consortium G. O. The Gene Ontology (GO) database and informatics resource. Nucleic Acids Research 32, D258–D261 (2004). [DOI] [PMC free article] [PubMed] [Google Scholar]
- Deng M., Zhang K., Mehta S., Chen T. & Sun F. Prediction of protein function using protein-protein interaction data. Journal of Computational Biology 10, 947–960 (2003). [DOI] [PubMed] [Google Scholar]
- Karaoz U. et al. Whole-genome annotation by using evidence integration in functional-linkage networks. Proceedings of the National Academy of Sciences of the United States of America 101, 2888–2893 (2004). [DOI] [PMC free article] [PubMed] [Google Scholar]
- Nabieva E., Jim K., Agarwal A., Chazelle B. & Singh M. Whole-proteome prediction of protein function via graph-theoretic analysis of interaction maps. Bioinformatics 21, i302–i310 (2005). [DOI] [PubMed] [Google Scholar]
- Hanley J. A. & McNeil B. J. A method of comparing the areas under receiver operating characteristic curves derived from the same cases. Radiology 148, 839–843 (1983). [DOI] [PubMed] [Google Scholar]
- Bader J. S., Chaudhuri A., Rothberg J. M. & Chant J. Gaining confidence in high-throughput protein interaction networks. Nature Biotechnology 22, 78–85 (2003). [DOI] [PubMed] [Google Scholar]
- Makarov E. M. et al. Small nuclear ribonucleoprotein remodeling during catalytic activation of the spliceosome. Science 298, 2205–2208 (2002). [DOI] [PubMed] [Google Scholar]
- Goh K.-I. et al. The human disease network. Proceedings of the National Academy of Sciences of the United States of America 104, 8685–8690 (2007). [DOI] [PMC free article] [PubMed] [Google Scholar]
- Hopkins A. L. Network pharmacology: the next paradigm in drug discovery. Nature Chemical Biology 4, 682–690 (2008). [DOI] [PubMed] [Google Scholar]
- Yildirim M. A., Goh K.-I., Cusick M. E., Barabási A.-L. & Vidal M. Drug-target network. Nature Biotechnology 25, 1119 (2007). [DOI] [PubMed] [Google Scholar]
- Taylor I. W. et al. Dynamic modularity in protein interaction networks predicts breast cancer outcome. Nature Biotechnology 27, 199–204 (2009). [DOI] [PubMed] [Google Scholar]
- Chuang H.-Y., Lee E., Liu Y.-T., Lee D. & Ideker T. Network-based classification of breast cancer metastasis. Molecular Systems Biology 3 (2007). [DOI] [PMC free article] [PubMed] [Google Scholar]
- Palla G., Derényi I., Farkas I. & Vicsek T. Uncovering the overlapping community structure of complex networks in nature and society. Nature 435, 814–818 (2005). [DOI] [PubMed] [Google Scholar]
- Lázár A., Ábel D. & Vicsek T. Modularity measure of networks with overlapping communities. Europhysics Letters 90, 18001 (2010). [Google Scholar]
- Shen H.-W., Cheng X.-Q. & Guo J.-F. Quantifying and identifying the overlapping community structure in networks. Journal of Statistical Mechanics: Theory and Experiment 2009, P07042 (2009). [Google Scholar]
- Marcotte E. M., Pellegrini M., Thompson M. J., Yeates T. O. & Eisenberg D. A combined algorithm for genome-wide prediction of protein function. Nature 402, 83–86 (1999). [DOI] [PubMed] [Google Scholar]
- Kelley R. & Ideker T. Systematic interpretation of genetic interactions using protein networks. Nature Biotechnology 23, 561–566 (2005). [DOI] [PMC free article] [PubMed] [Google Scholar]
- Zhao X.-M., Chen L. & Aihara K. Protein function prediction with the shortest path in functional linkage graph and boosting. International journal of bioinformatics research and applications 4, 375–384 (2008). [DOI] [PubMed] [Google Scholar]
- Linghu B. et al. High-precision high-coverage functional inference from integrated data sources. BMC Bioinformatics 9, 119 (2008). [DOI] [PMC free article] [PubMed] [Google Scholar]
- Li Z. & Scheraga H. A. Monte Carlo-minimization approach to the multiple-minima problem in protein folding. Proceedings of the National Academy of Sciences of the United States of America 84, 6611–6615 (1987). [DOI] [PMC free article] [PubMed] [Google Scholar]
- Goldberg D. E. Genetic algorithms in search, optimization, and machine learning. (Addison-Wesley Professional, 1989).
- Meilă M. Comparing clusterings—an information based distance. Journal of Multivariate Analysis 98, 873–895 (2007). [Google Scholar]
Associated Data
This section collects any data citations, data availability statements, or supplementary materials included in this article.
Supplementary Materials
Supplementary Materials