

Summary
Breast cancer is a heterogeneous disease and can be classified based on gene expression profiles that reflect distinct epithelial subtypes. We identify prostate derived ETS factor (PDEF) as a mediator of mammary luminal epithelial lineage-specific gene expression and as a factor required for tumorigenesis in a subset of breast cancers. PDEF levels strongly correlate with estrogen receptor (ER)-positive luminal breast cancer, and PDEF transcription is inversely regulated by ER and GATA3. Furthermore, PDEF is essential for luminal breast cancer cell survival, and is required in models of endocrine-resistance. These results offer insights into the function of this ETS factor that are clinically relevant and may be of therapeutic value for breast cancer patients treated with endocrine therapy.
Significance
ER is the defining transcription factor of luminal breast tumors, and endocrine agents that target ER are well-established standards of care in breast cancer. However, intrinsic and acquired resistance limits the success of this therapeutic strategy, highlighting the need to identify additional pathways critical for luminal tumor growth and recurrence. Our findings provide evidence that prostate derived ETS factor (PDEF) can drive luminal differentiation of basal mammary epithelial cells, regulate the survival of luminal tumor cells, and contribute to endocrine resistance. These findings suggest that increased PDEF expression may play a role in tumor recurrence following endocrine therapy and may be a clinically useful target for the treatment of patients with luminal breast cancer.
INTRODUCTION
Human breast cancer can be clustered into subtypes including basal, luminal, and ERBB2+ tumors (among others) based on gene expression profiling (Sorlie et al., 2001). Basal-like breast cancer is characterized by the absence of estrogen receptor (ER), progesterone receptor (PR), and ERBB2/HER2 and is commonly more aggressive and invasive, whereas luminal breast cancer is typically ER+ and is generally associated with a better prognosis. ER regulates gene expression in cooperation with coactivator or corepressor proteins and drives breast cancer cell survival and growth. This dependence is the basis for the treatment of ER+ luminal tumors with endocrine therapies including aromatase inhibitors that reduce estrogen levels and direct ER antagonists such as tamoxifen and fulvestrant (Osborne and Schiff, 2011). However, the long-term efficacy of these treatments is diminished by recurrence of resistant tumors that have lost dependence on estrogen for growth. Although some of the mechanisms underlying this acquired resistance have been identified, including altered ER regulation and increased HER2 activity, identification of other pathways is essential to inform the design of additional therapies for these patients.
The gene expression differences between basal and luminal breast cancers represent distinctions in the expression of lineage markers identified in the two types of normal mammary epithelial cells, basal myoepithelial cells surrounding the branching ductal structures and ductal luminal epithelial cells that generate milk-producing alveolar cells during pregnancy. These cells arise from a common multipotent stem/progenitor cell through a process of lineage commitment (Stingl et al., 2005). Altered regulation of developmental pathways has been proposed to play an important role in tumorigenesis and to contribute to the observed heterogeneity in breast cancer (Dontu et al., 2003). Identification of other factors that regulate mammary gland differentiation is important for understanding the mechanisms of breast cancer initiation and progression and for developing targeted treatments for each tumor subtype. Several transcription factors involved in both mammary development and breast cancer progression have been identified, including GATA3, which promotes luminal epithelial differentiation and exerts a tumor-suppressive function by sustaining differentiation and inhibiting metastasis (Asselin-Labat et al., 2007; Kouros-Mehr et al., 2008).
Members of the ETS family, such as ELF3, ELF5 and ETV4, have also been implicated in mammary development (Shepherd and Hassell, 2001) and are overexpressed in breast cancer, supporting a role in epithelial tumorigenesis (Galang et al., 2004; Kalyuga et al., 2012). Unlike most ETS proteins, the expression of prostate derived ETS factor (PDEF/SPDEF), which was first identified as an activator of prostate specific antigen (Oettgen et al., 2000) is largely restricted to epithelial tissues including the lung, stomach, colon, and hormone-regulated epithelia such as the prostate, breast, and ovary. In these tissues, PDEF mediates epithelial cell fate decisions and secretory cell differentiation (Gregorieff et al., 2009; Park et al., 2007); however, it is unclear whether PDEF functions similarly in the mammary gland. There is also little known about the regulation of PDEF expression apart from miRNA-mediated suppression in basal breast cancer cell lines (Findlay et al., 2008).
PDEF also appears to play a role in regulating tumor growth and loss of PDEF is associated with a more aggressive phenotype in prostate and colon cancer (Gu et al., 2007; Moussa et al., 2009). However, the role of PDEF in breast cancer is controversial, as several studies have demonstrated that PDEF expression is lost in invasive basal breast cancer cell lines, and that its re-expression inhibits the growth and migration of these cells, supporting a tumor-suppressive function (Feldman et al., 2003; Turner et al., 2007). In contrast, PDEF cooperates with known oncogenes to stimulate MCF-10A cell transformation (Gunawardane et al., 2005) and is one of the most highly overexpressed genes in human and mouse mammary tumors and in lymph node metastases (Galang et al., 2004; Ghadersohi and Sood, 2001). Furthermore, PDEF expression is enriched in luminal tumors and correlates with poor overall survival in ER+ breast cancer patients, suggesting instead a possible oncogenic role (Sood et al., 2009; Gunawardane et al., 2005; Sood et al., 2007).
In this study we sought to investigate and clarify the role of PDEF in both normal mammary gland development and breast cancer. We hypothesize that PDEF may be important for the differentiation of normal mammary luminal cells and that this transcription factor may function differentially in luminal versus basal breast tumors.
RESULTS
PDEF Induces a Luminal Epithelial Gene Expression Program in Mammary Epithelial Cells
To investigate PDEF function in the mammary gland, we examined the effect of this transcription factor on gene expression using microarray-based profiling of MCF-10A cells. These cells are non-transformed mammary epithelial cells that express protein and gene expression programs of basal epithelial cells (Neve et al., 2006) and undetectable levels of endogenous PDEF (Gunawardane et al., 2005). Bioinformatics analysis of the genes induced or repressed by PDEF overexpression in MCF-10A cells revealed a striking effect on expression of luminal and myoepithelial cell markers. The heat map in Figure 1A shows the effects of PDEF overexpression on genes previously identified to be most specifically expressed in purified populations of primary luminal (left column, yellow) or myoepithelial cells (left column, blue) (Allinen et al., 2004; Jones et al., 2004). PDEF overexpression induced a switch in gene expression, resulting in the induction of luminal markers such as ERBB3, MUC1, and AZGP1 and the concomitant suppression of myoepithelial marker genes, including K14, CAV1, and DCN. A complete list of the significantly regulated genes from the microarray is shown in Table S1.
Figure 1. PDEF Induces a Luminal Lineage-specific Gene Expression Profile in Non-Transformed Mammary Epithelial Cells.

(A) Heatmap generated from microarray analysis of triplicate samples of MCF-10A cells expressing either vector control (pBabe) or PDEF. Differentially expressed mammary epithelial marker genes are shown. These expression changes were statistically significant (p=4.14 × 10⁻¹⁴ by Fisher’s exact test).
(B) Western blot analysis of vector control or PDEF-expressing MCF-10A cells (*non-specific band).
(C) Immunofluorescent staining for keratins 8 and 14 in MCF-10A cells. Representative images of vector control and PDEF-expressing cells are shown. Scale bars represent 100μM. Quantitation is shown in graph. Data represent mean +/- SEM (***p< 0.0007).
(D) Western blot confirming PDEF overexpression in human mammary epithelial cells (HMECs).
(E) Real-time PCR analysis of luminal (left) and basal (right) marker gene expression in HMECs overexpressing PDEF. Results were normalized to the housekeeping gene RPLP0 and are presented as mean fold change +/- SD (*p< 0.05, **p<0.008).
(F) Flow cytometry surface marker analysis of HMECs using antibodies for the luminal gene EpCAM and the myoepithelial gene CD10. A representative experiment is shown; similar results were obtained in two independent experiments.
(G) PDEF overexpression in COMMA-1D murine mammary epithelial cells was detected by western blot (top). PDEF downregulation was detected by real-time PCR (bottom); two independent shRNAs (PDEF KD: KnockDown #1 and #2) were used and compared to a non-specific (N.S.) shRNA control. Results were normalized to the housekeeping gene RPLP0 and are presented as mean fold change +/- SEM (*p< 0.02, ***p<0.0005).
(H) COMMA-1D cells infected with lentivirus to modulate PDEF expression were plated on a layer of irradiated fibroblast feeder cells for colony formation assays. Colonies were scored based on K8 (red) and K14 (green) staining and categorized into three types of colonies: K8+ luminal, K14+ myoepithelial, or K8+K14+ mixed colonies. Representative images of each type of colony are shown (left), scale bars represent 100μM. Quantitation of PDEF-overexpressing cells (middle panel, +/- SEM) and PDEF-downregulated cells (right panel, +/- SD) are shown as the average fold change in colony number across three experiments compared to vector or N.S. control cells (*p<0.05, **p<0.006, ***p<0.0001).
(I) Box plot displaying PDEF mRNA levels in mammary stem cells (MaSC), luminal progenitors, mature luminal cells, and stromal cells derived from gene expression analysis of purified human mammary epithelial subpopulations (Lim et al., 2009).
(J) Relative mRNA expression levels of luminal (left panel) and myoepithelial (right panel) markers in luminal progenitor cells transduced with PDEF-targeting shRNA (KD) or N.S. shRNA. Cells were harvested 5 days after infection. Bars represent fold change +/- SD of two independent experiments (*p<0.05, **p<0.01, ***p<0.001).
See also Figure S1 and Table S1.
These results were validated in MCF-10A cells at the mRNA level using quantitative real-time PCR (Figure S1A, B) and at the protein level by western blot (Figure 1B). Expression of PDEF also resulted in a shift to a luminal, EpCAM+CD10- phenotype (76.5% versus 45.9% in vector control cells) as determined by flow cytometry surface marker analysis (Figure S1C), as well as a significant increase in luminal keratin-8+ (K8) cells with a simultaneous decrease in the percentage of myoepithelial keratin-14+ (K14) cells (Figure 1C). In addition, PDEF expression in a second, independent cell line, non transformed human mammary epithelial cells (HMECs) (Figure 1D), also resulted in induction of luminal gene expression and inhibition of myoepithelial marker genes (Figure 1E) and a shift to a luminal, EpCAM+CD10- phenotype (83.4% versus 4.71% in vector control cells) (Figure 1F).
To further validate the possibility that PDEF regulates luminal differentiation, we examined the effect of modulating PDEF expression in a murine mammary epithelial cell line, COMMA-1D cells. These cells are derived from a mid-pregnant mouse and contain a population of stem/progenitor cells that are capable of both in vitro differentiation and mammary gland repopulation in transplantation assays (Danielson et al., 1984). Endogenous PDEF levels in these cells are low but can be detected using real-time PCR (Figure 1G). COMMA-1D cells were infected with lentiviral vectors expressing either PDEF cDNA or shRNAs targeting PDEF and then assayed for colony formation and scored for K8 and K14 staining (Figure 1H, left). PDEF mRNA was efficiently downregulated with each of two independent shRNAs (PDEF KnockDown #1 and #2), compared to a non-specific (N.S.) shRNA control. Similar to the effects of PDEF on keratin expression in MCF-10A cells, PDEF overexpression in COMMA-1D cells led to enhanced formation of K8+ luminal colonies and a reduction in K14+ colonies (Figure 1H, middle). In contrast, downregulation of PDEF expression decreased the formation of K8+ luminal colonies and resulted in an increased proportion of K8+K14+ mixed colonies (Figure 1H, right), suggesting a block in luminal differentiation and the accumulation of bipotent double-positive colonies in the absence of PDEF.
In addition, gene expression analysis of FACS-sorted primary human breast epithelial subpopulations (Lim et al., 2009) revealed that PDEF mRNA levels are enriched in the CD49f+EpCAM+ luminal progenitor cell population and are further enriched in CD49f-EpCAM+ mature luminal cells, as compared to the basal/mammary stem cell-enriched (Basal/MaSC) and stromal fibroblast populations (Figure 1I). In order to determine whether PDEF regulates the expression of luminal and myoepithelial differentiation markers, we used this same FACS-sorting approach to purify mammary epithelial subpopulations from a reduction mastectomy specimen (Figure S1D, E). Although sorted mature luminal cells could not be cultured, we were able to successfully grow luminal progenitor cells in vitro and evaluated the expression of several luminal and myoepithelial markers after PDEF silencing in these cells (Figure 1J). Interestingly, PDEF knockdown significantly decreased the expression of multiple luminal markers, whereas myoepithelial marker expression was not significantly affected. These results further support a role for PDEF in driving the expression of luminal-specific genes and promoting the differentiation of this subset of mammary epithelial cells.
PDEF is Co-Expressed with Estrogen Receptor (ER) and Is Regulated by ER-Cooperating Factors GATA3 and FOXA1
PDEF mRNA is significantly overexpressed in ERBB2+ and luminal A and B tumors in two independent datasets, as compared to basal-like tumors (Figure 2A). This correlation with the luminal subtype was also confirmed in breast cancer cell lines (Figure 2B). As ER expression is the major molecular determinant of luminal tumors (Perou et al., 2000), PDEF is significantly overexpressed in ER+ tumors (Figure 2C). Interestingly, PDEF is the only ETS transcription factor displaying a positive correlation with ER expression among the twenty-eight members of the family (Figure 2D). This correlation suggests that ER may regulate PDEF transcription.
Figure 2. PDEF Is Enriched in Luminal Tumors and Strongly Correlates with ER Expression.

(A, B) Box plots displaying PDEF mRNA levels between Basal-like, ERBB2+, and Luminal (Lum) subtypes of breast cancer (A) and breast cancer cell lines (B) using published microarray datasets (Lu et al., 2008; Perou et al., 2000; Neve et al., 2006).
(C) Box plots displaying PDEF mRNA levels between ER- and ER+ breast carcinoma (F.C.: Fold change) in published microarray datasets (Chin et al., 2006; Richardson et al., 2006; Wang et al., 2005).
(D) Heatmap displaying the relative expression levels of the 28 ETS transcription factors in ER- and ER+ breast cancer subtypes (Wang et al., 2005; Richardson et al., 2006; Chin et al., 2006) (N.D. not determined).
In order to determine if ER regulates PDEF expression, we analyzed a previously established ER cistrome dataset (Carroll et al., 2006) and found three ER binding regions located in the PDEF gene locus (Figure 3A). Two enhancers (1 and 2) are located within the first intron of the gene, and the third one (3) is located after the 3’-end of the gene. Direct ER chromatin immunoprecipitation (ChIP) in MCF7 cells showed an estradiol (E2)-induced recruitment of ER at these three enhancers, thus confirming PDEF as a direct ER target.
Figure 3. PDEF Is Not Directly Regulated by ER, But Is Activated by FOXA1 and Repressed by GATA3.
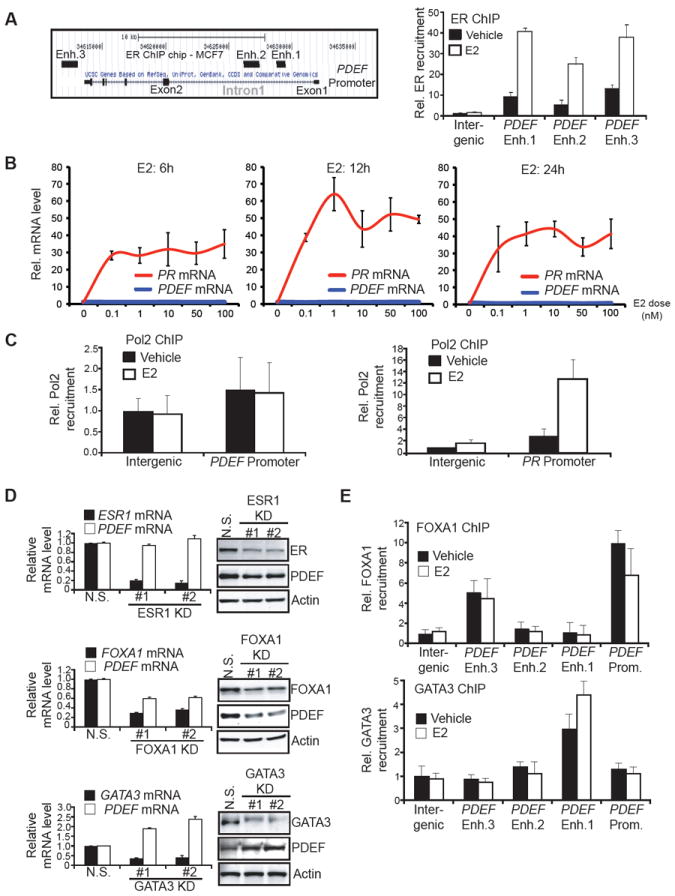
(A) Left panel: Schematic diagram of the ER-binding regions within the PDEF gene locus as defined by ER ChIP on chip in MCF7 cells (Carroll et al., 2006). Enh.: Enhancer. Right panel: Direct ER chromatin immunoprecipitation (ChIP) followed by qPCR after treatment of MCF7 cells with vehicle (black bars) or 10nM estradiol (E2, white bars). Data represent means +/- SD.
(B) PDEF and PR mRNA levels were determined by real-time PCR after MCF7 cells were treated with increasing E2 doses for 6h (left), 12h (middle), and 24h (right). mRNA levels are presented as means with SD and normalized to the housekeeping gene GAPDH.
(C) Direct RNA polymerase II (Pol2) ChIP followed by qPCR after treatment of MCF7 cells with vehicle or 10nM E2 using primers flanking the PDEF promoter (left panel) and PR promoter (right panel). Data represent means with SD.
(D) PDEF, ESR1, FOXA1, GATA3 mRNA and protein levels were determined by RT-qPCR (left panels) or western blot (right panels) after MCF7 cells were transfected with a non-specific (N.S.) or two independent siRNAs targeting ESR1/FOXA1/GATA3(KD: KnockDown). Data represent means with SD.
(E) Direct FOXA1 (Upper panel) and GATA3 (lower panel) ChIPs followed by qPCR after treatment of MCF7 cells with vehicle or 10nM E2. Enh.: Enhancer. Prom.: Promoter. Data represent means with SD.
See also Figure S2.
However, a time-course analysis of MCF7 cells treated with increasing E2 doses did not reveal PDEF mRNA induction, in contrast with the strong increase of progesterone receptor (PR) mRNA, a known direct ER target (Figure 3B). Direct RNA Polymerase II (Pol2) ChIP corroborated the absence of PDEF induction by E2. Pol2 recruitment at the PDEF promoter was not increased after E2 treatment, whereas its recruitment at the PR promoter was strongly induced (Figure 3C). We investigated whether the three enhancers could be responsible for the activation of the genes adjacent to PDEF (PACSIN1 and c6orf106, Figure S2A). However, neither of these neighboring genes demonstrated a correlation with ER expression in breast carcinomas (Figure S2B), and E2 stimulation did not induce their expression (Figure S2C). The absence of PDEF mRNA induction by E2 was further validated in another ER+ breast cancer cell line (T47D, Figure S2D). In addition, ER downregulation in MCF7 cells did not affect PDEF mRNA levels (Figure 3D), further confirming the absence of regulatory activity, despite direct ER recruitment at the PDEF gene locus in an E2-dependent manner.
These results suggested that a potential repressor prevents transactivation of the PDEF gene by ER. Therefore, we examined the roles of the known ER cooperating factors FOXA1 (Lupien et al., 2008) and GATA3 (Theodorou et al., 2013) as potential regulators of PDEF expression. FOXA1 downregulation in MCF7 cells led to a decrease in PDEF mRNA and protein levels, indicating a positive role of FOXA1 in the regulation of PDEF expression (Figure 3D). FOXA1 downregulation in another luminal cell line (SKBR3) also decreased PDEF mRNA levels (Figure S2E). In contrast, GATA3 downregulation in MCF7 cells triggered an increase of PDEF mRNA and protein levels (Figure 3D), demonstrating a negative role of GATA3 in the regulation of PDEF expression. Additionally, GATA3 overexpression in two luminal cell lines expressing low endogenous GATA3 levels resulted in decreased PDEF expression (Figure S2F). These regulatory effects occur through direct recruitment of FOXA1 and GATA3 at the PDEF locus in MCF7 cells, as direct ChIP-qPCR revealed FOXA1 recruitment at the PDEF promoter and enhancer 3, whereas GATA3 was recruited at the most proximal enhancer (Figure 3E). This data suggests that PDEF is a downstream target of ER, FOXA1 and GATA3. As a control, we verified that PDEF downregulation did not affect the expression of ER, FOXA1, or GATA3, indicating that there is no reciprocal regulatory loop between these genes (Figure S2G).
GATA3 Prevents ER-Mediated Induction of PDEF
As a direct PDEF repressor, GATA3 could be responsible for the absence of E2-mediated induction of PDEF mRNA. In order to test this hypothesis, we compared the effect of E2 treatment in the presence or absence of GATA3 expression (Figure 4A). As expected, PDEF mRNA levels were unchanged in MCF7 cells transfected with a non-specific siRNA (N.S.). In contrast, GATA3 knockdown enabled the induction of PDEF mRNA (Figure 4A) and protein (Figure 4B) by E2 treatment. We then examined whether modulation of GATA3 expression affected the recruitment of various transcriptional regulators to the PDEF promoter and enhancer regions using ChIP in E2-treated MCF7 cells (Figure 4C). Indeed, Pol2 displayed a higher recruitment level at the PDEF promoter in GATA3-knockdown conditions, whereas the promoter of the ER target gene MYC did not show differential Pol2 recruitment. ER recruitment to the three enhancers was also increased upon GATA3 depletion, with a more pronounced increase at enhancer 1, in contrast to the ER-recruiting enhancer located upstream of the MYC gene, which did not show differential ER recruitment. In the absence of estrogen stimulation (vehicle condition), ER recruitment at the PDEF enhancers was close to background level, and modulation of GATA3 expression did not affect ER recruitment (Figure S3). Furthermore, the transcriptional coactivator p300, known to associate with ligand-bound ER and to augment ligand-dependent activation by ER (Hanstein et al., 1996), also displayed a stronger recruitment in GATA3-knockdown conditions, specifically at enhancer 1. Consistent with the histone acetyltransferase activity of p300 (McManus and Hendzel, 2003), we found higher levels of the active histone marks acetylated-H3K18 and -H4K12 at PDEF enhancer 1. Collectively, these data demonstrate that the loss of GATA3 allows for ER-mediated PDEF induction.
Figure 4. GATA3 Prevents PDEF Induction by ER.

(A) GATA3 (upper panel) and PDEF (lower panel) mRNA levels were determined by RT-qPCR after MCF7 cells were transfected with a non-specific (N.S.) or GATA3-targeting (KD: KnockDown) siRNAs and challenged with 10nM estradiol (E2). Data represent means with SD.
(B) Western blots lysates from MCF7 cells transfected with N.S. or GATA3-targeting (KD) siRNAs, and challenged with 10nM estradiol.
(C) Direct RNA polymerase II (Pol2), ER, p300, acetylated histone H3K18 and H4K12 ChIPs followed by real-time PCR after MCF7 cells were transfected with N.S. or GATA3-targeting (KD) siRNAs, and challenged with 10nM E2. Data represent means with SD. Enh.: Enhancer.
See also Figure S3.
To evaluate the repressive effect of GATA3 on PDEF expression in other cell lines, we examined the mRNA levels of these transcription factors in a subset of ER+ breast cancer cell lines (Neve et al., 2006). Clustering analysis revealed a clear distinction between [GATA3] high [PDEF, FOXA1] low and [GATA3] low[PDEF, FOXA1] high cell lines (Figure 5A). Pairwise correlation analysis showed a statistically significant inverse correlation between PDEF and GATA3. Conversely, PDEF and FOXA1 levels were positively correlated, further confirming the positive regulation of PDEF expression by FOXA1. Validation of the negative correlation between PDEF and GATA3 expression was also performed in four ER+ breast cancer cell lines (Figure 5B).
Figure 5. PDEF and GATA3 Are Inversely Correlated in ER+ Luminal Tumor Cell Lines and their Expression Levels are of Prognostic Value for ER+ Breast Carcinoma Patient Survival.
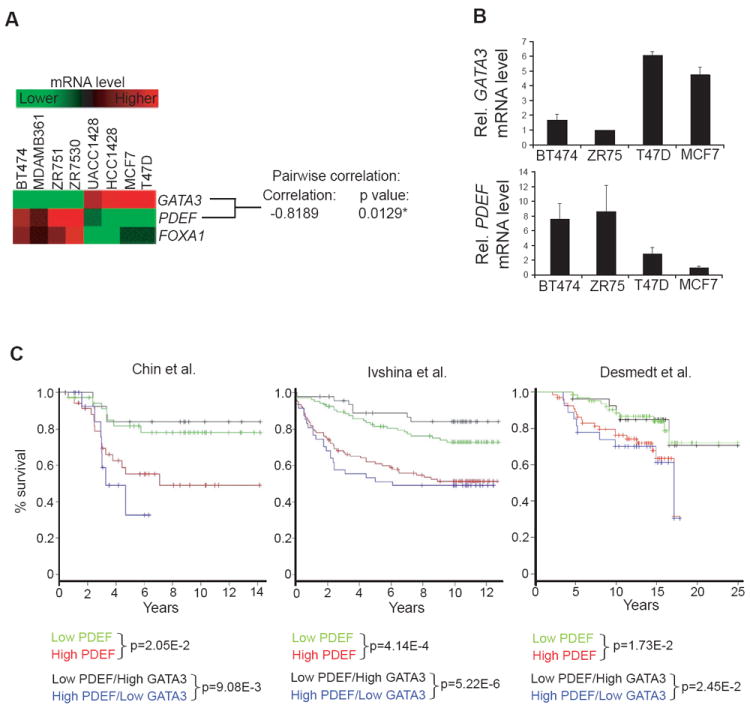
(A) Heatmap displaying GATA3, PDEF, FOXA1 mRNA levels in eight ER+ breast cancer cell lines (Neve et al., 2006) with pairwise correlation analysis (Scale: +1: perfect positive correlation, 0: no correlation, −1: perfect inverse correlation).
(B) GATA3 (upper panel) and PDEF (lower panel) mRNA levels were determined by real-time PCR in four ER+ breast cancer cell lines. Data represent means with SD.
(C) Kaplan-Meier survival analysis of ER+ breast carcinoma patients (Chin et al., 2006; Ivshina et al., 2006; Desmedt et al., 2007). Patients were stratified on the median value for each marker. The log-rank test p values are shown.
PDEF Is Required for the Growth of ER+ Breast Cancers
To investigate the role of PDEF in breast cancer progression, we first analyzed gene expression profiling and clinical outcome data from published studies for correlations between PDEF/GATA3 expression levels and overall survival (Figure 5C). Due to the strong association between PDEF and ER expression, only ER+ breast tumors were included in this analysis. Patients were divided into two equal groups, high and low, based on the median PDEF expression level. Kaplan-Meier survival analyses in three independent datasets demonstrated that high PDEF expression is associated with worse overall survival for patients with ER+ breast cancer. We found that PDEF is a significant predictor of survival when treated as a continuous variable in Cox regression models (Chin p=0.0102, Ivshina p=3.74E-3, Desmedt p=0.0476), consistent with a previous report (Sood et al., 2009). In contrast, GATA3 is not a significant predictor of survival in the ER+ breast samples in these three studies when tumors are classified based on the median GATA3 expression or when GATA3 expression is treated as a continuous variable (data not shown). Interestingly, further stratification of patient groups based on inverse GATA3/PDEF expression improves the predictive capability of PDEF (Figure 5C). The significant correlation between high PDEF expression and poor overall survival strongly supports a potential role for PDEF in ER+ breast tumorigenesis.
To assess this hypothesis, we next investigated the biologic effects of PDEF knockdown on luminal breast cancer cell growth. PDEF downregulation by transient transfection with two independent siRNAs (Figure 6A) triggered a growth defect in MCF7 cells subjected to hormone starvation prior to E2 stimulation (Figure 6B). This growth defect was rescued by the expression of a mutant PDEF protein harboring a silent mutation preventing siRNA-mediated downregulation (Figure S4A, B). Stable PDEF knockdown by transduction of MCF7 cells with lentiviral PDEF-targeting shRNAs also induced a growth defect in conditions of hormone depletion followed by E2 stimulation (Figure S4C, D).
Figure 6. PDEF Knockdown Sensitizes MCF7 Cells to Hormone-Related Stress and Decreases their Tumorigenic Properties.

(A) PDEF mRNA levels were determined by real-time PCR in MCF7 cells transfected with non-specific (N.S) or two independent PDEF-targeting (PDEF KD: KnockDown) siRNAs, and then grown for 3 days in hormone-depleted medium with 10nM E2. Data represent means with SD.
(B) Growth curves of MCF7 cells transfected with N.S. or PDEF-targeting (KD) siRNAs in hormone depleted medium with 10nM E2. Data represent means with SD.
(C) AnnexinV/Propidium Iodide cell viability measurement of MCF7 cells transfected with N.S. or PDEF-targeting (KD) siRNAs, then grown for 24h in hormone-depleted medium. Data represent means with SD.
(D) Measurement of cytotoxicity after transfection of MCF7 cells with N.S. or PDEF-targeting (KD) siRNAs, followed by treatment for 48h with increasing doses of tamoxifen (left panel) or fulvestrant (right panel). Data represent means with SD.
(E) Soft agar colony formation assay of MCF7 cells infected with N.S. or PDEF-targeting (KD) shRNAs. The average fold change +/- SEM in colony number compared to control N.S. cells across three independent experiments is shown (*p<0.02, ***p<0.0001).
(F) Measurement of MCF7 xenograft tumor weight. Mammary fat pads of NOD/SCID mice were injected with N.S. or PDEF-targeting shRNA (KD #1 and #2) MCF7 cells. Estradiol release pellets were implanted subcutaneously 2-3 days prior to surgery. Tumors were harvested and weighed after eight weeks of growth. Data represent mean +/- SEM, *p<0.04. Tumor sections were subjected to histological analysis by hematoxylin and eosin staining (H&E). Scale bars represent 50μM.
(G) Western blots of MCF7 xenograft tumor lysates. Tumors expressing either N.S. or PDEF-targeting (KD) shRNAs were analyzed.
(H) Tumor sections were subjected to TUNEL cell death staining (red). Nuclei were stained with DAPI (blue). Three different tumors were stained for each shRNA (N.S., PDEF KD#1 and #2) and 5 fields were photographed for each section. Representative images for each tumor type are shown. Scale bars represent 20μM. The ratio of TUNEL signal to the total number of nuclei is shown in the histogram. Data represent means with SD. (***p<0.001).
See also Figure S4.
Flow cytometry analysis did not reveal any obvious cell-cycle progression defect in PDEF knockdown cells subjected to hormone starvation and E2 induction. However, PDEF knockdown followed by treatment with nocodazole prevented a significant proportion of cells from entering mitotic arrest, suggesting that PDEF silencing does induce a subtle G0/G1 arrest (Figure S4E). In addition, PDEF knockdown cells subjected to hormone depletion displayed decreased viability with a statistically significant increase in apoptotic cells (Figure 6C). Based on this finding, we examined the effect of the ER antagonists tamoxifen and fulvestrant in cells expressing PDEF siRNA (Figure 6D). Increasing doses of antiestrogens resulted in more pronounced cytotoxicity in PDEF knockdown conditions. In addition, caspase 8 activity was also increased in MCF7 cells expressing PDEF-targeting shRNAs and subjected to hormone depletion or fulvestrant treatment (Figure S4F), further confirming a role for PDEF in mediating luminal tumor cell survival in response to hormone-related stress.
We also examined the effect of PDEF loss on luminal tumor cell survival in anchorage-independent conditions. Soft agar colony formation was markedly decreased in MCF7 cells expressing PDEF shRNA, suggesting that this ETS factor is essential for the transformation of luminal tumor cells (Figure 6E). Consistent with this notion, PDEF downregulation in three other luminal cancer cell lines, T47D, BT474, and SKBR3 (Figure S4G), resulted in similar decreases in cell growth (Figure S4H, I, J) and significantly impaired colony formation in soft agar assays (Figure S4K, L). As a control, we demonstrated that re-introduction of PDEF in the basal tumor cell line SUM159, which lacks endogenous PDEF expression, inhibited anchorage-independent growth and survival (Figure S4M), confirming the reported role of PDEF as a tumor suppressor in basal-like breast cancer (Feldman et al., 2003; Turner et al., 2007). To further test the role of PDEF in luminal tumor formation, non-specific control or PDEF knockdown MCF7 cells were injected in the inguinal mammary fat pads of NOD-SCID mice that had previously been implanted with an estrogen pellet (Figure 6F). In line with the observed in vitro growth defect, PDEF downregulation reduced tumor growth, with a 40% decrease in final tumor weight compared to tumors formed by control MCF7 cells. Interestingly, histological sections of PDEF knockdown tumors displayed a fragmented appearance and decreased cellularity, in contrast to the suppressive role of PDEF in basal SUM159 cells, as expression of PDEF in these cells diminished tumor formation in vivo (Figure S4N). Western-blot analysis of lysates from PDEF knockdown tumors revealed increased detection of cleaved caspase 8, whereas the proliferation marker PCNA was not differentially expressed (Figure 6G), indicating that the reduced tumor size of PDEF knockdown xenograft tumors is predominantly due to increased apoptosis rather than a proliferation defect. TUNEL cell death detection in tumor sections also clearly showed increased cell death in PDEF knockdown tumors (Figure 6H). Collectively, these data support a critical pro-survival role of PDEF in ER+ breast cancer cells. Conversely, we confirmed a tumor-suppressive function for GATA3 (Asselin-Labat et al., 2007; Kouros-Mehr et al., 2008), as GATA3 silencing promoted soft agar colony formation in MCF7 cells (Figure S4O, P).
PDEF Is Involved In Endocrine Resistance
In order to better understand the mechanisms underlying acquired endocrine resistance, in vitro models of hormone-independent growth were previously developed through long-term culture of MCF7 cells in media devoid of any estrogens or in the presence of tamoxifen (Ariazi et al., 2011). We hypothesized that PDEF might play a functional role in this hormone-refractory phenotype based on our finding that PDEF downregulation sensitized MCF7 cells to hormone depletion and antiestrogens. To evaluate this hypothesis, we analyzed two long-term estrogen-deprived clones (MCF7 2A and 5C) (Ariazi et al., 2011) and tamoxifen-resistant cells (TAM-R) isolated from parental MCF7 cells. PDEF mRNA levels were higher in estrogen-deprived 2A and 5C cells relative to the parental controls (WS8), whereas the levels of GATA3 mRNA were lower (Figure 7A). The inverse correlation between PDEF and GATA3 was confirmed in this model at the protein level (Figure 7B). Similarly, TAM-R cells also displayed higher PDEF levels, concomitant with undetectable levels of GATA3 mRNA and protein (Figure 7A, B). To determine whether the higher PDEF expression observed in these was functionally relevant, we assessed the survival of MCF7 5C cells after PDEF downregulation. PDEF knockdown induced increased cell death and a reduction in soft agar colony formation, suggesting that hormone-refractory cells are partially dependent on PDEF for survival (Figure 7C). In addition, PDEF downregulation in MCF7 TAM-R cells triggered a dramatic decrease in soft agar colony formation (Figure 7D). Interestingly, tamoxifen significantly increased colony numbers of TAM-R cells transduced with a non-specific shRNA (compare white bars), indicating that tamoxifen functions in TAM-R cells as an agonist to promote anchorage-independent cell growth. In fact, PDEF silencing resulted in a greater fold-reduction in colony formation in the presence of tamoxifen compared to the vehicle condition. These results support the conclusion that PDEF plays an important role in endocrine resistance.
Figure 7. PDEF Expression Is Increased in Long Term Estrogen-Deprived Cells and Tamoxifen-Resistant (TAM-R) Cells Derived from MCF7 Cells.

(A, B) PDEF and GATA3 mRNA and protein levels were determined by real-time PCR (A) or western blot (B) in parental MCF7 cells (WS8), clones 2A and 5C (upper panels), and tamoxifen-resistant (TAM-R) cells (lower panels). mRNA levels are presented as means with SD and normalized to the housekeeping gene GAPDH.
(C) Left panel: PDEF mRNA levels were determined in MCF7 5C cells by real-time PCR after transfection of non-specific (N.S.) or PDEF-targeting (PDEF KD: KnockDown) siRNAs. Middle panel: Measurement of MCF7 5C cell mortality (**p<0.005, data represent mean+/-SD). Right Panel: Soft agar colony formation assay of MCF7 5C cells infected with non-specific (N.S) or PDEF-targeting (KD) shRNAs. Data represent the average fold change +/- SEM in colony number compared to control N.S. cells, *p<0.02.
(D) Left panel: PDEF mRNA levels were determined in MCF7 TAM-R cells by real-time PCR seven days after transduction of N.S. or PDEF-targeting (KD) shRNAs in the presence of 10-7M tamoxifen or vehicle (EtOH). Right panel: Soft agar colony formation assay of MCF7 TAM-R cells infected with N.S. control shRNA or PDEF-targeting shRNA (KD) in the presence of 10-7M tamoxifen or vehicle (EtOH) (***p<0.001, *p<0.05). Data represent means +/- SD.
PDEF Gene Expression Signature Reflects a Pro-Survival Role and Identifies Cell Death Receptor FAS as an Important Target
Microarray gene expression analysis was performed in MCF7 cells transduced with a non-specific or PDEF-targeting shRNAs after subjection to hormone depletion for 48 hours. Analyses of differentially expressed genes combined with gene ontology revealed a downregulation of cell cycle related-genes and an upregulation of apoptosis-related genes in PDEF knockdown cells (Figure 8A). A complete list of PDEF-regulated genes from this microarray analysis is shown in Table S2. These target genes constitute potential effectors of the pro-survival role of PDEF.
Figure 8. PDEF Promotes a Pro-Survival Gene Expression Program in Hormone-Depleted Conditions and Represses Pro-Apoptotic Death Domain FAS Receptor Expression.

(A) Heatmap of a selection of differentially expressed genes generated from microarray analysis of MCF7 cells infected with non-specific (N.S.) or PDEF-targeting (PDEF KD: KnockDown) shRNAs, then subjected to hormone depletion for 48h. These expression changes were statistically significant.
(B) Kaplan-Meier survival analysis of the relationship between survival time and the PDEF signature. The PDEF signature was trained and tested on the Ivshina data set (Ivshina et al., 2006). The log-rank p-value is an indicator of significant differences in patient outcome when patients are dichotomized at the median of the predictor. The Cox p value treats the predictor as a continuous variable.
(C, D) PDEF and FAS mRNA and protein levels were determined by real-time PCR (C) or western blot (D) in MCF7 cells infected with N.S. or PDEF-targeting (KD) shRNAs, and grown for 48h (C) or 72h (D) in hormone-depleted medium. mRNA levels are presented as means with SD and normalized to the housekeeping gene GAPDH.
(E) Upper panel: Schematic diagram of the PDEF binding region (indicated by arrow) upstream of the FAS gene locus as defined by PDEF ChIP sequencing in VCaP cells (Wei et al., 2010). Lower panel: Direct PDEF ChIP followed by qPCR after culture of MCF7 cells in hormone-depleted medium for 48 hours. Data represent means with SD.
(F) Measurement of caspase 8 activity in MCF7 cells transfected with N.S. or PDEF-targeting (KD) siRNAs, then subjected to hormone depletion (48h) in the presence of a negative control antibody or anti-Fas Ligand antibody (FasL, 5ng/mL). Data represent means with SD.
(G, H) PDEF and FAS mRNA and protein levels were determined by real-time PCR (G) or western blot (H) in MCF7 2A and 5C clones infected with N.S. or PDEF-targeting (KD) shRNAs. mRNA levels are presented as means with SD and normalized to the housekeeping gene GAPDH.
(I) PDEF belongs to a network of ER-associated factors, and is positively regulated by ER and FOXA1, whereas GATA3 acts as a repressor of PDEF expression.
(J) Mechanism of GATA3-mediated repression of PDEF.
(K) Physiological and pathological functions of PDEF.
See also Figure S5 and Tables S2, S3.
We next examined whether PDEF-regulated genes have prognostic value for ER+ breast carcinoma patient survival (Figure 8B). A semi-supervised principal component method was implemented using the PDEF-regulated genes in the MCF7 cells; we did not include the PDEF probe because it is prognostic as a single predictor. Using this approach, a 130-probe PDEF signature that is able to predict patient outcome in the Ivshina data set was identified (Figure 8B, and Table S3). Importantly, this signature is also significant when applied to independent cohorts of ER+ tumors (Figure S5A). Since increased expression of cell-cycle genes is a hallmark of cancer, it was necessary to define whether cell-cycle genes solely contribute to the prognostic value of the PDEF signature. Survival analysis using a PDEF signature where cell cycle-associated genes were eliminated revealed that non-cell cycle PDEF-regulated genes are prognostic (Figure S5B, left panel). A PDEF signature restricted to genes implicated in response to stress and apoptosis is also prognostic (Figure S5B, right panel).
In order to further define the clinical relevance of PDEF target genes, we analyzed the overlap between the PDEF signature and existing breast carcinoma gene expression datasets. A large proportion of genes upregulated in PDEF knockdown MCF7 cells were significantly downregulated in tumors versus normal samples, whereas the genes downregulated in PDEF knockdown MCF7 cells were overexpressed in tumors compared to normal samples (Figure S5C). These findings demonstrate that PDEF knockdown triggers a gene expression program that switches cells toward a less tumorigenic phenotype.
In addition, we further analyzed these microarray results to identify potential mediators of the pro-apoptotic phenotype induced by PDEF loss. The cell death receptor FAS was selected as a candidate effector, as FAS mRNA was overexpressed in MCF7 cells with PDEF knockdown under hormone-depleted conditions (Figure 8C, D), suggesting that PDEF acts as a repressor of FAS expression. Furthermore, analysis of a previously published PDEF cistrome established in VCaP prostate cancer cells (Wei et al., 2010) revealed the presence of a PDEF binding region located upstream of the FAS gene locus. Direct PDEF ChIP in MCF7 cells confirmed PDEF recruitment to this binding region (Figure 8E). This result indicates that PDEF directly represses FAS expression, and that this inhibition may promote the survival of MCF7 cells in hormone-depleted media. Interestingly, an inverse correlation between FAS and PDEF mRNA levels was observed in multiple ER+ breast carcinoma datasets (Figure S5D), thus confirming that PDEF-mediated repression of FAS expression is also relevant clinically.
In order to determine if FAS plays a functional role in the pro-apoptotic phenotype, we treated PDEF knockdown MCF7 cells with an anti-FAS Ligand (FasL) neutralizing antibody under hormone-depleted conditions (Figure 8F). FasL neutralizing antibody was sufficient to partially rescue the apoptotic phenotype in PDEF knockdown cells as compared to a negative control non-specific antibody. Moreover, FAS mRNA and protein expression was enhanced in both MCF7 2A and 5C clones upon PDEF downregulation (Figure 8G, H). Based on these findings, we hypothesize that increased PDEF levels promote the acquired endocrine resistance of estrogen-deprived cells by inhibiting the expression of pro-apoptotic genes including FAS.
DISCUSSION
In the present study, we demonstrated that PDEF is a downstream target of the ER/FOXA1/GATA3 network. In addition to its critical function as a lineage-specific regulator of ER+ breast cancer cell survival, PDEF also induces luminal differentiation of non-transformed basal epithelial cells (summarized in Figure 8I, J, K).
Gene expression analyses revealed distinct PDEF signatures in two different contexts. PDEF overexpression in non-transformed MCF-10A mammary basal epithelial cells induced a striking luminal differentiation program, whereas PDEF knockdown in transformed luminal MCF7 cells subjected to hormone depletion induced a growth arrest and cell death program. The lack of significant overlap in these signatures suggests distinct roles for PDEF in the context of normal morphogenesis and tumorigenesis. Defining PDEF binding sites in the genome in these two contexts may reveal differential sets of direct target genes and cooperating factors. However, the role of PDEF in promoting survival is likely more important than its role in regulating differentiation in transformed cells, as preliminary data suggests that PDEF knockdown induces changes in a subset of differentiation markers in luminal breast cancer cells, but does not appear to result in the generation of bipotent cells as observed in non-transformed COMMA-1D cells.
The dichotomous functions of PDEF in the context of normal and tumor cells distinguish it from other prodifferentiation factors that function as tumor suppressors. For example, GATA3 is required for luminal cell differentiation (Asselin-Labat et al., 2007); however, GATA3 downregulation enhances invasive activity and tumor cell dissemination to the lung, whereas GATA3 overexpression suppresses metastasis (Kouros-Mehr et al., 2008). In addition, GATA3 is mutated in 17.7% of ER+ breast carcinoma samples (Stephens et al., 2012). Interestingly, GATA3 silencing increased ER binding intensity in a high proportion of recruiting regions (Theodorou et al., 2013). We hypothesize that PDEF could be an important target of the tumor-suppressive action of GATA3. The analysis of estrogen-deprived or tamoxifen-resistant cells provides supportive evidence for an inverse correlation between PDEF and GATA3, which may represent a marker of hormone-refractory breast cancers.
Studies of PDEF function in different cancers, including prostate and ovarian tumors, suggests a context-dependent role in tumorigenesis (Johnson et al., 2010; Sood et al., 2007; Ghadersohi et al., 2008; Rodabaugh et al., 2007). In breast cancer, PDEF cooperates with the oncogenes ERBB2 and CSF1R to promote cell motility, invasion, and anchorage-independent growth of mammary epithelial cells (Gunawardane et al., 2005). In contrast, other studies showed that ectopic expression of PDEF in highly malignant, ER-, basal-like breast tumor cell lines (Feldman et al., 2003; Turner et al., 2007) resulted in reduced proliferation, motility, and invasiveness, suggestive of a tumor-suppressor role. However, the relevance of ectopic expression in tumor cell lineages in which PDEF is not normally expressed is difficult to interpret. Exogenous expression of ER in ER- cells led to similar paradoxical results, in which ER appeared to function as a tumor suppressor (Levenson and Jordan, 1994). Luminal epithelial-specific transcription factors, such as ER and PDEF, may reduce the mesenchymal properties of these cell lines, rendering them less invasive and migratory. Thus, loss of expression studies in ER+ cells represent a more appropriate context to examine the role of PDEF in tumorigenesis. Our data support a role for PDEF in breast cancer progression, at least in part by maintaining a proliferative state and enabling a prosurvival gene expression program.
Our results identify the FAS receptor, a member of the tumor necrosis family involved in the extrinsic apoptosis pathway (Peter and Krammer, 2003), as a direct PDEF transcriptional target. Non-transformed mammary epithelial cell lines express high levels of FAS, and its expression is decreased in several breast cancer cell lines (Keane et al., 1996). In addition, disease-free survival was significantly longer in patients with FAS-positive breast tumors compared to FAS-negative tumors (Mottolese et al., 2000). PDEF represses FAS gene expression, specifically under stress conditions such as hormone depletion. Several other ETS factors also display transcriptional-repressive activities, including Net, Yan, ERF, and Tel (Mavrothalassitis and Ghysdael, 2000). The mechanism of PDEF-mediated repression is not yet elucidated and the identification of potential coregulators will provide new insights into its transcriptional activity.
Taken together, this study identifies PDEF not only as an essential factor within the ER-associated transcriptional network, but also as a potential therapeutic target for patients with ER+ breast carcinoma.
EXPERIMENTAL PROCEDURES
Reagents, Cells and Tissue Culture Conditions
The antibodies, siRNAs, primers, and cells and tissue culture conditions are listed in Supplemental Experimental Procedures. Reduction mastectomy tissues were collected from patients who have provided informed consent under the DFCI IRB approved protocol 93-085. See Supplemental Experimental Procedures for more details.
Gene Expression Microarray Analysis
Total RNA was isolated either from MCF-10A cells expressing pBabe / pBabe-PDEF or from MCF7 expressing non-specific/PDEF-targeting shRNA and subjected to reverse transcription, labeling, and hybridization to hgu133plus2 gene chip arrays (Affymetrix). See Supplemental Experimental Procedures for more details.
Lentiviral Infection and siRNA Transfection
Lentivirus was produced in 293T cells and retrovirus in 293GPG cells. For luminal progenitor cells, PDEF-targeting lentiviral particles were obtained from Santa Cruz Biotechnology (sc-45845-V). For PDEF overexpression, either the retroviral pBabe or lentiviral pBob vectors containing human or murine PDEF cDNA were used. See Supplemental Experimental Procedures for more details.
Chromatin Immunoprecipitation
ChIP was performed as previously described (Carroll et al., 2005). See Supplemental Experimental Procedures for more details.
Growth Curves and Cytotoxicity Assay
Growth of MCF7 cells and cytotoxicity of tamoxifen and fulvestrant were measured using the cell proliferation WST-1 assay (Roche). See Supplemental Experimental Procedures for more details.
Annexin V Analysis of Apoptosis and Caspase 8 Activity Assay
The Vybrant annexin V Kit #3 and the ApoTarget Caspase 8 colorimetric assay (Invitrogen) were used. See Supplemental Experimental Procedures for more details.
Immunofluorescence
MCF-10A cells were stained with antibodies against cytokeratin-8 (Covance HK-8) and keratin-14 (Covance AF64). COMMA-1D colony assays were stained with antibodies against murine cytokeratin-8 (DSHB, University of Iowa; TROMA-I) and keratin-14 (Covance AF64 1). See Supplemental Experimental Procedures for more details.
Flow Cytometry Analyses
MCF-10A and HMEC cells were trypsinized and resuspended in flow buffer (PBS containing 1% BSA, 2mM EDTA, and 5% FBS) for 10min. Cells were stained for 30min with antibodies for PE-conjugated EpCAM and APC-conjugated CD10 (both eBioscience). Analysis was performed on a FACS Calibur machine (BD).
Soft Agar Assays
Six-well plates were coated with an underlay of 0.5% agarose (Sigma, Type VII low melting). Cells were then plated in 0.35% agarose. Colonies were allowed to form for approximately two weeks. See Supplemental Experimental Procedures for more details.
Fat pad tumor assays
All animal studies were performed with the approval of the IACUC of Harvard Medical School. Eight-week-old female NOD/SCID mice were implanted with estrogen pellets (Innovative Research of America; 0.72 mg, 60 day release) prior to injection to support tumor growth. 2×10⁶ MCF7 cells (expressing control or PDEF-targeting shRNAs, resuspended in Matrigel) were injected into the #4 fat pad. Tumors were harvested after 8 weeks of growth. See Supplemental Experimental Procedures for more details.
Survival Analysis
Breast tumor datasets were downloaded from www.ncbi.nlm.nih.gov/geo (Ivhsina; GSE4922), (Desmedt; GSE7390) and www.ebi.ac.uk/arrayexpress (Chin; E-TABM-158). See Supplemental Experimental Procedures for more details.
Supplementary Material
Highlights.
PDEF induces a luminal expression profile in non-transformed mammary epithelialcells
PDEF contributes to the molecular differences between luminal and basal breast cancer
PDEF and GATA3 are anti-correlated and strongly predict clinical outcome
PDEF promotes luminal breast cancer survival and hormone-independent tumor growth
Acknowledgments
We are grateful to Hansen He for his help with gene expression analysis, the Nikon Imaging Center at Harvard Medical School, the DF/HCC Rodent Histopathology Core, Developmental Studies Hybridoma Bank at the University of Iowa, members of the Brugge and Brown laboratories for technical assistance and helpful discussions. This work was supported by a DOD Breast Cancer Research Program Postdoctoral Fellowship (W81XWH-10-1-0029 to MMH), fellowships from the Association pour la Recherche contre le Cancer (GB) and Susan G. Komen for the Cure (KG080737 to GB) and grants from the Breast Cancer Research Foundation (JSB), the NCI (P01 CA080111 to MB) and NIDDK (R01 DK074967 to MB).
Footnotes
Supplemental Information
Supplemental information includes five figures, three tables and Supplemental Experimental Procedures.
Accession Numbers
Raw and processed microarray data can be accessed at the GEO with the accession number GSE40987.
Publisher's Disclaimer: This is a PDF file of an unedited manuscript that has been accepted for publication. As a service to our customers we are providing this early version of the manuscript. The manuscript will undergo copyediting, typesetting, and review of the resulting proof before it is published in its final citable form. Please note that during the production process errors may be discovered which could affect the content, and all legal disclaimers that apply to the journal pertain.
References
- Allinen M, Beroukhim R, Cai L, Brennan C, Lahti-Domenici J, Huang H, Porter D, Hu M, Chin L, Richardson A, et al. Molecular characterization of the tumor microenvironment in breast cancer. Cancer cell. 2004;6:17–32. doi: 10.1016/j.ccr.2004.06.010. [DOI] [PubMed] [Google Scholar]
- Ariazi EA, Cunliffe HE, Lewis-Wambi JS, Slifker MJ, Willis AL, Ramos P, Tapia C, Kim HR, Yerrum S, Sharma CG, et al. Estrogen induces apoptosis in estrogen deprivation-resistant breast cancer through stress responses as identified by global gene expression across time. Proceedings of the National Academy of Sciences of the United States of America. 2011;108:18879–18886. doi: 10.1073/pnas.1115188108. [DOI] [PMC free article] [PubMed] [Google Scholar]
- Asselin-Labat ML, Sutherland KD, Barker H, Thomas R, Shackleton M, Forrest NC, Hartley L, Robb L, Grosveld FG, van der Wees J, et al. Gata-3 is an essential regulator of mammary-gland morphogenesis and luminal-cell differentiation. Nature cell biology. 2007;9:201–209. doi: 10.1038/ncb1530. [DOI] [PubMed] [Google Scholar]
- Carroll JS, Meyer CA, Song J, Li W, Geistlinger TR, Eeckhoute J, Brodsky AS, Keeton EK, Fertuck KC, Hall GF, et al. Genome-wide analysis of estrogen receptor binding sites. Nature genetics. 2006;38:1289–1297. doi: 10.1038/ng1901. [DOI] [PubMed] [Google Scholar]
- Chin K, DeVries S, Fridlyand J, Spellman PT, Roydasgupta R, Kuo WL, Lapuk A, Neve RM, Qian Z, Ryder T, et al. Genomic and transcriptional aberrations linked to breast cancer pathophysiologies. Cancer cell. 2006;10:529–541. doi: 10.1016/j.ccr.2006.10.009. [DOI] [PubMed] [Google Scholar]
- Danielson KG, Oborn CJ, Durban EM, Butel JS, Medina D. Epithelial mouse mammary cell line exhibiting normal morphogenesis in vivo and functional differentiation in vitro. Proceedings of the National Academy of Sciences of the United States of America. 1984;81:3756–3760. doi: 10.1073/pnas.81.12.3756. [DOI] [PMC free article] [PubMed] [Google Scholar]
- Desmedt C, Piette F, Loi S, Wang Y, Lallemand F, Haibe-Kains B, Viale G, Delorenzi M, Zhang Y, d’Assignies MS, et al. Strong time dependence of the 76-gene prognostic signature for node-negative breast cancer patients in the TRANSBIG multicenter independent validation series. Clin Cancer Res. 2007;13:3207–3214. doi: 10.1158/1078-0432.CCR-06-2765. [DOI] [PubMed] [Google Scholar]
- Dontu G, Al-Hajj M, Abdallah WM, Clarke MF, Wicha MS. Stem cells in normal breast development and breast cancer. Cell proliferation. 2003;36(Suppl 1):59–72. doi: 10.1046/j.1365-2184.36.s.1.6.x. [DOI] [PMC free article] [PubMed] [Google Scholar]
- Feldman RJ, Sementchenko VI, Gayed M, Fraig MM, Watson DK. Pdef expression in human breast cancer is correlated with invasive potential and altered gene expression. Cancer research. 2003;63:4626–4631. [PubMed] [Google Scholar]
- Findlay VJ, Turner DP, Moussa O, Watson DK. MicroRNA-mediated inhibition of prostate-derived Ets factor messenger RNA translation affects prostate-derived Ets factor regulatory networks in human breast cancer. Cancer research. 2008;68:8499–8506. doi: 10.1158/0008-5472.CAN-08-0907. [DOI] [PMC free article] [PubMed] [Google Scholar]
- Galang CK, Muller WJ, Foos G, Oshima RG, Hauser CA. Changes in the expression of many Ets family transcription factors and of potential target genes in normal mammary tissue and tumors. The Journal of biological chemistry. 2004;279:11281–11292. doi: 10.1074/jbc.M311887200. [DOI] [PubMed] [Google Scholar]
- Ghadersohi A, Odunsi K, Zhang S, Azrak RG, Bundy BN, Manjili MH, Li F. Prostate-derived Ets transcription factor as a favorable prognostic marker in ovarian cancer patients. International journal of cancer. 2008;123:1376–1384. doi: 10.1002/ijc.23667. [DOI] [PMC free article] [PubMed] [Google Scholar]
- Ghadersohi A, Sood AK. Prostate epithelium-derived Ets transcription factor mRNA is overexpressed in human breast tumors and is a candidate breast tumor marker and a breast tumor antigen. Clin Cancer Res. 2001;7:2731–2738. [PubMed] [Google Scholar]
- Gregorieff A, Stange DE, Kujala P, Begthel H, van den Born M, Korving J, Peters PJ, Clevers H. The ets-domain transcription factor Spdef promotes maturation of goblet and paneth cells in the intestinal epithelium. Gastroenterology. 2009;137:1333–1345 e1331-1333. doi: 10.1053/j.gastro.2009.06.044. [DOI] [PubMed] [Google Scholar]
- Gu X, Zerbini LF, Otu HH, Bhasin M, Yang Q, Joseph MG, Grall F, Onatunde T, Correa RG, Libermann TA. Reduced PDEF expression increases invasion and expression of mesenchymal genes in prostate cancer cells. Cancer research. 2007;67:4219–4226. doi: 10.1158/0008-5472.CAN-06-3689. [DOI] [PubMed] [Google Scholar]
- Gunawardane RN, Sgroi DC, Wrobel CN, Koh E, Daley GQ, Brugge JS. Novel role for PDEF in epithelial cell migration and invasion. Cancer research. 2005;65:11572–11580. doi: 10.1158/0008-5472.CAN-05-1196. [DOI] [PMC free article] [PubMed] [Google Scholar]
- Hanstein B, Eckner R, DiRenzo J, Halachmi S, Liu H, Searcy B, Kurokawa R, Brown M. p300 is a component of an estrogen receptor coactivator complex. Proceedings of the National Academy of Sciences of the United States of America. 1996;93:11540–11545. doi: 10.1073/pnas.93.21.11540. [DOI] [PMC free article] [PubMed] [Google Scholar]
- Ivshina AV, George J, Senko O, Mow B, Putti TC, Smeds J, Lindahl T, Pawitan Y, Hall P, Nordgren H, et al. Genetic reclassification of histologic grade delineates new clinical subtypes of breast cancer. Cancer research. 2006;66:10292–10301. doi: 10.1158/0008-5472.CAN-05-4414. [DOI] [PubMed] [Google Scholar]
- Johnson TR, Koul S, Kumar B, Khandrika L, Venezia S, Maroni PD, Meacham RB, Koul HK. Loss of PDEF, a prostate-derived Ets factor is associated with aggressive phenotype of prostate cancer: regulation of MMP 9 by PDEF. Molecular cancer. 2010;9:148. doi: 10.1186/1476-4598-9-148. [DOI] [PMC free article] [PubMed] [Google Scholar] [Retracted]
- Jones C, Mackay A, Grigoriadis A, Cossu A, Reis-Filho JS, Fulford L, Dexter T, Davies S, Bulmer K, Ford E, et al. Expression profiling of purified normal human luminal and myoepithelial breast cells: identification of novel prognostic markers for breast cancer. Cancer research. 2004;64:3037–3045. doi: 10.1158/0008-5472.can-03-2028. [DOI] [PubMed] [Google Scholar]
- Kalyuga M, Gallego-Ortega D, Lee HJ, Roden DL, Cowley MJ, Caldon CE, Stone A, Allerdice SL, Valdes-Mora F, Launchbury R, et al. ELF5 Suppresses Estrogen Sensitivity and Underpins the Acquisition of Antiestrogen Resistance in Luminal Breast Cancer. PLoS biology. 2012;10:e1001461. doi: 10.1371/journal.pbio.1001461. [DOI] [PMC free article] [PubMed] [Google Scholar]
- Keane MM, Ettenberg SA, Lowrey GA, Russell EK, Lipkowitz S. Fas expression and function in normal and malignant breast cell lines. Cancer research. 1996;56:4791–4798. [PubMed] [Google Scholar]
- Kouros-Mehr H, Bechis SK, Slorach EM, Littlepage LE, Egeblad M, Ewald AJ, Pai SY, Ho IC, Werb Z. GATA-3 links tumor differentiation and dissemination in a luminal breast cancer model. Cancer cell. 2008;13:141–152. doi: 10.1016/j.ccr.2008.01.011. [DOI] [PMC free article] [PubMed] [Google Scholar]
- Levenson AS, Jordan VC. Transfection of human estrogen receptor (ER) cDNA into ER-negative mammalian cell lines. The Journal of steroid biochemistry and molecular biology. 1994;51:229–239. doi: 10.1016/0960-0760(94)90035-3. [DOI] [PubMed] [Google Scholar]
- Lim E, Vaillant F, Wu D, Forrest NC, Pal B, Hart AH, Asselin-Labat ML, Gyorki DE, Ward T, Partanen A, et al. Aberrant luminal progenitors as the candidate target population for basal tumor development in BRCA1 mutation carriers. Nature medicine. 2009;15:907–913. doi: 10.1038/nm.2000. [DOI] [PubMed] [Google Scholar]
- Lu X, Lu X, Wang ZC, Iglehart JD, Zhang X, Richardson AL. Predicting features of breast cancer with gene expression patterns. Breast Cancer Res Treat. 2008;108:191–201. doi: 10.1007/s10549-007-9596-6. [DOI] [PubMed] [Google Scholar]
- Lupien M, Eeckhoute J, Meyer CA, Wang Q, Zhang Y, Li W, Carroll JS, Liu XS, Brown M. FoxA1 translates epigenetic signatures into enhancer-driven lineage-specific transcription. Cell. 2008;132:958–970. doi: 10.1016/j.cell.2008.01.018. [DOI] [PMC free article] [PubMed] [Google Scholar]
- Mavrothalassitis G, Ghysdael J. Proteins of the ETS family with transcriptional repressor activity. Oncogene. 2000;19:6524–6532. doi: 10.1038/sj.onc.1204045. [DOI] [PubMed] [Google Scholar]
- McManus KJ, Hendzel MJ. Quantitative analysis of CBP- and P300-induced histone acetylations in vivo using native chromatin. Molecular and cellular biology. 2003;23:7611–7627. doi: 10.1128/MCB.23.21.7611-7627.2003. [DOI] [PMC free article] [PubMed] [Google Scholar]
- Mottolese M, Buglioni S, Bracalenti C, Cardarelli MA, Ciabocco L, Giannarelli D, Botti C, Natali PG, Concetti A, Venanzi FM. Prognostic relevance of altered Fas (CD95)-system in human breast cancer. International journal of cancer. 2000;89:127–132. doi: 10.1002/(sici)1097-0215(20000320)89:2<127::aid-ijc5>3.0.co;2-4. [DOI] [PubMed] [Google Scholar]
- Moussa O, Turner DP, Feldman RJ, Sementchenko VI, McCarragher BD, Desouki MM, Fraig M, Watson DK. PDEF is a negative regulator of colon cancer cell growth and migration. Journal of cellular biochemistry. 2009;108:1389–1398. doi: 10.1002/jcb.22371. [DOI] [PMC free article] [PubMed] [Google Scholar]
- Neve RM, Chin K, Fridlyand J, Yeh J, Baehner FL, Fevr T, Clark L, Bayani N, Coppe JP, Tong F, et al. A collection of breast cancer cell lines for the study of functionally distinct cancer subtypes. Cancer cell. 2006;10:515–527. doi: 10.1016/j.ccr.2006.10.008. [DOI] [PMC free article] [PubMed] [Google Scholar]
- Oettgen P, Finger E, Sun Z, Akbarali Y, Thamrongsak U, Boltax J, Grall F, Dube A, Weiss A, Brown L, et al. PDEF, a novel prostate epithelium-specific ets transcription factor, interacts with the androgen receptor and activates prostate-specific antigen gene expression. The Journal of biological chemistry. 2000;275:1216–1225. doi: 10.1074/jbc.275.2.1216. [DOI] [PubMed] [Google Scholar]
- Osborne CK, Schiff R. Mechanisms of endocrine resistance in breast cancer. Annu Rev Med. 2011;62:233–247. doi: 10.1146/annurev-med-070909-182917. [DOI] [PMC free article] [PubMed] [Google Scholar]
- Park KS, Korfhagen TR, Bruno MD, Kitzmiller JA, Wan H, Wert SE, Khurana Hershey GK, Chen G, Whitsett JA. SPDEF regulates goblet cell hyperplasia in the airway epithelium. The Journal of clinical investigation. 2007;117:978–988. doi: 10.1172/JCI29176. [DOI] [PMC free article] [PubMed] [Google Scholar]
- Perou CM, Sorlie T, Eisen MB, van de Rijn M, Jeffrey SS, Rees CA, Pollack JR, Ross DT, Johnsen H, Akslen LA, et al. Molecular portraits of human breast tumours. Nature. 2000;406:747–752. doi: 10.1038/35021093. [DOI] [PubMed] [Google Scholar]
- Peter ME, Krammer PH. The CD95(APO-1/Fas) DISC and beyond. Cell death and differentiation. 2003;10:26–35. doi: 10.1038/sj.cdd.4401186. [DOI] [PubMed] [Google Scholar]
- Richardson AL, Wang ZC, De Nicolo A, Lu X, Brown M, Miron A, Liao X, Iglehart JD, Livingston DM, Ganesan S. X chromosomal abnormalities in basal-like human breast cancer. Cancer cell. 2006;9:121–132. doi: 10.1016/j.ccr.2006.01.013. [DOI] [PubMed] [Google Scholar]
- Rodabaugh KJ, Mhawech-Fauceglia P, Groth J, Lele S, Sood AK. Prostate-derived Ets factor is overexpressed in serous epithelial ovarian tumors. International journal of gynecological pathology : official journal of the International Society of Gynecological Pathologists. 2007;26:10–15. doi: 10.1097/01.pgp.0000225386.41244.bd. [DOI] [PubMed] [Google Scholar]
- Shepherd T, Hassell JA. Role of Ets transcription factors in mammary gland development and oncogenesis. Journal of mammary gland biology and neoplasia. 2001;6:129–140. doi: 10.1023/a:1009576801226. [DOI] [PubMed] [Google Scholar]
- Sood AK, Saxena R, Groth J, Desouki MM, Cheewakriangkrai C, Rodabaugh KJ, Kasyapa CS, Geradts J. Expression characteristics of prostate-derived Ets factor support a role in breast and prostate cancer progression. Human pathology. 2007;38:1628–1638. doi: 10.1016/j.humpath.2007.03.010. [DOI] [PMC free article] [PubMed] [Google Scholar]
- Sood AK, Wang J, Mhawech-Fauceglia P, Jana B, Liang P, Geradts J. Sam-pointed domain containing Ets transcription factor in luminal breast cancer pathogenesis. Cancer Epidemiol Biomarkers Prev. 2009;18:1899–1903. doi: 10.1158/1055-9965.EPI-09-0055. [DOI] [PubMed] [Google Scholar]
- Sorlie T, Perou CM, Tibshirani R, Aas T, Geisler S, Johnsen H, Hastie T, Eisen MB, van de Rijn M, Jeffrey SS, et al. Gene expression patterns of breast carcinomas distinguish tumor subclasses with clinical implications. Proceedings of the National Academy of Sciences of the United States of America. 2001;98:10869–10874. doi: 10.1073/pnas.191367098. [DOI] [PMC free article] [PubMed] [Google Scholar]
- Stephens PJ, Tarpey PS, Davies H, Van Loo P, Greenman C, Wedge DC, Nik Zainal S, Martin S, Varela I, Bignell GR, et al. The landscape of cancer genes and mutational processes in breast cancer. Nature. 2012;486:400–404. doi: 10.1038/nature11017. [DOI] [PMC free article] [PubMed] [Google Scholar]
- Stingl J, Raouf A, Emerman JT, Eaves CJ. Epithelial progenitors in the normal human mammary gland. Journal of mammary gland biology and neoplasia. 2005;10:49–59. doi: 10.1007/s10911-005-2540-7. [DOI] [PubMed] [Google Scholar]
- Theodorou V, Stark R, Menon S, Carroll JS. GATA3 acts upstream of FOXA1 in mediating ESR1 binding by shaping enhancer accessibility. Genome research. 2013;23:12–22. doi: 10.1101/gr.139469.112. [DOI] [PMC free article] [PubMed] [Google Scholar]
- Turner DP, Moussa O, Sauane M, Fisher PB, Watson DK. Prostate-derived ETS factor is a mediator of metastatic potential through the inhibition of migration and invasion in breast cancer. Cancer research. 2007;67:1618–1625. doi: 10.1158/0008-5472.CAN-06-2913. [DOI] [PubMed] [Google Scholar]
- Wang Y, Klijn JG, Zhang Y, Sieuwerts AM, Look MP, Yang F, Talantov D, Timmermans M, Meijer-van Gelder ME, Yu J, et al. Gene-expression profiles to predict distant metastasis of lymph-node-negative primary breast cancer. Lancet. 2005;365:671–679. doi: 10.1016/S0140-6736(05)17947-1. [DOI] [PubMed] [Google Scholar]
- Wei GH, Badis G, Berger MF, Kivioja T, Palin K, Enge M, Bonke M, Jolma A, Varjosalo M, Gehrke AR, et al. Genome-wide analysis of ETS-family DNA-binding in vitro and in vivo. Embo J. 2010;29:2147–2160. doi: 10.1038/emboj.2010.106. [DOI] [PMC free article] [PubMed] [Google Scholar]
Associated Data
This section collects any data citations, data availability statements, or supplementary materials included in this article.