Abstract
This study describes a novel mechanism of regulation of the high-affinity Na+-dependent adenosine transporter (CNT2) via the activation of A1 adenosine receptors (A1R). This regulation is mediated by the activation of ATP-sensitive K+ (KATP) channels. The high-affinity Na+-dependent adenosine transporter CNT2 and A1R are coexpressed in the basolateral domain of the rat hepatocyte plasma membrane and are colocalized in the rat hepatoma cell line FAO. The transient increase in CNT2-mediated transport activity triggered by (−)-N6-(2-phenylisopropyl)adenosine is fully inhibited by KATP channel blockers and mimicked by a KATP channel opener. A1R agonist activation of CNT2 occurs in both hepatocytes and FAO cells, which express Kir6.1, Kir6.2, SUR1, SUR2A, and SUR2B mRNA channel subunits. With the available antibodies against Kir6.X, SUR2A, and SUR2B, it is shown that all of these proteins colocalize with CNT2 and A1R in defined plasma membrane domains of FAO cells. The extent of the purinergic modulation of CNT2 is affected by the glucose concentration, a finding which indicates that glycemia and glucose metabolism may affect this cross-regulation among A1R, CNT2, and KATP channels. These results also suggest that the activation of KATP channels under metabolic stress can be mediated by the activation of A1R. Cell protection under these circumstances may be achieved by potentiation of the uptake of adenosine and its further metabolization to ATP. Mediation of purinergic responses and a connection between the intracellular energy status and the need for an exogenous adenosine supply are novel roles for KATP channels.
Adenosine is an autocoid that acts physiologically on specific cell surface G protein-coupled receptors, four of which (A1, A2A, A2B, and A3) have been cloned and described pharmacologically (18, 23, 39). A1 adenosine receptors (A1R) mediate a broad range of signaling responses by coupling to Gi and Go proteins (18, 23, 33). The activation of A1R regulates several membrane and intracellular proteins, such as adenylate cyclase, phospholipase C, Ca2+ channels (23, 39), and K+ channels (3, 26, 35).
mRNAs encoding the four adenosine receptors have been detected in liver cells (12). In isolated rat hepatocytes, the activation of A1R triggered Ca2+-mediated glycogenolysis, the activation of A2 adenosine receptors stimulated cyclic AMP (cAMP)-mediated gluconeogenesis, and the activation of A3 adenosine receptors increased cytosolic Ca2+ and decreased cAMP levels, with minor changes in glycogen metabolism (20). In hepatocyte plasma membranes, the stimulation of adenylate cyclase activity and the inhibition of low-Km cAMP phosphodiesterase activity are coordinately regulated by glucagon, and A1R can inhibit glucagon-stimulated cAMP accumulation by blocking the effect of glucagon on phosphodiesterase activity (40). Moreover, a signal pathway involving A2a adenosine receptors, Gi proteins, phospholipase C, protein kinase C (PKC) δ, PKC ɛ, and p38 mitogen-activated protein has been suggested to be responsible for the development of liver ischemic preconditioning (6).
The availability of adenosine to adenosine receptors may depend on the sequential hydrolysis, catalyzed by extracellular ectonucleotidases, of ATP to ADP, AMP, and finally adenosine (25, 42). The question arises as to how adenosine is retrieved from receptor binding and how purinergic activation is terminated. Evidence suggests that equilibrative nucleoside transporters (ENTs) may be involved. Blocking of ENT1 function in rat motor nerve terminals potentiates adenosine effects through inhibitory (A1) and excitatory (A2) receptors (8), whereas intracerebroventricular administration of an ENT1 inhibitor to rats protects from forebrain ischemia although, unexpectedly, without any significant changes in adenosine levels (37). In human airway epithelial cells, adenosine inhibition and ENT1 inhibition exert nonadditive activation of K+ conductance, consistent with a role for ENT1 in potentiating agonist activation of A1R (46). The substantia gelatinosa of the rat superficial dorsal horn is rich in nitrobenzylthioinosine (NBTI) binding sites, suggesting the presence of ENTs (19). While the nucleoside adenosine plays a critical neuromodulatory role throughout the central nervous system, in the dorsal horn of the spinal cord its actions are associated in particular with antinociception in vivo (16, 43). In fact, intrathecal A1R agonists produce antinociception (44). Recently, it was shown that the inhibition of ENT1 attenuated excitatory postsynaptic currents in a manner that was mimicked by A1R agonists and partially reversed by the extracellular addition of adenosine deaminase, suggesting a role for ENT1 in modulating extracellular adenosine availability (1).
However, ENTs are not good candidates for the efficient uptake of extracellular adenosine into mammalian cells. The high-affinity concentrative Na+-dependent nucleoside transporter CNT2 shows a much lower apparent Km for adenosine and inosine than ENT1 (8 versus 40 μM and 4 versus 170 μM, respectively) (28, 49, 50) and, in contrast to the initial view that concentrative nucleoside transporters (CNTs) would be restricted to absorptive and reabsorptive epithelia, CNT expression is much more widespread than expected (38, 48). CNT2 is a purine-preferring nucleoside transporter that accepts the pyrimidine nucleoside uridine as a substrate. CNT1 selectivity for adenosine may be different among orthologs, although it has been clearly established that human CNT1 is not an adenosine transporter. Thus, CNT2 is a suitable candidate for modulating extracellular adenosine concentrations. On the other hand, evidence of transporter function being modulated by purinergic activation is scarce. Whereas it was shown more than a decade ago that agonist activation of A2 receptors increased the Vmax of equilibrative adenosine transport (ENT type) into chromaffin cells (9), the efflux of formycin B via ENT1 transporters does not appear to be regulated by A1R or A2 adenosine receptor activation in cultured smooth muscle cells (5).
Thus, the goal of this study was to determine whether high-affinity adenosine transporter function, mediated by CNT2, is under purinergic control. Since CNT2 function and adenosine-mediated receptor processes have been detected in liver parenchymal cells, primary cultures of rat hepatocytes and the rat hepatoma cell line FAO were studied here to address this issue. Here it is shown, for the first time, that purinergic activation leads to an increase in CNT2 activity via a mechanism which is dependent on ATP-sensitive K+ (KATP) channels, demonstrating a functional link among adenosine receptors, high-affinity adenosine transporters, and intracellular energy status.
MATERIALS AND METHODS
Liver parenchymal and FAO cells.
Hepatocytes were isolated from male Wistar rats by a modification of the classical collagenase perfusion method as previously described (11). The livers were perfused in an anterograde manner with Hanks' salt solution, composed of 5.4 mM KCl, 0.44 mM KH2PO4, 0.33 mM Na2HPO4 · 2H2O, 136.4 mM NaCl, 4.2 mM NaHCO3, and 0.5 mM EGTA (pH 7.3). This buffer was used to wash off the blood. Then, a second buffer, composed of 5.4 mM KCl, 0.44 mM KH2PO4, 0.98 mM MgCl2 · 6H2O, 0.81 mM MgSO4 · 7H2O, 136 mM NaCl, 1.33 mM NaH2PO4 · 2H2O, 5 mM CaCl2 · 2H2O, 5.5 mM d-glucose, and 20 mM HEPES and supplemented with collagenase at a final concentration of 0.05 mg/ml, was used to perfuse the livers again. Disaggregated cells were washed in the same buffer, not supplemented with collagenase but supplemented with 1% bovine serum albumin (BSA). The viability of cells, routinely over 90%, was determined by trypan blue exclusion. Isolated hepatocytes were seeded at a density of 0.1 × 10⁵ cells/cm2 in Earle's E-199 medium supplemented with 2% fetal calf serum and a mixture of antibiotics (100 U of penicillin G/ml, 0.1 mg of streptomycin/ml, and 0.25 μg of amphotericin B [Fungizone]/ml). This medium was replaced by Earle's E-199 medium containing 0.5% BSA instead of fetal calf serum. Primary cultures were used at 15 h after seeding.
The FAO cell line was obtained from the American Type Culture Collection. FAO cells retain significant CNT2 activity and expression (11) and grow in modified Coon's F-12 medium supplemented with 10% fetal calf serum and the same mixture of antibiotics as that described above.
Nucleoside uptake measurements.
Nucleoside transport activity was monitored with cultured hepatocytes and hepatoma FAO cells in either Na+-containing or Na+-free medium as previously described (11). The uptake buffer consisted of 5.4 mM KCl, 1.8 mM CaCl2, 1.2 mM MgSO4, and 10 mM HEPES (pH 7.4) and was supplemented with 137 mM NaCl or choline chloride. One minute of incubation was used, as it corresponds to linear velocity conditions in these two cell systems (11). Uptake assays were stopped by washing cells in cold stop medium (11), followed by immediate treatment of monolayers with 1 ml of 0.5% (vol/vol) Triton X-100 in 100 mM NaOH. Aliquots were used for radioactivity counting and protein determination according to the Bradford assay (Bio-Rad Laboratories, Madrid, Spain). The nucleosides used as substrates were uridine and guanosine; the tracers used were [2,3-3H]uridine and [8-3H]guanosine (Amersham, Buckinghamshire, United Kingdom). Unless otherwise stated, nucleosides were always used at a 1 μM concentration. The specificity of the CNT2 activity assay was assessed by measuring the Na+-dependent component of either guanosine or uridine uptake, which turned out to be completely insensitive to inhibition by either NBTI or cytidine.
To determine the effect and the specificity of purinergic activation on nucleoside transport activity, cells were incubated for various times with the adenosine receptor agonists (−)-N6-(2-phenylisopropyl)adenosine (R-PIA) (10 nM, 50 nM, 100 nM, 1 μM, and 10 μM), N6-cyclopentyladenosine (CPA) (50 nM), 5′-N-ethylcarboxamidoadenosine (NECA) (50 nM), and 8(4-[([((2-aminoethyl)amino)carbonyl]methyl)-oxy]phenyl)-1,3-dipropylxanthine (XAC) (50 nM) in the absence or the presence of the adenosine receptor antagonists 2-[p-(2-carboxyethyl)phenethylamino]-5′-N-ethylcarboxamidoadenosine (CGS 21680) (1 μM) and 8-cyclopentyl-1,3-dipropylxanthine (DPCPX) (1 μM), all from Sigma (St. Louis, Mo.). CNT2-mediated nucleoside transport was monitored as indicated above.
The involvement of KATP channels in this response was assessed by measuring CNT2-mediated nucleoside transport after R-PIA treatment as described above, either in the absence or in the presence of the following modulators: BaCl2, 7-chloro-3-methyl-2H-1,2,4-benzothiadizine-1,1-diazoxide (diazoxide), N-p-(2-[5-chloro-2-methoxybenzamido]ethyl), benzenesulfonyl-N′-cyclohexylurea (glybenclamide), N-cyano-N′-4-pyridinyl-N"-(1,2,2-trimethylpropyl)guanidine (pinacidil), and 1-butyl-3-(4-methylbenzenesulfonyl)-urea (tolbutamide). All drugs were obtained from Sigma, except for glybenclamide, which was purchased from Tocris Cookson (Bristol, United Kingdom). Drug concentrations and incubation times were optimized based upon our own determinations and previous literature.
Western blot analysis and immunofluorescence microscopy.
To determine the occurrence of the high-affinity concentrative adenosine transporter CNT2 and A1R in our experimental models, Western blot analysis were performed with previously characterized antibodies (7, 48). Liver homogenates, basolateral plasma membranes isolated as previously described (14), and crude extracts from FAO cells were used. Samples were treated with 0.5% Triton X-100-10 mM Tris (pH 7.4), and 20-μg protein aliquots were run on sodium dodecyl sulfate-10% polyacrylamide gels (10, 13). Proteins were transferred to filters (Immobilon-P; 0.45-μm-pore size; Millipore, Bedford, Mass.), blocked in a 5% dry milk-0.2% Tween 20-phosphate-buffered saline (PBS) solution, and then subjected to immunoreaction with anti-CNT2 (dilution, 1/1,000) and anti-A1R (dilution, 3 μg/ml) antibodies. Enhanced chemiluminescence (Amersham, Buckinghamshire, United Kingdom) was used to visualize these two proteins.
The recently characterized polyclonal antibodies (45) raised against Kir6.1, Kir6.2, SUR2A, and SUR2B were also used to unequivocally demonstrate that ATP-dependent K+ channels are indeed expressed in FAO cells. They all proved to be suitable for immunocytochemistry analysis.
For colocalization of A1R, CNT2, and Kir6.1, Kir6.2, SUR2A, or SUR2B, triple-staining immunocytochemistry analysis and confocal microscopy were performed. FAO cells were seeded at a concentration of 50,000 cells/well on glass coverslips treated with poly-d-lysine (Sigma-Aldrich, Madrid, Spain) and placed in 24-well plates. Cells grown to 60 to 70% confluence were washed with PBS, fixed with 4% paraformaldehyde-0.06 M sucrose for 15 min, and washed with PBS-20 mM glycine for 10 min. For permeabilization, cells were treated with saponin (Sigma) (0.02% in PBS) for 15 min and washed again with PBS-20 mM glycine for 10 min. Cells were subsequently washed with PBS and treated with blocking buffer (1% BSA, 2% goat serum, 150 mM NaCl, 15 mM sodium citrate [pH 7.5]) for 1 h at room temperature. Incubation with primary antibody against Kir6.1 (1/100), Kir6.2 (1/100), SUR2A (1/250), or SUR2B (1/250) was performed for 1 h at room temperature. Cells were washed for 10 min with washing buffer (0.05% Triton X-100, 150 mM NaCl, 15 mM sodium citrate [pH 7.5]) and incubated with secondary antibody (anti-rabbit antibody conjugated to Alexa-488; A-11070; 1/1,000; Molecular Probes, Eugene, Oreg.) for 45 min at room temperature in darkness. After a 10-min wash with washing buffer, a second fixation was performed with 2% paraformaldehyde-0.06 M sucrose for 5 min. Cells were washed with PBS-20 mM glycine for 10 min and incubated with blocking buffer for 1 h in darkness. Double direct immunostaining was performed with fluorescein-conjugated anti-A1R (PC21-Cyn3; 10 μg/ml) and anti-CNT2 (anti-CNT2-Cyn5; 10 μg/ml) for 1.5 h at room temperature. Coverslips were rinsed twice with washing buffer for 10 min each time and mounted with medium suitable for immunofluorescence (ICN, Costa Mesa, Calif.). Samples were analyzed by using an Olympus Fluoview 500 confocal microscope (Olympus model IX-70 inverted fluorescence microscope). Controls with irrelevant secondary antibodies conjugated to the same fluorophore and autofluorescence controls were used.
RT-PCR analysis.
The expression of KATP channels in FAO and parenchymal liver cells was assessed by using specific oligonucleotides suitable for the amplification of Kir6.1, Kir6.2, SUR1, and SUR2. cDNA from the pancreas was used in all assays as a positive control for reverse transcription (RT)-PCR amplification, since this organ is known to express these four genes. PC12 cells are known to lack Kir6.1 expression and were used as a negative control for this gene (22). Briefly, mRNA was isolated by using a Wizard Plus SV Minipreps DNA purification system (Promega, Madison, Wis.) and retrotranscribed into cDNA by oligo-dT priming. Oligonucleotides used for KATP channel isoform amplification were as follows: for Kir6.1, the forward primer was GAGTGAACTGTCGCACCAGA (bases from 1292 to 1311) and the reverse primer was CGATCACCAGAACTCAGCAAAC (bases from 1539 to 1518); for Kir6.2, the forward primer was TCCAACAGCCCGCTCTAC (bases from 787 to 804) and the reverse primer was GATGGGGACAAAACGCTG (bases from 954 to 937); for SUR1, the forward primer was CCCAGAGAAGAAATGCTCAGACAGC (bases from 4579 to 4603) and the reverse primer was GAGAAGCTTTTCCGGCTTGTC (bases from 4957 to 4937); and for SUR2, the forward primer was ACCTGCTCCAGCACAAGAAT (bases from 4853 to 4872) and the reverse primer was TCTCTTCATCACAATGACCAGG (bases from 4997 to 4976). Oligonucleotides used for recombinant glyceraldehyde 3-phosphate dehydrogenase (rGAPDH) amplification (control) were as follows: the forward primer was CTACCCACGGCAAGTTCAAT (bases from 176 to 195) and the reverse primer was CCACAGTCTTCTGAGTGGCA (bases from 589 to 570). For rGAPDH, Kir6.1, Kir6.2, and SUR1, PCRs were run for 35 cycles at 94°C (2 min), 53°C (1.5 min), and 72°C (1 min), followed by a final extension at 72°C (10 min). For SUR2 amplification, a two-step protocol was used, first with 10 cycles at 92°C (2.5 min), 50°C (1.5 min), and 72°C (1 min) and second with 40 cycles at 92°C (2.5 min), 53°C (1.5 min), and 72°C (1 min) and a final extension at 72°C (10 min). The PCR products were separated on 2.5% agarose gels.
RESULTS
Liver parenchymal and FAO cells express the high-affinity adenosine transporter CNT2 and A1R.
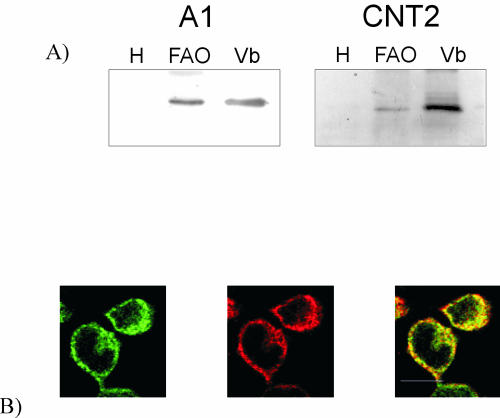
Figure 1a shows a representative Western blot demonstrating that CNT2 and A1R proteins are enriched in basolateral plasma membranes from rat liver. Both membrane proteins were undetectable in crude liver homogenates. CNT2 and A1R were also detected in crude extracts from FAO cells by Western blot analysis. Immunofluorescence experiments and confocal microscopy revealed that in FAO cells, both proteins were abundant in intracellular structures (Fig. 1b), with some staining at the plasma membrane, where partial colocalization of CNT2 and A1R was observed (Fig. 1b).
FIG. 1.
Detection of CNT2 and A1R proteins in basolateral plasma membrane vesicles from rat liver and the rat hepatoma cell line FAO. (a) Representative Western blot showing A1R (A1) and CNT2 proteins in rat liver plasma membrane vesicles enriched in the basolateral domain (lanes Vb). These two proteins were not detected in crude liver homogenates (lanes H) but were easily detected in crude FAO cell extracts (lanes FAO). (b) Colocalization between CNT2 and A1R in FAO cells. Permeabilized cells were treated with anti-CNT2 antibody conjugated with Cyn5 (green) and anti-A1R antibody conjugated with Cyn3 (red). Immunofluorescence assays were performed as described in Materials and Methods. Superimposition of images reveals colocalization in yellow. A representative image is shown. Scale bar, 10 μm.
Activation of A1R results in increased CNT2-mediated nucleoside uptake.
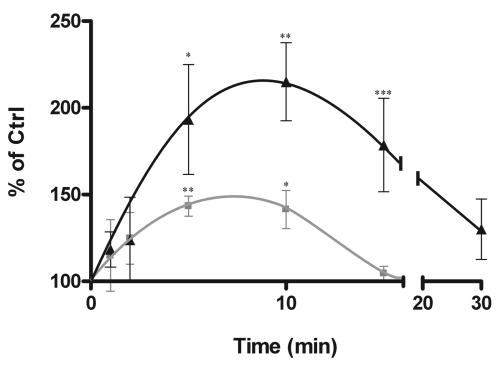
To monitor whether nucleoside transport activity changed after adenosine receptor activation, R-PIA (50 nM) was added to primary cultures of rat hepatocytes, and Na+-dependent uridine transport was monitored at different time points thereafter. Figure 2 shows that this adenosine receptor agonist triggered a marked increase (up to 2.5-fold above control values) in transport activity, with a maximum effect at 5 to 10 min after the addition of R-PIA. R-PIA (50 nM) similarly activated Na+-dependent uridine uptake in the rat hepatoma cell line FAO, although the length of the activation was shorter and the magnitude (40 to 60% stimulation of basal uptake rates) was lower than those found in primary cultures of rat hepatocytes (Fig. 2). This effect was reproducible and highly significant (routinely, P values were <0.01), as determined by the paired t test.
FIG. 2.
Purinergic activation of CNT2. Na+-dependent uridine uptake, mediated by CNT2, was monitored either in freshly isolated rat hepatocytes (triangles) or in FAO cells (squares) after the addition of 50 nM R-PIA. Results were derived from quadruplicate estimations made in 9 and 10 independent experiments for hepatocytes and FAO cells, respectively; an experiment was considered independent when new cells were seeded on multiwell plates on different days or when different isolated hepatocyte preparations were used. Data are expressed as the percent change above basal values (Ctrl, control). Basal uptake rates were 4 ± 0.3 and 8 ± 0.7 μmol of uridine/mg of protein (mean and standard error of the mean) for hepatocytes and FAO cells, respectively. Statistical significance of the R-PIA effect was established by using an analysis of variance (the P value was <0.01 for both FAO cells and hepatocytes) combined with a Student t test (a single asterisk indicates a P value of <0.05, a double asterisk indicates a P value of <0.01, and a triple asterisk indicates a P value of <0.001).
Since uridine is a common substrate for all known nucleoside transporters, guanosine uptake and cytidine uptake were also measured to determine whether this effect was specific for CNT2. The activating effect of A1R agonists on uridine concentrative uptake was also found when guanosine was used as a substrate, whereas Na+-dependent cytidine transport was negligible, before and after R-PIA addition (data not shown). Since cytidine is a substrate for CNT1 and CNT3 (30), these findings are consistent with CNT2 being the major concentrative nucleoside transporter functionally expressed in FAO cells and the only one that responds to A1R activation. Experiments performed thereafter to elucidate the mechanisms by which R-PIA triggers the activation of the CNT2 carrier (see below) were carried out with guanosine as the substrate. Guanosine even appeared to be a better choice than adenosine, because guanosine is not an A1R agonist and thus does not play, as adenosine would, a dual role as a transporter substrate and as a receptor agonist. Guanosine uptake in the absence of sodium was mostly accounted for by ENT1, as deduced from experiments with the ENT1 inhibitor NBTI. This transport activity was not modified by R-PIA treatment (data not shown), suggesting that A1R activation does not induce the equilibrative transporters.
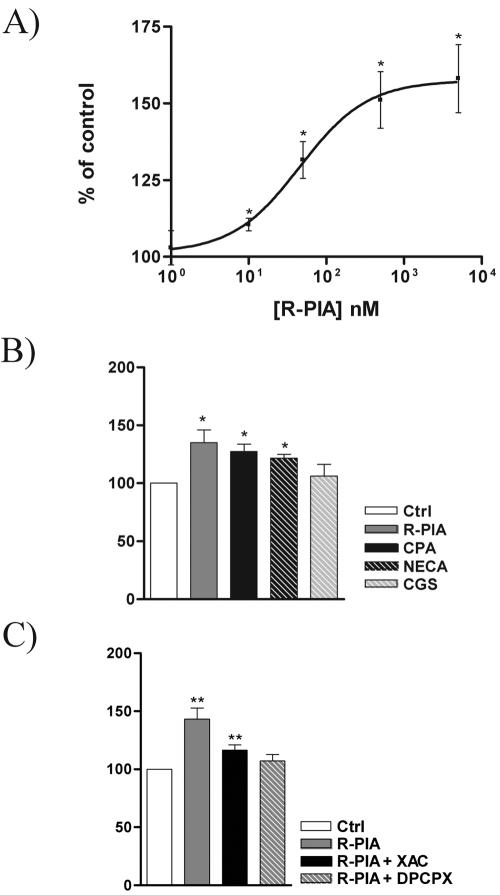
In FAO cells, CNT2 activation induced by R-PIA was dose dependent (Fig. 3A). From dose-response curves, a 50% effective dose of 40 ± 10 nM (mean and standard error of the mean) was deduced. To assess whether the purinergic activation of CNT2 was indeed mediated by receptors of the A1R type, different adenosine receptor agonists and antagonists were tested. Na+-dependent uptake of guanosine was monitored after incubation with the adenosine analogs at 50 nM (Fig. 3B). Agonist-induced CNT2 activation was observed with R-PIA, CPA, and NECA; CGS was unable to activate CNT2. These results suggest the involvement of A1R in agonist-induced CNT2 activation. Moreover, the effect of 50 nM R-PIA on Na+-dependent guanosine transport was counteracted by pretreatment (15 min) of FAO cells with 1 μM XAC and was completely blocked by 1 μM DPCPX (Fig. 3C). These results suggest the involvement of A1R in the regulation of nucleoside transport (24).
FIG. 3.
Effect of adenosine receptor agonists and antagonists on CNT2 transport activity in FAO cells. (A) Na+-dependent guanosine uptake into FAO cells was monitored after a 5-min treatment with R-PIA at various concentrations. (B) Na+-dependent guanosine uptake was monitored after a 5-min incubation of FAO cells with different A1R agonists (R-PIA, CPA, NECA, and CGS, each at 50 nM). Ctrl, control. (C) Activation of Na+-dependent guanosine uptake into FAO cells by R-PIA (50 nM) treatment for 5 min was antagonized by preincubation of cells for 30 min with A1R antagonists (DPCPX and XAC, each at 1 μM). Results are the mean and standard error of the mean of quadruplicate estimations made in four independent experiments. Data are expressed as the percent change above basal values. The basal uptake rate was 15.9 ± 0.0 μmol of guanosine/min/mg of protein. Statistical significance of the R-PIA effect in the four sets of experiments was established by using a paired t test (a single asterisk indicates a P value of <0.05, and a double asterisk indicates a P value of <0.01).
To further demonstrate the specificity of the purinergic activation of CNT2, another set of experiments was performed; in these experiments, the Na+-dependent uptake of an amino acid, alanine, was monitored after 5 min of incubation with 50 nM R-PIA. Incubation with this adenosine receptor agonist did not affect alanine uptake rates (data not shown).
Effect of R-PIA treatment on CNT2-mediated nucleoside uptake kinetics.
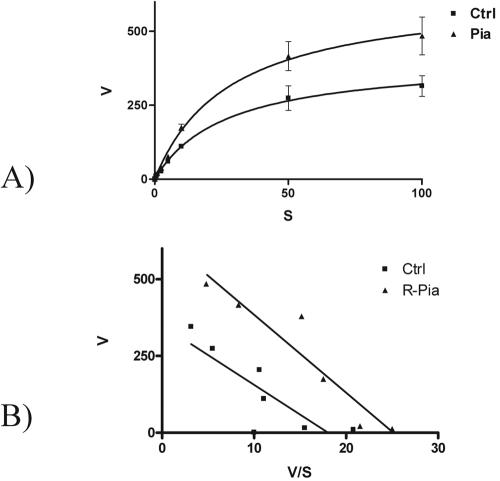
The rapid activation of CNT2-mediated nucleoside uptake would be consistent with either a decrease in the apparent Km values for substrates or an increase in the Vmax. To identify the kinetic impact of the purinergic activation triggered by R-PIA, Na+-dependent guanosine transport was monitored at substrate concentrations ranging from 1 to 100 μM, either in the absence or in the presence of preincubation with 50 nM R-PIA for 5 min as described above. The concentration-dependent uptake of guanosine is shown in Fig. 4A. The Eadie-Hofstee plots shown in Fig. 4B indicate that the apparent Km values were not significantly changed by R-PIA treatment (14 versus 19 μM) but that the Vmax was increased about 60% above control values by R-PIA treatment (693 versus 426 pmol of guanosine/min/mg of protein) (P < 0.01).
FIG. 4.
Kinetic characterization of the effect of R-PIA on CNT2 transport function in FAO cells. (A) Na+-dependent guanosine uptake was monitored at various substrate concentrations (from 1 to 100 μM). CNT2-mediated guanosine uptake followed Michaelis-Menten kinetics. Ctrl, control. (B) Eadie-Hofstee plot of data shown in panel A. Results are the mean and standard error of the mean of quadruplicate estimations made in seven independent kinetic determinations.
Involvement of K+ channels in R-PIA-mediated CNT2 activation.
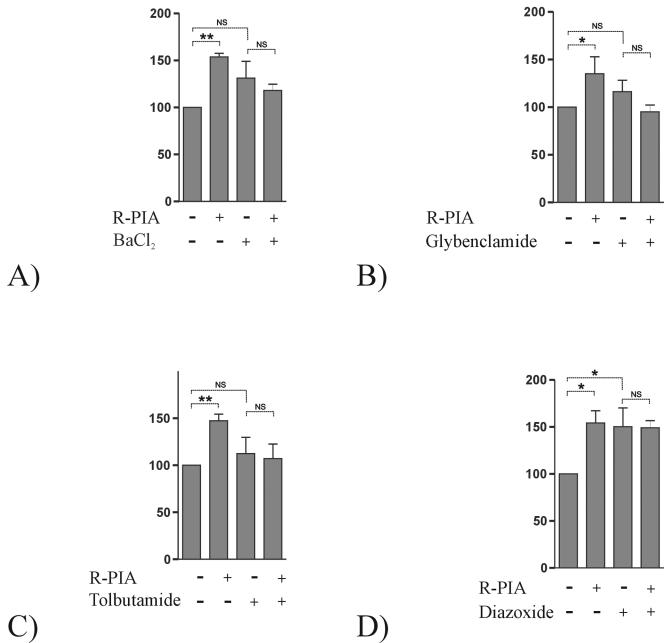
For a few cell systems, it has been proposed that purinergic activation may increase K+ conductance (3, 26, 35). To check whether K+ channels were involved in R-PIA-mediated CNT2 activation, a known blocker of K+ conductance showing broad selectivity, BaCl2, was used. Figure 5A shows the effect of preincubating cells with 100 μM BaCl2 for 30 min on the activation of CNT2 function triggered by R-PIA. BaCl2 treatment inhibited this response.
FIG. 5.
Effect of KATP channel blockers and an opener on the R-PIA-induced increase in CNT2-mediated transport activity in FAO cells. Na+-dependent guanosine uptake into FAO cells was monitored after 50 nM R-PIA treatment (5 min). K+ conductance either was not inhibited or was inhibited by preincubation of cells with 100 μM BaCl2 for 30 min (A), 50 μM glybenclamide for 15 min (B), or 10 μM tolbutamide for 30 min (C). The effect of a KATP channel opener on the increase in CNT2-mediated transport triggered by 50 nM R-PIA treatment (5 min) was also monitored by preincubation of cells with 100 μM diazoxide for 30 min. Results are the mean and standard error of the mean of quadruplicate estimations made in six independent experiments. Data are expressed as the percent change above basal values. The basal uptake rate was 9.4 ± 0.1 μmol of guanosine/min/mg of protein. Paired t tests were used separately (indicated by dotted lines) to determine the statistical significance of the R-PIA treatment and the addition of KATP channel blockers and the opener (NS, not significant; a single asterisk indicates a P value of <0.05, and a double asterisk indicates a P value of <0.01).
To identify the type of K+ channel involved in the R-PIA-mediated activation of CNT2, experiments combining either blockers or openers of selected channels were designed. Figure 5B and C show the effect of two specific KATP channel blockers on the activation of CNT2 by R-PIA. Preincubation with 50 μM glybenclamide for 15 min completely blocked the effect triggered by R-PIA (Fig. 5B). Preincubation with tolbutamide (10 μM), another KATP channel blocker with a selectivity slightly different from that of glybenclamide, for 30 min also blocked the effect triggered by R-PIA (Fig. 5C).
Experiments involving the selective opening of KATP channels by a specific drug were also performed. Preincubation with 100 μM diazoxide (a KATP channel opener) for 30 min increased CNT2-mediated guanosine transport to the same levels as those achieved with R-PIA treatment (Fig. 5D). Under these conditions, A1R activation did not trigger a further increase, presumably because the KATP channel was already open (Fig. 5D). Similar results were obtained when cells were preincubated with R-PIA prior to diazoxide treatment (data not shown). Thus, diazoxide completely mimicked the effect induced by the A1R agonist R-PIA.
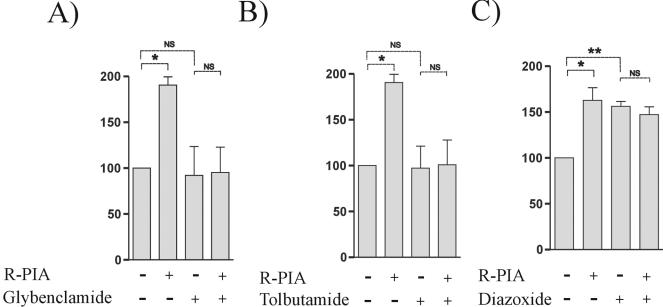
To further ascertain whether this mechanism of action also contributed to the purinergic activation of CNT2 in primary cultures of rat hepatocytes, experiments similar to those performed with FAO cells were designed. Figure 6 shows the effect of glybenclamide (Fig. 6A), tolbutamide (Fig. 6B), and diazoxide (Fig. 6C) on the Na+-dependent guanosine uptake measured in primary cultures of rat hepatocytes that had been either pretreated or not pretreated with R-PIA. These two KATP channel blockers similarly inhibited the activation of CNT2-mediated guanosine transport triggered by R-PIA, whereas the channel opener diazoxide mimicked the effect induced by the agonist.
FIG. 6.
Effect of KATP channel blockers and an opener on the R-PIA-induced increase in CNT2-mediated transport activity in primary cultures of rat hepatocytes. As for FAO cells (Fig. 5), primary cultures of rat hepatocytes were treated with 50 nM R-PIA for 5 min. K+ conductance was stimulated or inhibited by preincubation of cells with 50 μM glybenclamide for 15 min (A), 10 μM tolbutamide for 30 min (B), or 100 μM diazoxide for 30 min (C). Then, Na+-dependent guanosine uptake into primary cultures of rat hepatocytes was monitored. Results are the mean and standard error of the mean of quadruplicate estimations made in two independent experiments. Data are expressed as the percent change above basal values. The basal uptake rate was 11.6 ± 0.1 μmol of guanosine/min/mg of protein. Paired t tests were used separately (indicated by dotted lines) to determine the statistical significance of the R-PIA treatment and the addition of KATP channel blockers and the opener (NS, not significant; a single asterisk indicates a P value of <0.05, and a double asterisk indicates a P value of <0.01).
FAO hepatoma cells and hepatocytes express similar KATP channels.
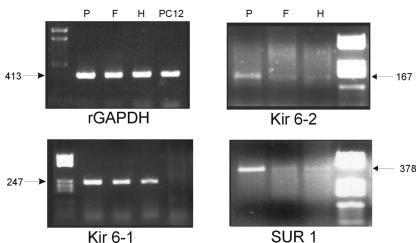
To determine whether rat hepatocytes and the rat hepatoma cell line FAO express similar KATP channels, RT-PCR was performed with oligonucleotides suitable for the amplification of the cDNAs corresponding to the four genes encoding the subunit proteins Kir6.1, Kir6.2, SUR1, and SUR2, which generate the heterodimer Kir6.x-SURx. Figure 7 shows representative results. After 35 amplification cycles, Kir6.1, Kir6.2, and SUR1 mRNAs were detected in both FAO cells and hepatocytes as well as in the positive control (pancreas, which is known to express all isoforms). rGAPDH was used as a control. These proteins appear to be more ubiquitously expressed than expected, although it is known that PC12 cells do not express Kir6.1. Thus, PC12 cDNA was also used as a negative control. SUR2 mRNA was also detected in both hepatocytes and FAO cells, but it required nearly 50 PCR cycles; therefore, these data may not be reliable (data not shown).
FIG. 7.
Expression of SURx and Kir6.x subunit isoforms in hepatocytes and FAO cells. RT-PCR was used to amplify Kir6.1, Kir6.2, and SUR2 mRNAs from FAO (F) and liver parenchymal (H) cells. rGAPDH was used as a control. The pancreas, which is known to express the four genes, was used as a positive control for RT-PCR amplification (P), whereas PC12 cells, which are known to lack Kir6.1 expression, were used as a negative control for Kir6.1 cDNA amplification. Representative agarose gels showing the amplification of cDNA fragments of the anticipated molecular weights are shown.
Colocalization of KATP channel proteins with A1R and CNT2 in FAO cells.
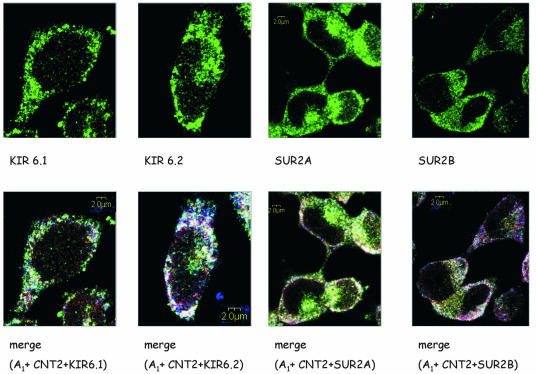
Antibodies against Kir6.1, Kir6.2, SUR2A and SUR2B were used to immunolocalize these four proteins in FAO cells. These cells express the four proteins (Fig. 8, top panels). This would be consistent with SUR2 KATP channel subunits being expressed in these cells despite the very low amount of mRNA, a feature which is not unusual for channels. Moreover, the lack of appropriate antibodies did not enable us to demonstrate the occurrence of SUR1 at the protein level, although it is highly likely to be expressed according to the RT-PCR data shown above.
FIG. 8.
Colocalization of Kir6.1, Kir6.2, SUR2A, and SUR2B with CNT2 and A1R in FAO cells. Permeabilized cells were treated with Kir6.1, Kir6.2, SUR2A, and SUR2B primary antibodies and were recognized with a secondary antirabbit antibody conjugated to Alexa-488 (green). Cells were also labeled with anti-CNT2 antibody conjugated with Cyn5 (red) and anti-A1R antibody conjugated with Cyn3 (blue). Immunofluorescence assays were performed as described in Materials and Methods. (Top panels) Immunostaining for channel subunits. (Bottom panels) Triple staining. Superimposition of images reveals the colocalization of CNT2, A1R, and Kir6.1, Kir6.2, SUR2A, or SUR2B in white. A representative image is shown. Scale bar, 2 μm.
To investigate whether KATP channels colocalize with A1R and CNT2, immunostaining assays were performed with triple staining and confocal microscopy. Studies of the colocalization of channel subunits (in green), CNT2 (in red), and A1R (in blue) are shown in Fig. 8 (bottom panels). The results obtained indicated that the four subunits are present in FAO cell membranes and that they colocalize (white) with both A1R and CNT2 in some membrane domains. In fact, the label for the triple staining is punctuated.
Purinergic activation of CNT2 is dependent on extracellular glucose.
Since glucose metabolism affects the activity of KATP channels in pancreatic β cells (2, 15, 36), the effect of glucose concentrations on the activation by R-PIA of CNT2-mediated nucleoside transport was monitored. Cells were cultured for the last 24 h before the experiments in a glucose-free medium supplemented with either 10 or 5.5 mM glucose. When FAO cells, which are routinely grown at high glucose concentrations, were cultured in 5.5 mM glucose, they showed an increase in CNT2-mediated transport activity triggered by R-PIA, similar to that found in rat hepatocytes cultured at physiological glucose concentrations (5.5 mM) (Fig. 9).
FIG. 9.
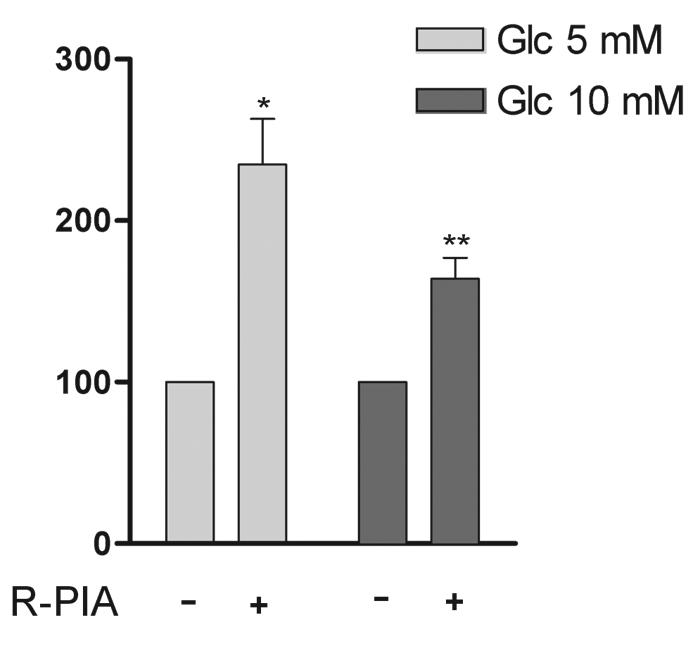
Effect of glucose in the culture medium on the purinergic increase in CNT2 activity. FAO cells were cultured with either 10 or 5 mM glucose for 24 h as indicated in Materials and Methods. Cells were incubated for 5 min either in the presence or in the absence of 50 nM R-PIA. Then, CNT2-mediated guanosine uptake was monitored. Results are the mean and standard error of the mean of quadruplicate estimations made in three independent experiments. Data are expressed as the percent change above basal values. Basal uptake rates were 16.2 ± 0.5 and 17.5 ± 0.4 μmol of guanosine/min/mg of protein for control and high-glucose media, respectively. Statistical significance was assessed by using a paired t test (a single asterisk indicates a P value of <0.05, and a double asterisk indicates a P value of <0.01).
DISCUSSION
This study demonstrates that agonists specific for A1R increase the activity of the high-affinity concentrative adenosine transporter CNT2. Thus, a functional link between A1R and the high-affinity transporter is demonstrated for the first time. Also, a new physiological role for KATP channels is demonstrated, since they mediate the signal that links extracellular adenosine function with adenosine retrieval and uptake into the cell, where it may contribute to replenishing the nucleotide pool. Although it cannot be concluded from this study that CNT2, rather than ENT1, significantly modulates extracellular adenosine concentrations and thus availability to receptors, the functional link between A1R and CNT2, but not ENT1, suggests a mechanism for allowing receptor desensitization after agonist activation. The location of both A1R and CNT2 at the basolateral membrane of the hepatocyte adds physiological relevance to these findings and suggests that portal adenosine may activate this process. Further evidence for a putative coordinate regulation among the elements of this membrane mechanism involving a transporter, a channel, and a receptor comes from transgenic mice overexpressing A1R, in which the concomitant overexpression of KATP channel subunits has been reported (32). Very recently, it was shown for both neural and nonneural cell systems that adenosine modulates KATP channel intracellular trafficking (21).
Information on the occurrence and role of K+ channels in hepatocytes is scarce. However, a few of them were molecularly and/or functionally identified recently (29, 41). KATP channels are indeed expressed in human liver cells, in which Kir6.1, SUR1, and SUR2 mRNAs have been detected (29). This finding was further demonstrated functionally by electrophysiological recordings showing a minoxidil-activating current that was inhibited by glybenclamide. The RT-PCR and immunocytochemistry data presented in this study unequivocally demonstrate that KATP channels are expressed in hepatocytes, and the pharmacological analysis of CNT2-activated function with A1R agonists supports their new key role in mediating the purinergic activation of CNT2. Moreover, the pattern of KATP channel subunit isoforms expressed in the rat hepatoma cell line FAO is similar to that found in hepatocytes, in agreement with FAO cells being relatively well differentiated compared to other hepatoma-derived cells.
The physiological role of these channels is under discussion. The addition of the KATP channel blocker glybenclamide to primary cultures of rat hepatocytes induced to proliferate by hepatocyte growth factor is known to result in dose-dependent inhibition of [3H]thymidine incorporation into DNA, suggesting a role for KATP channels in cell proliferation (29). This effect is not related to altered CNT2 function, because thymidine is not a CNT2 substrate. Interestingly, CNT2 expression at the mRNA level appears to be cell cycle regulated in FAO cells (11) and, in accordance, CNT2 protein levels increase during liver regeneration (17). Thus, the functional link between CNT2 and KATP channels may have physiological implications beyond a mere nutritional adaptation to adenosine portal supply. Moreover, KATP channels are also known to mediate protection against ischemic injury, a situation in which high extracellular adenosine concentrations occur. Very recently, it was shown that adenosine, besides triggering short-term activation of KATP channels, also promotes channel internalization (21), thus down-regulating activity and avoiding the deleterious consequences of excessive KATP channel opening. In this context, CNT2 activation would also contribute to the depletion of extracellular adenosine pools, thus helping to terminate purinergic effects. KATP internalization is PKC dependent, and indeed PKC appears to be a central mediator in ischemic preconditioning (34). Interestingly, we recently found that the activation of CNT2 triggered by R-PIA can be blocked by inhibition of PKC (unpublished observations).
The particular mechanism that links KATP channel opening to CNT2 activation will require further research, although the energy status of cells may modulate this functional cross talk, since glucose concentrations determine the magnitude of R-PIA-triggered CNT2 activation. These data, in turn, might be relevant for a better understanding of the mechanisms by which adenosine modulates glucose metabolism and transport (4, 47). CNT transporters are sensitive to membrane potential (27); therefore, transient KATP channel-mediated hyperpolarization may contribute to CNT2 activation, although the lack of response of other potential-sensitive transporters, such as those involved in alanine uptake, would argue against this possibility. However, functionally integrated membrane systems, like the one described here, involving a transporter, a channel, and a receptor may be compartmentalized at the plasma membrane. This scenario was recently described for voltage-gated K+ channels, which are differentially targeted to caveolar and noncaveolar rafts (31), perhaps also explaining the differential regulation of membrane functions. In fact, in FAO cells, K+ channel subunits colocalize with CNT2 and with A1R in specific membrane domains.
In summary, this study provides a new scenario for adenosine receptor-transporter interactions, in which the purinergic activation of A1R leads to the rapid stimulation of the high-affinity adenosine transporter CNT2 by a mechanism which is completely dependent on KATP channel function. These data strongly suggest that high-affinity adenosine uptake may also be related to the cell energy status, since it is known that channel function depends on the ATP/ADP ratio and that extracellular glucose availability also affects the extent of the purinergic activation of carrier function.
Acknowledgments
This work was supported by grants SAF2002-717 (MCYT, Spain) and SGR00037 (Generalitat de Catalunya, Catalonia, Spain) to M.P.-A., grant FIS PI020934 (MSC, Spain) to F.J.C., and grants SAF2002-03293 (MCYT), 02/056-00 (Fundació La Caixa), and 01/012710 (Fundació Marató TV3) to R.F.
We thank Robin Rycroft for editorial help and personnel from Servies Científics i Tècnics, University of Barcelona, for excellent technical assistance with confocal microscopy.
REFERENCES
- 1.Ackley, M. A., R. J. Governo, C. E. Cass, J. D. Young, S. A. Baldwin, and A. E. King. 2003. Control of glutamatergic neurotransmission in the rat spinal dorsal horn by the nucleoside transporter ENT1. J. Physiol. 548:507-517. [DOI] [PMC free article] [PubMed] [Google Scholar]
- 2.Ashcroft, S. J. 2000. The beta-cell K(ATP) channel. J. Membr. Biol. 176:187-206. [DOI] [PubMed] [Google Scholar]
- 3.Baxter, G. F., and D. M. Yellon. 1999. ATP-sensitive K+ channels mediate the delayed cardioprotective effect of adenosine A1 receptor activation. J. Mol. Cell. Cardiol. 31:981-989. [DOI] [PubMed] [Google Scholar]
- 4.Bollen, M., S. Keppens, and W. Stalmans. 1998. Specific features of glycogen metabolism in the liver. Biochem. J. 336:19-31. [DOI] [PMC free article] [PubMed] [Google Scholar]
- 5.Borgland, S. L., and F. E. Parkinson. 1998. Effect of adenosine receptor agonists on release of the nucleoside analogue [3H]formycin B from cultured smooth muscle DDT1 MF-2 cells. Eur. J. Pharmacol. 346:339-344. [DOI] [PubMed] [Google Scholar]
- 6.Carini, R., M. G. De Cesaris, R. Spendore, and E. Albano. 2000. Ethanol potentiates hypoxic liver injury: role of hepatocyte Na(+) overload. Biochim. Biophys. Acta 1502:508-514. [DOI] [PubMed] [Google Scholar]
- 7.Ciruela, F., V. Casado, J. Mallol, E. I. Canela, C. Lluis, and R. Franco. 1995. Immunological identification of A1 adenosine receptors in brain cortex. J. Neurosci. Res. 42:818-828. [DOI] [PubMed] [Google Scholar]
- 8.Correia-de-Sa, P., and J. A. Ribeiro. 1996. Adenosine uptake and deamination regulate tonic A2a receptor facilitation of evoked [3H]acetylcholine release from the rat motor nerve terminals. Neuroscience 73:85-92. [DOI] [PubMed] [Google Scholar]
- 9.Delicado, E. G., A. Rodrigues, R. P. Sen, A. M. Sebastiao, J. A. Ribeiro, and M. T. Miras-Portugal. 1990. Effect of 5′-(N-ethylcarboxamido)adenosine on adenosine transport in cultured chromaffin cells. J. Neurochem. 54:1941-1946. [DOI] [PubMed] [Google Scholar]
- 10.del Santo, B., G. Tarafa, A. Felipe, F. J. Casado, and M. Pastor-Anglada. 2001. Developmental regulation of the concentrative nucleoside transporters CNT1 and CNT2 in rat liver. J. Hepatol. 34:873-880. [DOI] [PubMed] [Google Scholar]
- 11.del Santo, B., R. Valdes, J. Mata, A. Felipe, F. J. Casado, and M. Pastor-Anglada. 1998. Differential expression and regulation of nucleoside transport systems in rat liver parenchymal and hepatoma cells. Hepatology 28:1504-1511. [DOI] [PubMed] [Google Scholar]
- 12.Dixon, A. K., A. K. Gubitz, D. J. Sirinathsinghji, P. J. Richardson, and T. C. Freeman. 1996. Tissue distribution of adenosine receptor mRNAs in the rat. Br. J. Pharmacol. 118:1461-1468. [DOI] [PMC free article] [PubMed] [Google Scholar]
- 13.Dragan, Y., R. Valdes, M. Gomez-Angelats, A. Felipe, F. Javier Casado, H. Pitot, and M. Pastor-Anglada. 2000. Selective loss of nucleoside carrier expression in rat hepatocarcinomas. Hepatology 32:239-246. [DOI] [PubMed] [Google Scholar]
- 14.Duflot, S., M. Calvo, F. J. Casado, C. Enrich, and M. Pastor-Anglada. 2002. Concentrative nucleoside transporter (rCNT1) is targeted to the apical membrane through the hepatic transcytotic pathway. Exp. Cell Res. 281:77-85. [DOI] [PubMed] [Google Scholar]
- 15.Dunne, M. J., K. E. Cosgrove, R. M. Shepherd, and C. Ammala. 1999. Potassium channels, sulphonylurea receptors and control of insulin release. Trends Endocrinol. Metab. 10:146-152. [DOI] [PubMed] [Google Scholar]
- 16.Dunwiddie, T. V. 1985. The physiological role of adenosine in the central nervous system. Int. Rev. Neurobiol. 27:63-139. [DOI] [PubMed] [Google Scholar]
- 17.Felipe, A., R. Valdes, B. Santo, J. Lloberas, J. Casado, and M. Pastor-Anglada. 1998. Na+-dependent nucleoside transport in liver: two different isoforms from the same gene family are expressed in liver cells. Biochem. J. 330:997-1001. [DOI] [PMC free article] [PubMed] [Google Scholar]
- 18.Fredholm, B. B., A. P. Ijzerman, K. A. Jacobson, K. N. Klotz, and J. Linden. 2001. International Union of Pharmacology. XXV. Nomenclature and classification of adenosine receptors. Pharmacol. Rev. 53:527-552. [PMC free article] [PubMed] [Google Scholar]
- 19.Geiger, J. D., F. S. LaBella, and J. I. Nagy. 1985. Characterization of nitrobenzylthioinosine binding to nucleoside transport sites selective for adenosine in rat brain. J. Neurosci. 5:735-740. [DOI] [PMC free article] [PubMed] [Google Scholar]
- 20.Gonzalez-Benitez, E., R. Guinzberg, A. Diaz-Cruz, and E. Pina. 2002. Regulation of glycogen metabolism in hepatocytes through adenosine receptors. Role of Ca2+ and cAMP. Eur. J. Pharmacol. 437:105-111. [DOI] [PubMed] [Google Scholar]
- 21.Hu, K., C. S. Huang, Y. N. Jan, and L. Y. Jan. 2003. ATP-sensitive potassium channel traffic regulation by adenosine and protein kinase C. Neuron 38:417-432. [DOI] [PubMed] [Google Scholar]
- 22.Inagaki, N., Y. Tsuura, N. Namba, K. Masuda, T. Gonoi, M. Horie, Y. Seino, M. Mizuta, and S. Seino. 1995. Cloning and functional characterization of a novel ATP-sensitive potassium channel ubiquitously expressed in rat tissues, including pancreatic islets, pituitary, skeletal muscle, and heart. J. Biol. Chem. 270:5691-5694. [DOI] [PubMed] [Google Scholar]
- 23.Klinger, M., M. Freissmuth, and C. Nanoff. 2002. Adenosine receptors: G protein-mediated signalling and the role of accessory proteins. Cell. Signal. 14:99-108. [DOI] [PubMed] [Google Scholar]
- 24.Klotz, K. N., J. Hessling, J. Hegler, C. Owman, B. Kull, B. B. Fredholm, and M. J. Lohse. 1998. Comparative pharmacology of human adenosine receptor subtypes—characterization of stably transfected receptors in CHO cells. Naunyn-Schmiedeberg's Arch. Pharmacol. 357:1-9. [DOI] [PubMed] [Google Scholar]
- 25.Latini, S., and F. Pedata. 2001. Adenosine in the central nervous system: release mechanisms and extracellular concentrations. J. Neurochem. 79:463-484. [DOI] [PubMed] [Google Scholar]
- 26.Light, P. E., H. D. Kanji, J. E. Fox, and R. J. French. 2001. Distinct myoprotective roles of cardiac sarcolemmal and mitochondrial KATP channels during metabolic inhibition and recovery. FASEB J. 15:2586-2594. [DOI] [PubMed] [Google Scholar]
- 27.Lostao, M. P., J. F. Mata, I. M. Larrayoz, S. M. Inzillo, F. J. Casado, and M. Pastor-Anglada. 2000. Electrogenic uptake of nucleosides and nucleoside-derived drugs by the human nucleoside transporter 1 (hCNT1) expressed in Xenopus laevis oocytes. FEBS Lett. 481:137-140. [DOI] [PubMed] [Google Scholar]
- 28.Mackey, J. R., S. Y. Yao, K. M. Smith, E. Karpinski, S. A. Baldwin, C. E. Cass, and J. D. Young. 1999. Gemcitabine transport in xenopus oocytes expressing recombinant plasma membrane mammalian nucleoside transporters. J. Natl. Cancer Inst. 91:1876-1881. [DOI] [PubMed] [Google Scholar]
- 29.Malhi, H., A. N. Irani, P. Rajvanshi, S. O. Suadicani, D. C. Spray, T. V. McDonald, and S. Gupta. 2000. KATP channels regulate mitogenically induced proliferation in primary rat hepatocytes and human liver cell lines. Implications for liver growth control and potential therapeutic targeting. J. Biol. Chem. 275:26050-26057. [DOI] [PubMed] [Google Scholar]
- 30.Mangravite, L. M., I. Badagnani, and K. M. Giacomini. 2003. Nucleoside transporters in the disposition and targeting of nucleoside analogs in the kidney. Eur. J. Pharmacol. 479:269-281. [DOI] [PubMed] [Google Scholar]
- 31.Martens, J. R., N. Sakamoto, S. A. Sullivan, T. D. Grobaski, and M. M. Tamkun. 2001. Isoform-specific localization of voltage-gated K+ channels to distinct lipid raft populations. Targeting of Kv1.5 to caveolae. J. Biol. Chem. 276:8409-8414. [DOI] [PubMed] [Google Scholar]
- 32.Miki, T., K. Nagashima, and S. Seino. 1999. The structure and function of the ATP-sensitive K+ channel in insulin-secreting pancreatic beta-cells. J. Mol. Endocrinol. 22:113-123. [DOI] [PubMed] [Google Scholar]
- 33.Munshi, R., I. H. Pang, P. C. Sternweis, and J. Linden. 1991. A1 adenosine receptors of bovine brain couple to guanine nucleotide-binding proteins Gi1, Gi2, and Go. J. Biol. Chem. 266:22285-22289. [PubMed] [Google Scholar]
- 34.Nakano, A., M. V. Cohen, and J. M. Downey. 2000. Ischemic preconditioning: from basic mechanisms to clinical applications. Pharmacol. Ther. 86:263-275. [DOI] [PubMed] [Google Scholar]
- 35.Nayeem, M. A., and S. J. Mustafa. 2002. Mechanisms of delayed preconditioning with A1 adenosine receptor activation in porcine coronary smooth muscle cells. Pol. J. Pharmacol. 54:443-453. [PubMed] [Google Scholar]
- 36.Nichols, C. G., and J. C. Koster. 2002. Diabetes and insulin secretion: whither KATP? Am. J. Physiol. Endocrinol. Metab. 283:E403-E412. [DOI] [PubMed] [Google Scholar]
- 37.Parkinson, F. E., Y. W. Zhang, P. N. Shepel, S. C. Greenway, J. Peeling, and J. D. Geiger. 2000. Effects of nitrobenzylthioinosine on neuronal injury, adenosine levels, and adenosine receptor activity in rat forebrain ischemia. J. Neurochem. 75:795-802. [DOI] [PubMed] [Google Scholar]
- 38.Pastor-Anglada, M., F. J. Casado, R. Valdes, J. Mata, J. Garcia-Manteiga, and M. Molina. 2001. Complex regulation of nucleoside transporter expression in epithelial and immune system cells. Mol. Membr. Biol. 18:81-85. [DOI] [PubMed] [Google Scholar]
- 39.Ralevic, V., and G. Burnstock. 1998. Receptors for purines and pyrimidines. Pharmacol. Rev. 50:413-492. [PubMed] [Google Scholar]
- 40.Robles-Flores, M., G. Allende, E. Pina, and J. A. Garcia-Sainz. 1995. Cross-talk between glucagon- and adenosine-mediated signalling systems in rat hepatocytes: effects on cyclic AMP-phosphodiesterase activity. Biochem. J. 312:763-767. [DOI] [PMC free article] [PubMed] [Google Scholar]
- 41.Roman, R., A. P. Feranchak, M. Troetsch, J. C. Dunkelberg, G. Kilic, T. Schlenker, J. Schaack, and J. G. Fitz. 2002. Molecular characterization of volume-sensitive SK(Ca) channels in human liver cell lines. Am. J. Physiol. Gastrointest. Liver Physiol. 282:G116-G122. [DOI] [PubMed] [Google Scholar]
- 42.Roman, R. M., and J. G. Fitz. 1999. Emerging roles of purinergic signaling in gastrointestinal epithelial secretion and hepatobiliary function. Gastroenterology 116:964-979. [DOI] [PubMed] [Google Scholar]
- 43.Sawynok, J. 1998. Adenosine receptor activation and nociception. Eur. J. Pharmacol. 347:1-11. [DOI] [PubMed] [Google Scholar]
- 44.Sawynok, J., M. I. Sweeney, and T. D. White. 1986. Classification of adenosine receptors mediating antinociception in the rat spinal cord. Br. J. Pharmacol. 88:923-930. [DOI] [PMC free article] [PubMed] [Google Scholar]
- 45.Singh, H., D. Hudman, C. L. Lawrence, R. D. Rainbow, D. Lodwick, and R. I. Norman. 2003. Distribution of Kir6.0 and SUR2 ATP-sensitive potassium channel subunits in isolated ventricular myocytes. J. Mol. Cell. Cardiol. 35:445-459. [DOI] [PubMed] [Google Scholar]
- 46.Szkotak, A. J., A. M. Ng, J. Sawicka, S. A. Baldwin, S. F. Man, C. E. Cass, J. D. Young, and M. Duszyk. 2001. Regulation of K(+) current in human airway epithelial cells by exogenous and autocrine adenosine. Am. J. Physiol. Cell Physiol. 281:C1991-C2002. [DOI] [PubMed] [Google Scholar]
- 47.Thong, F. S., and T. E. Graham. 2002. The putative roles of adenosine in insulin- and exercise-mediated regulation of glucose transport and glycogen metabolism in skeletal muscle. Can. J. Appl. Physiol. 27:152-178. [DOI] [PubMed] [Google Scholar]
- 48.Valdes, R., M. A. Ortega, F. J. Casado, A. Felipe, A. Gil, A. Sanchez-Pozo, and M. Pastor-Anglada. 2000. Nutritional regulation of nucleoside transporter expression in rat small intestine. Gastroenterology 119:1623-1630. [DOI] [PubMed] [Google Scholar]
- 49.Wang, J., M. E. Schaner, S. Thomassen, S. F. Su, M. Piquette-Miller, and K. M. Giacomini. 1997. Functional and molecular characteristics of Na(+)-dependent nucleoside transporters. Pharm. Res. 14:1524-1532. [DOI] [PubMed] [Google Scholar]
- 50.Ward, J. L., A. Sherali, Z. P. Mo, and C. M. Tse. 2000. Kinetic and pharmacological properties of cloned human equilibrative nucleoside transporters, ENT1 and ENT2, stably expressed in nucleoside transporter-deficient PK15 cells. Ent2 exhibits a low affinity for guanosine and cytidine but a high affinity for inosine. J. Biol. Chem. 275:8375-8381. [DOI] [PubMed] [Google Scholar]


