Background: Metformin is widely believed to inhibit mitochondrial respiration.
Results: Metformin increased phosphocreatine recovery from dinitrophenol or azide in intact cells, increased MTT reduction, left ATP levels unchanged, and increased free AMP.
Conclusion: Metformin stimulated mitochondrial energy production.
Significance: Distinct mechanisms for metformin other than mitochondrial inhibition, such as the inhibition of breakdown of AMP proposed in our work, need to be pursued.
Keywords: AMP, AMP Kinase, AMP-activated kinase (AMPK), ATP, Cell Metabolism, Metabolic Regulation, Mitochondrial Metabolism
Abstract
A popular hypothesis for the action of metformin, the widely used anti-diabetes drug, is the inhibition of mitochondrial respiration, specifically at complex I. This is consistent with metformin stimulation of glucose uptake by muscle and inhibition of gluconeogenesis by liver. Yet, mitochondrial inhibition is inconsistent with metformin stimulation of fatty acid oxidation in both tissues. In this study, we measured mitochondrial energy production in intact cells adapting an in vivo technique of phosphocreatine (PCr) formation following energy interruption (“PCr recovery”) to cell cultures. Metformin increased PCr recovery from either dinitrophenol (DNP) or azide in L6 cells. We found that metformin alone had no effect on cell viability as measured by total ATP concentration, trypan blue exclusion, or 3-(4,5-dimethylthiazol-2-yl)-2,5-diphenyltetrazolium bromide reduction. However, treatments with low concentrations of DNP or azide reversibly decreased ATP concentration. Metformin increased 3-(4,5-dimethylthiazol-2-yl)-2,5-diphenyltetrazolium bromide reduction during recovery from either agent. Viability measured by trypan blue exclusion indicated that cells were intact under these conditions. We also found that metformin increased free AMP and, to a smaller extent, free ADP concentrations in cells, an action that was duplicated by a structurally unrelated AMP deaminase inhibitor. We conclude that, in intact cells, metformin can lead to a stimulation of energy formation, rather than an inhibition.
Introduction
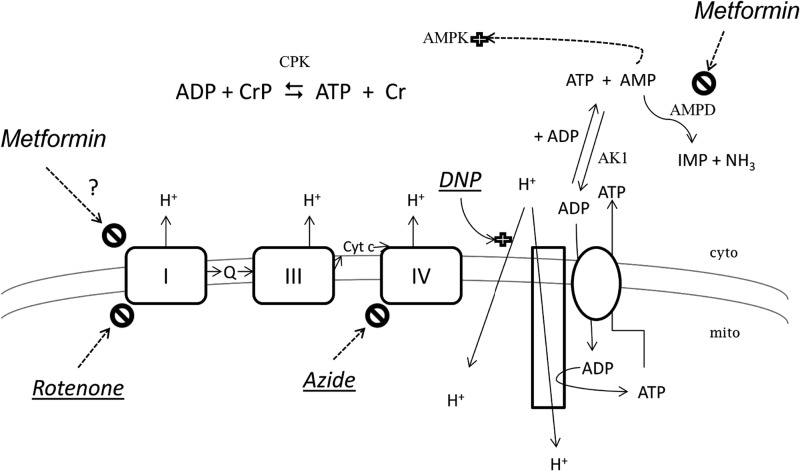
Several investigators have concluded that metformin depresses mitochondrial energy formation (1–6). Because metformin is known to activate the AMP-activated kinase (AMPK),3 a rise in AMP levels secondary to energy interruption might seem a reasonable conclusion (see Fig. 1). This is also suggested by the fact that muscle glucose uptake, stimulated when cells are energy-deprived, is also stimulated by AMPK activation and by metformin (7–10). Hepatic gluconeogenesis is inhibited by metformin (5), another event that has been explained as interruption of cellular energy formation. As further suggestive evidence, metformin inhibits electron transport of isolated mitochondria (3, 11).
FIGURE 1.
Metformin and mitochondrial energy formation. The three complexes of the mitochondrial (inner) membrane that form the proton gradient (I, III, and IV) are indicated, and two established inhibitors of electron flow are shown, rotenone and azide. DNP is shown as a stimulator of H+ entry to mitochondria (a proton ionophore), competing with the ATP synthetase (represented as a long rectangle) and thereby compromising mitochondrial (mito) ATP formation. The site of metformin action proposed by others but questioned here is complex I (indicated by a ?); the site we propose, AMPD, is also indicated. The requirement for the cytosolic (cyto) adenylate kinase (AK1) is indicated for AMP elevation under conditions in which ADP concentration rises. Also shown is the equilibrium for creatine phosphokinase (CPK). Enzymes are indicated by shaded letters; energy inhibitors are underlined and in italic type. Although drawn in separate reactions, the cytosolic adenine nucleotides ATP, ADP, and AMP comprise global pools.
Although these findings support the energy-interruption hypothesis of metformin action, there is evidence to the contrary. For example, the in vitro inhibition of mitochondria by metformin is small (about 10%), a result pointed out in a debate concerning the energy-interruption hypothesis (12–14). It is not established what effect metformin has on mitochondrial energy formation in intact cells. Furthermore, although stimulation of muscle glucose uptake (9) and inhibition of hepatic gluconeogenesis (5, 15) are consistent with this hypothesis, the well established stimulation of mitochondrial fatty acid oxidation (16, 17) is not. This fundamental inconsistency led our laboratory to propose an alternative mechanism for the action of metformin, namely the inhibition of AMP deaminase (16).
In this study, we found that metformin as well as a known AMPD inhibitor increased the free AMP and ADP concentrations in these cells, but neither affected the ATP contents of the L6 muscle cells. To more directly determine how metformin affects the mitochondria in intact cells, we adapted an established in vivo method (18, 19), the restoration of phosphocreatine (PCr) concentrations after mitochondrial energy interruption. We determined that metformin did not inhibit mitochondrial energy supply. Rather, metformin increased mitochondrial energy formation, consistent with metformin stimulation of fatty acid oxidation, as well as more current findings on metformin inhibition of gluconeogenesis (20, 21). The finding was further supported by an increased reduction of the tetrazolium salt MTT, and studies of cell viability indicated new considerations for the use of MTT, trypan blue, and ATP levels as indices of cell viability.
EXPERIMENTAL PROCEDURES
L6 cells were obtained from the American Type Culture Collection and incubated and prepared as in our previous work (16). Dulbecco's minimum essential media, α-minimum essential medium, and amino acids were obtained from Invitrogen. Cell cultures and flasks were obtained from Corning Inc. (Corning, NY). Quantilium® recombinant luciferase was obtained from Promega (Madison, WI). Sodium azide and 2,4-dinitrophenol were obtained from Sigma. All the other chemicals, including luciferin, ATP, phosphocreatine, creatine, and MTT were obtained from VWR Scientific (Philadelphia, PA).
After incubation with DNP or azide, cells were washed with 5% albumin solution and KH buffer prior to incubation in inhibitor-free incubation media (the recovery period). For the analysis of metabolites, media were removed, and cells were extracted with a lysis buffer containing 1% perchloric acid, 10 mm EDTA and 0.5% Triton X-100. After at least 20 min on ice, samples were neutralized with a solution containing 2 m KOH, 50 mm MOPS, and 2 mm EDTA. The luminometric measurement of ATP, PCr, and creatine and the calculation of free ADP and AMP values were performed by the method of Ronner et al. (22). Luminescence was measured with the Glomax Jr® luminometer (Promega). Lactate was measured by an enzymatic end point method using hydrazine (23). Trypan blue (0.2% w/v) was added to cells in a 1:1 volume, and the percentage viable (excluding dye) was estimated with a hemocytometer. 3-(4,5-Dimethylthiazol-2-yl)-2,5-diphenyltetrazolium bromide (MTT) concentration in the incubation was 4 mg/ml; absorbance was recorded in an HTS bioassay plate reader at 590 nm. Protein was analyzed by the bicinchoninic acid method (24).
Data are expressed as an average ± S.E. with at least n = 3. Statistical evaluation was done using Student's t test and one-way analysis of variance. The level of significance was set at p < 0.05.
RESULTS
ATP Contents in the Presence of DNP or Azide
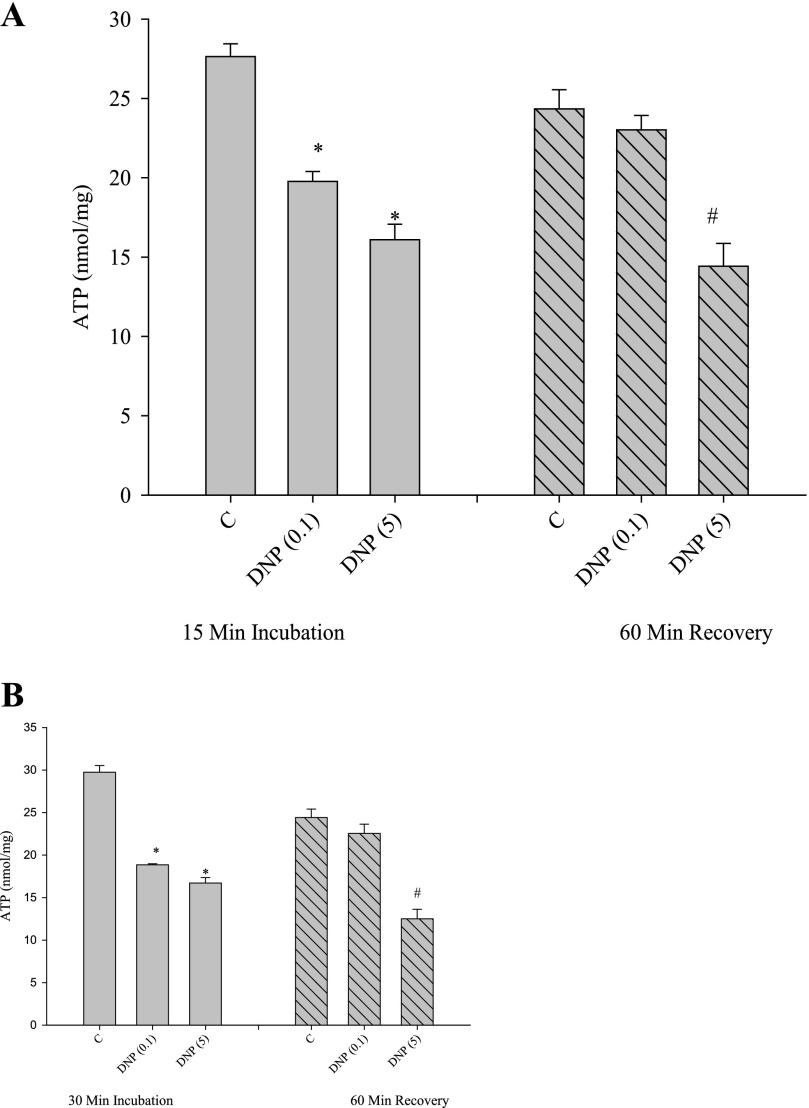
To establish conditions for phosphocreatine recovery, we first investigated the ability of cells to recover from incubation with known energy inhibitors, the uncoupler DNP, and the respiratory chain inhibitor azide. Our procedure was to add the inhibitor, remove it through a change in medium, and then conduct a further incubation, called the recovery. Both low (0.1 mm) and high (5 mm) DNP caused a decrease in total cellular ATP concentration after an incubation of 15 min (Fig. 2A). To initiate the recovery, cells were washed with an albumin-containing medium (to assist removal of the uncoupler), and the second incubation (the recovery) was continued for a further 60 min. As shown in Fig. 2A, cellular ATP levels were depressed in the first incubation and returned to control levels with low but not high concentrations of DNP. We conducted the same experiment, except with a 30-min incubation period (Fig. 2B). Apart from a slightly greater drop in ATP concentrations in the presence of DNP (compared with the 15 min of incubation), ATP levels recovered only when low (0.1 mm) DNP was used.
FIGURE 2.
Effects of DNP on ATP content of cells. Cells incubated for 15 min (A) or 30 min (B) with DNP (values in parentheses are in millimolar) were analyzed for total ATP contents as under “Experimental Procedures.” After incubation, DNP was removed, and a further 60-min incubation was conducted (“recovery”). *, p < 0.05 versus first incubation-control. #, p < 0.05 versus recovery period-control.
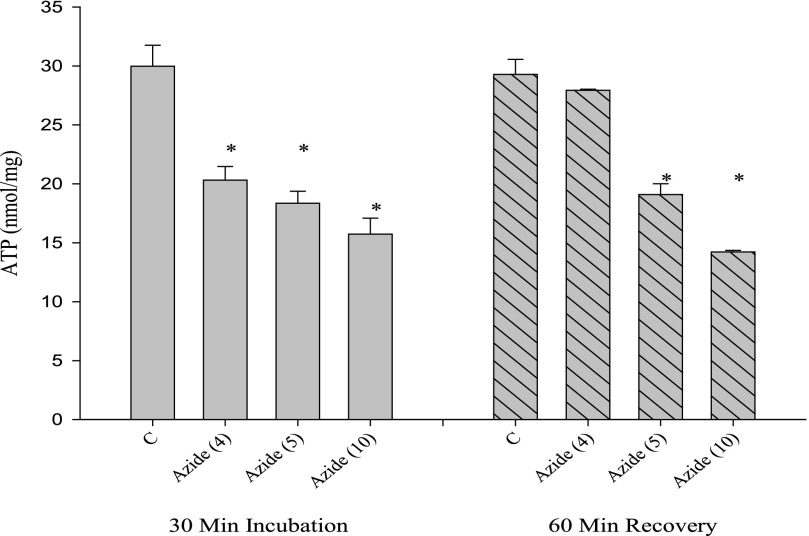
A similar result was obtained when azide was substituted for DNP (Fig. 3). Although ATP concentrations recovered from incubation with 4 mm azide, higher concentrations showed a sustained decrease in ATP levels after the recovery period.
FIGURE 3.
Effects of azide on ATP content of cells. Cells incubated for 30 min with azide (values in parentheses are in millimolar) were analyzed for total ATP contents. After incubation, azide was removed, and a further 60-min incubation was conducted (recovery). *, p < 0.05 versus appropriate control (first incubation or recovery period).
Cell Viability after DNP or Azide Incubation
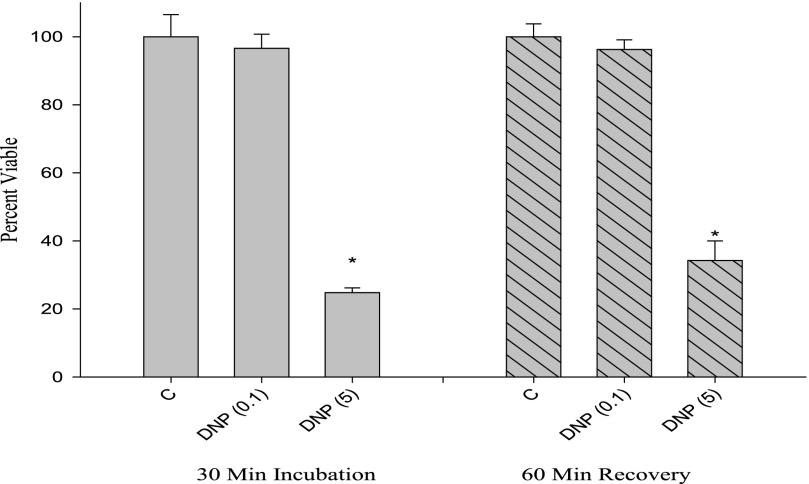
We tested cell viability using trypan blue exclusion under the same conditions used for the ATP measurements. As shown in Fig. 4, the low concentration of DNP did not affect trypan blue exclusion, despite the fact that this condition lowered ATP concentration (cf. Figs. 4 and 2B). After the recovery period, only the high concentration of DNP caused a decrease in viability assessed by trypan blue (Fig. 4).
FIGURE 4.
Cell viability response to DNP assessed with trypan blue dye exclusion. Cells were treated with DNP under similar conditions as those in Fig. 2, trypsinized, and counted with a hemocytometer. Viability was expressed as a percentage. *, p < 0.05 versus appropriate control (first incubation or recovery period).
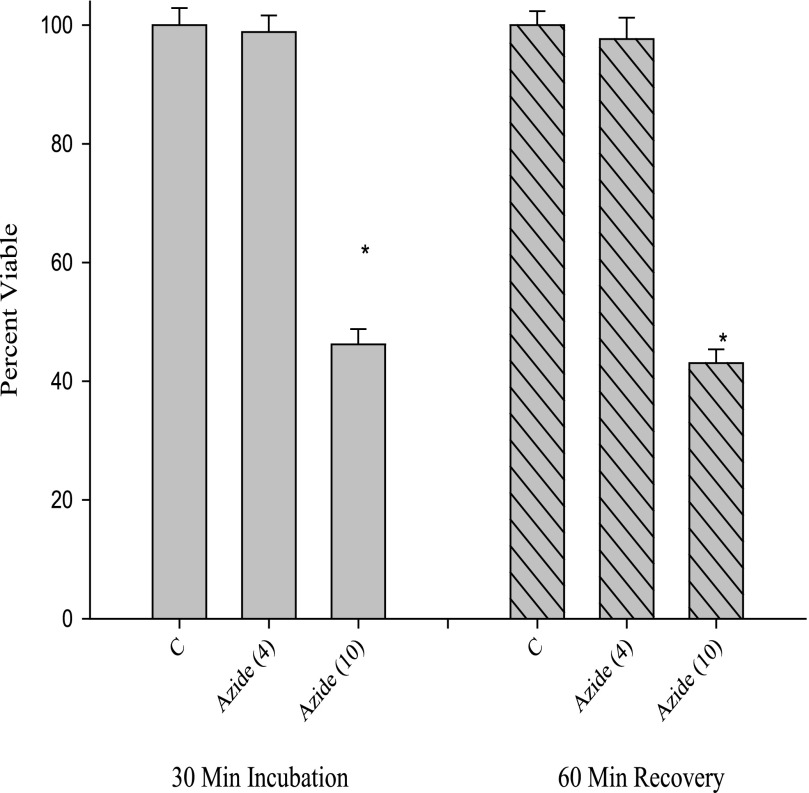
A similar result was obtained for azide; the lower concentration of azide that caused a decrease in ATP (Fig. 3) did not show a decrease in cell viability as measured by trypan blue (Fig. 5). At a high concentration of azide (10 mm), cell viability was reduced in both the first incubation and after the recovery period (cf. Figs. 4 and 5). Thus, the experiments to this point established incubation times and concentrations for reversibly diminishing ATP levels with two types of mitochondrial energy perturbants. Because the cells remained viable as determined by trypan blue exclusion, the studies establish control conditions to explore the recovery period after this energy perturbation.
FIGURE 5.
Cell viability response to azide assessed with trypan blue dye exclusion. Cells were treated with azide under similar conditions to those in Fig. 3, trypsinized, and counted with a hemocytometer. Viability was expressed as a percentage. *, p < 0.05 versus appropriate control (first incubation or recovery period).
PCr Recovery
The recovery of phosphocreatine from energy perturbation has been used as a measure of oxidative phosphorylation in muscle in vivo (18, 19). To establish this system for cell cultures, we measured the recovery of phosphocreatine concentrations using the conditions we established for reversible recovery from DNP and azide. The results for both DNP and azide are shown in Table 1. In the first incubation period, DNP lowered phosphocreatine levels compared with control in 15 min and was even further decreased at 30 min. A similar result was obtained with azide. Recovery from DNP was complete if the first incubation was carried out for 15 min and was partial if the first incubation was carried out for 30 min. The pattern was similar for azide, although in this case, even after 15 min of a first incubation with azide, phosphocreatine recovery was not complete; it was less so if the first incubation was conducted for 30 min.
TABLE 1.
Phosphocreatine recovery from DNP and azide
The upper rows represent data from the first incubation(First Inc), carried out at 15 or 30 min as indicated. When present, DNP was at 0.1 mm and azide at 4 mm. The recovery experiments were all conducted for 60 min, following either the 15 or 30 min first incubation. All values are phosphocreatine results in μmol/mg protein, means ± S.E.
| Condition | Control | DNP | Control | Azide |
|---|---|---|---|---|
| μmol/mg protein | μmol/mg protein | |||
| First Inc, 15 min | 13.3 ± 0.6 | 9.77 ± 0.43a | 12.3 ± 0.6 | 9.08 ± 0.31a |
| First Inc, 30 min | 13.4 ± 0.9 | 8.63 ± 0.58a | 12.3 ± 0.5 | 8.16 ± 0.50a |
| Recovery (from 15 min) | 13.6 ± 0.5 | 12.2 ± 0.3 | 13.7 ± 0.9 | 11.3 ± 0.6a |
| Recovery (from 30 min) | 13.2 ± 0.9 | 10.7 ± 0.7a | 12.9 ± 0.6 | 10.1 ± 0.3a |
a p < 0.05 versus control for DNP or azide.
Influence of Metformin on PCr Recovery
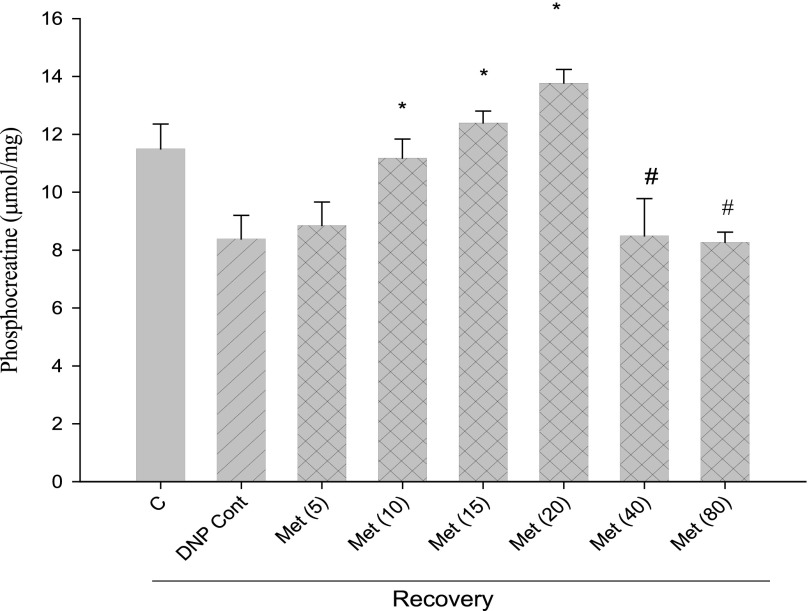
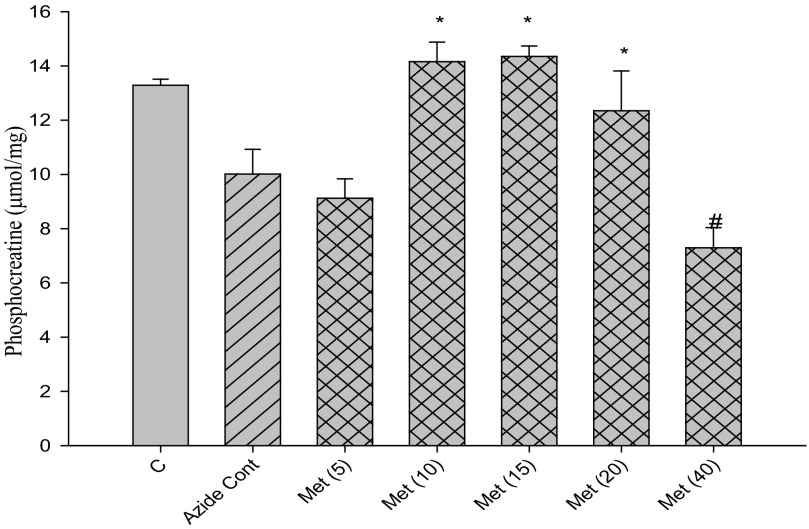
With conditions established to measure mitochondrial function by PCr recovery, we examined the influence of metformin at concentrations from 5 to 80 mm. Metformin stimulated PCr recovery when present at concentrations between 10 and 20 mm both in the case of recovery from DNP (Fig. 6) and from azide (Fig. 7). Higher concentrations of metformin led to a decline in PCr recovery from the peak stimulation by metformin (Figs. 6 and 7).
FIGURE 6.
Effects of metformin concentration on PCr recovery from DNP. Cells were incubated for 30 min with 0.1 mm DNP and subsequently incubated a further 60 min after removal of DNP (recovery). The 1st bar (C) represents control without DNP in the second incubation period. All other incubations had DNP alone (“DNP Cont,” single hatched bar) or with the additional presence of metformin (cross-hatched bars) at millimolar concentrations indicated in parentheses. *, p < 0.05 versus DNP control; #, p < 0.05 versus 20 mm metformin.
FIGURE 7.
Effects of metformin concentration on PCr recovery from azide. Cells were incubated for 30 min with 0.1 mm azide and subsequently incubated a further 60 min after removal of azide (recovery). The 1st bar (C) represents control without azide in the second incubation period. All other incubations had azide alone (“Azide Cont,” single hatched bar) or with the additional presence of metformin (cross-hatched bars) at millimolar concentrations indicated in parentheses. *, p < 0.05 versus DNP control; #, p < 0.05 versus 20 mm metformin.
A time course of the influence of metformin (15 mm) on PCr recovery is presented in Fig. 8. Both recovery from DNP (Fig. 8A) as well as recovery from azide (Fig. 8B) were stimulated over time by the presence of metformin. We did not observe a decrease in PCr recovery by metformin at any time point examined. As a control for the results of Fig. 8, we also measured phosphocreatine levels in response to metformin without a prior incubation with inhibitor. As expected, these levels rose in keeping with establishment of the equilibrium at creatine phosphokinase. However, the response was distinct from PCr recovery; at 30 and 60 min the increase was 14 and 6.5%.
FIGURE 8.
Time course of the influence of metformin on PCr recovery from DNP and azide. After 30 min of incubation with 0.1 mm DNP (left) or with 4 mm azide (right), the agent was removed from the media, and further incubation was continued up to 60 min. PCr was measured every 15 min. Metformin, present only during the recovery period, was added at 15 mm. Symbols are as follows: open circles, control preincubation; filled circles, preincubation with DNP or azide. *, p < 0.05 versus control.
Lactate Formation
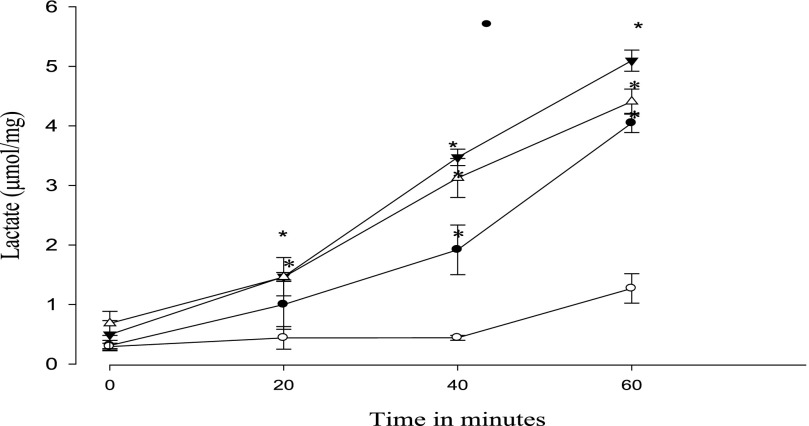
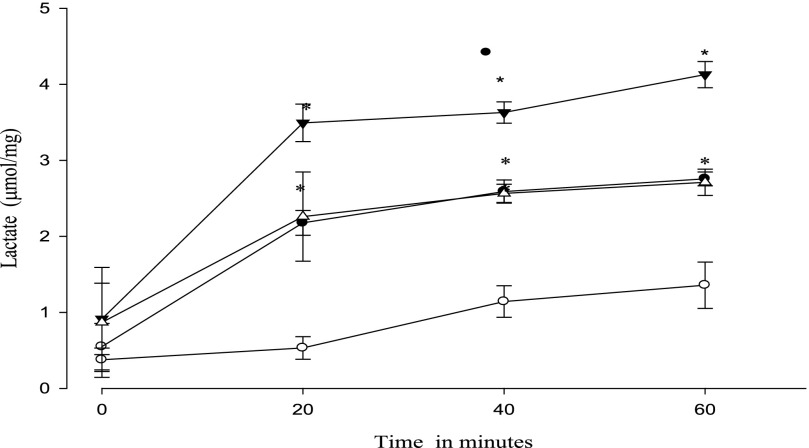
Lactate was measured as an index of glycolysis during recovery from DNP or azide treatment. The results for DNP are shown in Fig. 9. Metformin alone increased lactate formation over time as has been well established previously (7, 16). Pretreatment with DNP itself led to an increased lactate formation over the 60-min recovery period. The further addition of metformin during the recovery period did not alter lactate concentration compared with DNP alone. The same experiment performed with azide did show a greater lactate formation when metformin was present during the recovery period (Fig. 10).
FIGURE 9.
Effect of metformin on the time course of lactate formation during recovery from DNP. After 30 min of incubation with 0.1 mm DNP, lactate was measured at 20, 40, and 60 min. Data shown are from the recovery period. Symbols are as follows: open circles, control; filled circles, 15 mm metformin (present only during the recovery period); open triangles, 0.1 mm DNP; filled triangles, both metformin and DNP added. *, p < 0.05 versus control.
FIGURE 10.
Effect of metformin on the time course of lactate formation during recovery from azide. After 30 min of incubation with 4 mm azide, lactate was measured at 20, 40, and 60 min. Data shown are from the recovery period; when added, metformin was only present during the recovery period. Symbols are as follows: open circles, control; filled circles, 15 mm metformin; open triangles, 4 mm azide; filled triangles, both metformin and azide added. *, p < 0.05 versus control.
MTT Assay
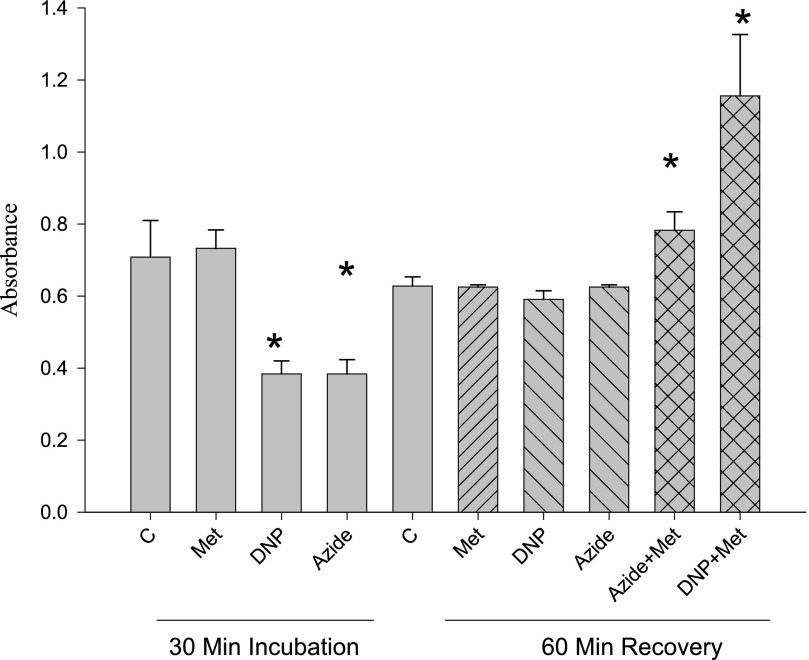
The tetrazolium salt MTT is commonly used as a measurement of cell viability as electrons are transferred from the electron transport chain, reducing the tetrazolium salt to a colored formazan (25–28). Thus, an increased rate of reduction (absorbance) is commonly taken as an increase in cellular viability. As shown in Fig. 11, metformin alone did not affect MTT reduction during the incubation or the recovery period. DNP or azide alone depressed MTT reduction during the incubation period, but MTT reduction returned to control levels during the recovery period (when the inhibitors were removed). When metformin was present during recovery from either azide or DNP, MTT reduction increased significantly beyond the control levels. This effect was quantitatively greater during recovery from DNP than with azide.
FIGURE 11.
Effects of metformin, DNP, and azide on MTT reduction. MTT reduction was measured during both a 30-min incubation and a 60-min recovery period after removal of DNP (0.1 mm) or azide (4 mm). Metformin, present only during the recovery period, was added at 15 mm concentration. *, p < 0.05 versus corresponding control (incubation or recovery).
Adenine Nucleotide Contents in Response to Metformin and EHNA
Because direct measurements of cellular ADP and AMP contents do not reflect the small fraction of free, metabolically available concentrations of these nucleotides, we used indicator reactions to estimate their free concentrations. The near-equilibrium properties of creatine phosphokinase and adenylate kinase in muscle cells permit these measurements (29, 30). Using this technique, we found that both metformin and the AMP deaminase inhibitor EHNA increased ADP modestly and AMP substantially (Table 2). No effect of metformin on ATP concentration was observed.
TABLE 2.
Analysis of cellular ATP, ADP, and AMP
L6 cells were incubated 45 min. Metformin when present was 15 mm; EHNA was present at 100 μm.
| Addition | ATP | ADP | AMP |
|---|---|---|---|
| nmol/mg protein | |||
| Control | 24 ± 1.2 | 0.76 ± 0.05 | 0.024 ± 0.002 |
| Metformin | 24 ± 1.7 | 1.14 ± 0.09a | 0.053 ± 0.006a |
| EHNA | 24 ± 2.1 | 1.39 ± 0.13a | 0.081 ± 0.009a |
a p < 0.05 versus corresponding control value.
DISCUSSION
The hypothesis that metformin (as well the biguanine of similar structure, phenformin) acts by inhibition of mitochondrial energy formation was formulated over 50 years ago (31), with most studies on its proposed mechanism (complex I of the respiratory chain) using isolated mitochondria or permeabilized cells (3–5, 32). The other evidence that is used to suggest that metformin inhibits mitochondrial respiration arises from interpretations of metabolic pathway results in cells, mostly liver and muscle. Metformin inhibits gluconeogenesis in liver (5) and stimulates glycolysis and glucose transport in muscle (33). Because metformin acts to increase energy provision by cells through the activation of AMPK, these observations would be consistent with the idea that metformin might block mitochondria, lower ATP, and increase the concentration of ADP and subsequently that of AMP (the latter due to the near-equilibrium nature of adenylate kinase). ATP, ADP, and AMP are all allosteric effectors of AMPK, and the changes suggested would be in the right direction to activate it.
The process of fatty acid oxidation is stimulated by metformin in both liver and muscle (10, 17, 34). Fatty acid oxidation produces NADH and QH2, mobile cofactors that must be regenerated in order for fatty acid to proceed (16). If complex I is inhibited, reoxidation of these cofactors is blocked, as demonstrated by the use of rotenone, a known complex I inhibitor (16). This is at odds with the hypothesis that the metformin mechanism involves inhibition of complex I. The purpose of this study was to address the question of how metformin does affect mitochondrial energy production by assessing this parameter in intact cells, using the method of phosphocreatine recovery. The finding that mitochondrial energy production is stimulated is consistent with all known metabolic actions of metformin.
Mitochondrial Inhibitor Studies
A large number of mitochondrial inhibitors activate AMPK, as summarized in a review in 2004 (35). These include the two used in this study, azide (representing the class of respiratory chain blockers) and DNP (representing the class of uncouplers). Because metformin also activates AMPK, many investigators have drawn the conclusion that mitochondrial inhibitors and metformin share the same mechanism. Following the interruption of mitochondrial energy production, it is a reasonable interpretation that cellular AMP increases and causes the observed AMP activation. If metformin inhibited energy production, then it should mimic mitochondrial poisons like those used here, and ATP levels would decline. However, as we show in this study, metformin caused an increase in free ADP concentration and a greater increase in free AMP concentration with no change in ATP levels. A simple resolution of these findings would be separate mechanisms of AMPK activation as follows: one through direct energy inhibition, which accounts for the array of mitochondrial poisons (35), and a separate one for metformin.
Cell Viability
Because mitochondrial inhibition is a proposed means of metformin action, and also because we used mitochondrial poisons in the PCr recovery method, it was important to consider cell viability. We found that both DNP and azide depress total cellular ATP levels, but (with empirically determined concentrations and exposure times) the levels of ATP returned to control after the inhibitors were removed. Higher concentrations or exposure times led to an irreversible decline in ATP levels, suggesting a loss of cell viability. Cornell (36) considered measurement of total ATP concentration the best means of measuring cell viability. This must be modified somewhat to account for our finding that cell ATP levels can decline transiently but recover. Thus, when either uncoupler or azide is present, the cells are unable to maintain their ATP levels, but they remain viable as shown by the return of control ATP concentrations after removal of the inhibitors. Because a decrease in ATP constitutes an exception to the use of ATP as a strict viability assay (37), we considered alternatives.
Trypan blue was excluded from cells even during the first incubation with the inhibitors, supporting the notion that cells remained intact under these conditions. Still, trypan blue dye exclusion has been criticized as being less sensitive than other methods (36, 37), so we examined a third technique, the reduction of MTT (3, 38).
Although most of our findings showed similar cell viability results with MTT, we observed an increased MTT reduction in the presence of metformin during the recovery period. This must not be a measure of cell viability, as MTT reduction exceeded 100%. It is likely that because MTT accepts electrons from mitochondria; it is actually a measure of the rate of mitochondrial electron transport, a distinct process from cell viability. An increased electron transport by mitochondria, indicated by MTT reduction, is consistent with our finding that PCr recovery was increased by metformin. Thus, the MTT result provides an independent measure of an increase in mitochondrial electron transport induced by metformin.
Phosphocreatine Recovery
As the previous studies examining the effect of metformin on mitochondria have used only isolated mitochondria or detergent-permeabilized cells, we measured phosphocreatine recovery, which can be conducted in intact cells. The ability of cells to form phosphocreatine after interruption of mitochondrial energy has been established for muscle in vivo (18, 19). The adaptation for cell culture required a means of rapid and reversible interruption of mitochondria. As this could not be easily accomplished by altering the gas composition, we used limited exposure of two distinct inhibitors of mitochondria as follows: the electron transfer blocker azide and the uncoupler DNP. We found similar results for both inhibitors. The formation of lactate, as was the case in the studies of in vivo PCr recovery (18, 19), did not account for the rephosphorylation of creatine. This was especially clear with DNP, as lactate did not accumulate in the presence of metformin beyond that of DNP alone.
It is of interest that phosphocreatine is also used as part of the near-equilibrium indicator system to measure ADP and AMP and that metformin causes increases in phosphocreatine levels by itself. However, the levels of phosphocreatine do not steadily rise with time; rather, they decline after a 30-min period relative to control. Thus, PCr recovery reflects a steady increase in the levels of phosphocreatine as more ATP is restored to the cells, whereas in the absence of inhibitors, phosphocreatine adjusts to its equilibrium point between cellular ATP, ADP, and creatine.
If metformin was a mitochondrial respiration inhibitor, ATP levels would fall, and the PCr recovery would be impaired; and phosphocreatine levels would decline. None of these events were observed.
Metformin Concentration
The ranges of metformin concentrations used in these studies and in our previous one (16) are higher than those used clinically (39). However, titrations showed the concentrations used in our studies of L6 cells were those needed to elicit the expected physiological actions of metformin (e.g. glucose uptake and fatty acid oxidation stimulation). Similar concentrations were used by other investigators as well. A wide range of metformin concentrations was studied by Otto et al. (40) in hepatocytes, who showed that millimolar concentrations (1–50 mm) were needed for immediate effects in cells but that lower concentrations (500 μm and less) were effective if cells were incubated for 24 h. Thus, like most drugs, there is an interdependence between time and concentration for effectiveness. It is also of interest that the same high concentrations of metformin were necessary to demonstrate the inhibition of mitochondrial complex I (41), and these were in broken cell preparations. 10 mm metformin caused less than 10% inhibition of complex I (40). As demonstrated in this study, neither ATP concentrations nor trypan blue exclusion was affected by this concentration of metformin. It is true that concentrations of agents added in experiments are critical; however, they must be correlated to a cellular function for in vitro testing, such as glucose uptake or fatty acid oxidation.
Logic of Metformin Actions
A logical principle describing metformin actions (42) is that it enhances pathways that produce cellular energy and decreases pathways that utilize cellular energy. This is consistent with the known action of metformin in vivo as a widely used drug that causes weight loss, rather than the weight gain attendant upon many diabetes medications (43). However, the notion that inhibition of mitochondrial complex I is a site of metformin action is not consistent with this logic. Blocking mitochondrial energy formation impairs the most significant energy provision pathway in the cell.
Indeed, if the observed decrease in gluconeogenesis was the result of a primary drop in ATP, it would not be preserving cellular energy but rather secondarily inhibiting that pathway due to a lack of ATP to support it. In fact, most studies have shown that gluconeogenesis is regulated in the long term by suppression of the expression of key gluconeogenic enzymes (20, 21, 45, 46). Thus, it is not the diminution of ATP that decreases gluconeogenesis but rather the decrease in enzyme expression.
It may be argued that an equivalent activity of metformin increasing energy-producing pathways is the inhibition of energy-consuming pathways (i.e. metformin inhibits hepatic gluconeogenesis). However, inhibition of energy-consuming pathways would lead to less mitochondrial activity, rather than more. If this were the predominant action of metformin, then we would expect to observe a decreased PCr recovery as mitochondria would respond to the new situation of reduced energy demand.
The known increase in fatty acid oxidation is also not possible if mitochondrial electron transport was inhibited by metformin. NAD+ needed for fatty acid oxidation would be unavailable if complex I was inhibited. We showed previously that even a modest inhibition of complex I by low concentrations of rotenone still inhibited fatty acid oxidation (16). Short term stimulation of fatty acid oxidation is mechanistically the best understood of the actions of metformin, acting through acetyl-CoA carboxylase inhibition, a decrease in malonyl-CoA, and subsequently increased fatty acid entry to the mitochondria (47). It is possible to construe a mechanism for complex I inhibition by signals generated by a small inhibition that leads to increased mitochondria and increased mitochondrial synthesis (48), which will support a greater fatty acid oxidation. However, this mechanism requires a short term inhibition of fatty acid oxidation, which is the opposite of what is found. Not only that, if mitochondrial biogenesis was the only reason for stimulating fatty acid oxidation, once mitochondria restored the hypothesized small inhibition, the signal for sustaining the increase in mitochondria would be eliminated. Thus, no increase in fatty acid oxidation can be rationalized by a mechanism that inhibits mitochondrial energy production.
The interpretation of metformin increasing lactate formation due to mitochondrial inhibition is similar to the original explanation of the Warburg effect. In cancer cells, the increased lactate production led Warburg to propose that proliferating cells had defective mitochondria (49). However, it is now clear that proliferating cells and many cancer cells have functioning mitochondria; the increased glycolysis serves pathways connected to glycolysis that are needed to supply materials for rapidly growing cells (50). In addition, we found no change in total cellular ATP and that the increase in lactate was insufficient to account for the increased PCr formed during the recovery period.
AMPK-independent Actions of Metformin
We have previously proposed that inhibition of AMPD could serve as a target of metformin, explaining the increase in AMP without changes in ATP and consistent with all known metabolic actions of metformin, including AMPK activation (16). This hypothesis has received some support (51). As we show here, direct inhibition of AMPD by the inhibitor EHNA replicates the effect of metformin on the adenine nucleotides. However, others have proposed that metformin may act through an AMPK-independent means.
Foretz et al. (52) suggested that metformin acts through a decrease in cellular energy production, independently of AMPK. However, the response to metformin required several hours and was associated with not only a rise in the ratio of total AMP/ATP but a metformin-induced loss in total adenine nucleotides. It is possible that loss of cell viability occurred under the conditions of that study. Notably, the investigators observed that a knock-out of AMPK led to a greater loss of ATP. This was also observed in a later study by the same investigators (53), which more specifically aimed to demonstrate that metformin activates AMPK by inhibiting respiration at complex I. Here, too, ablation of AMPK enhanced the loss of ATP and the rise in total AMP. Buler et al. (54) also demonstrated that AMPK ablation led to a greater metformin-dependent loss in cellular ATP. These investigators also showed that metformin led to an increase in mitochondrial biogenesis and proposed this as a “decompensation mechanism” from the lost ATP production. The metformin-induced decompensation, however, is inconsistent with inhibiting mitochondrial energy formation.
Bruckbauer and Zurkel (55) recently observed an increased oxygen uptake by C2C12 cells within minutes of exposure to metformin, and argued against respiratory inhibition by this drug. Similarly, two recent reports (56, 57) have shown that metformin suppresses oxygen radical formation by cell cultures, again suggesting a stimulation of mitochondrial respiration rather than an inhibition.
In keeping with the well established finding that ATP levels are constant in cells, the fact that alterations can occur in isolated cell systems may be attributed to either a long term alteration in the cell or a loss in viability. Indeed, a drop in cellular ATP is taken as an index of cell viability (36).
This study does not resolve the question of whether metformin requires AMPK for all of its actions. An AMPK-independent action of metformin (58) in muscle has been reported, although in this case, an alternative AMP-activated and LKB-dependent protein kinase (SNARK) was shown to be involved. What this study does suggest is that metformin does not act through an inhibition of mitochondria. The further evidence of a rise in AMP and of ADP in those studies (52, 53, 59) is also misleading, as the measurement represents total rather than free concentrations of these nucleotides. It is known that both ADP and AMP are largely bound to proteins within cells; estimates of their free concentrations require near-equilibrium analysis (44).
In conclusion, three experimental findings counter the belief that metformin can decrease cellular ATP. First, direct analysis of ATP levels indicated no change in this nucleotide over the short term course of metformin incubation. The levels of free ADP and AMP increased, showing that a mechanism apart from the breakdown of ATP is likely responsible for the large increase in free AMP subsequent to metformin. Second, the metformin-induced increased reduction of MTT following challenge of cells with either DNP or azide demonstrates that electron flow in mitochondria increased rather than decreased in the presence of metformin. Third, PCr recovery increased following metformin treatment, whether recovery was from uncoupling (DNP) or inhibition of mitochondrial electron flow (azide). This evidence is consistent with the established metabolic actions of metformin, in particular the stimulation of fatty acid oxidation in both liver and muscle cells. It is also consistent with long known observations that ATP levels do not change during normal cell metabolism, even in rapidly contracting muscle.
Footnotes
- AMPK
- AMP-activated kinase
- PCr
- phosphocreatine
- DNP
- dinitrophenol
- EHNA
- erythro-9-(2-hydroxy-3-nonyl)adenine
- MTT
- 3-(4,5-dimethylthiazol-2-yl)-2,5-diphenyltetrazolium bromide
- AMPD
- AMP deaminase.
REFERENCES
- 1. Ben Sahra I., Laurent K., Giuliano S., Larbret F., Ponzio G., Gounon P., Le Marchand-Brustel Y., Giorgetti-Peraldi S., Cormont M., Bertolotto C., Deckert M., Auberger P., Tanti J. F., Bost F. (2010) Targeting cancer cell metabolism: the combination of metformin and 2-deoxyglucose induces p53-dependent apoptosis in prostate cancer cells. Cancer Res. 70, 2465–2475 [DOI] [PubMed] [Google Scholar]
- 2. Brunmair B., Staniek K., Gras F., Scharf N., Althaym A., Clara R., Roden M., Gnaiger E., Nohl H., Waldhäusl W., Fürnsinn C. (2004) Thiazolidinediones, like metformin, inhibit respiratory complex I: a common mechanism contributing to their antidiabetic actions? Diabetes 53, 1052–1059 [DOI] [PubMed] [Google Scholar]
- 3. Carvalho C., Correia S., Santos M. S., Seiça R., Oliveira C. R., Moreira P. I. (2008) Metformin promotes isolated rat liver mitochondria impairment. Mol. Cell. Biochem. 308, 75–83 [DOI] [PubMed] [Google Scholar]
- 4. El-Mir M. Y., Nogueira V., Fontaine E., Avéret N., Rigoulet M., Leverve X. (2000) Dimethylbiguanide inhibits cell respiration via an indirect effect targeted on the respiratory chain complex I. J. Biol. Chem. 275, 223–228 [DOI] [PubMed] [Google Scholar]
- 5. Owen M. R., Doran E., Halestrap A. P. (2000) Evidence that metformin exerts its anti-diabetic effects through inhibition of complex 1 of the mitochondrial respiratory chain. Biochem. J. 348, 607–614 [PMC free article] [PubMed] [Google Scholar]
- 6. Hawley S. A., Ross F. A., Chevtzoff C., Green K. A., Evans A., Fogarty S., Towler M. C., Brown L. J., Ogunbayo O. A., Evans A. M., Hardie D. G. (2010) Use of cells expressing γ subunit variants to identify diverse mechanisms of AMPK activation. Cell Metab. 11, 554–565 [DOI] [PMC free article] [PubMed] [Google Scholar]
- 7. Bailey C. J. (1992) Biguanides and NIDDM. Diabetes Care 15, 755–772 [DOI] [PubMed] [Google Scholar]
- 8. Hundal H. S., Ramlal T., Reyes R., Leiter L. A., Klip A. (1992) Cellular mechanism of metformin action involves glucose transporter translocation from an intracellular pool to the plasma membrane in L6 muscle cells. Endocrinology 131, 1165–1173 [DOI] [PubMed] [Google Scholar]
- 9. Klip A., Gumà A., Ramlal T., Bilan P. J., Lam L., Leiter L. A. (1992) Stimulation of hexose transport by metformin in L6 muscle cells in culture. Endocrinology 130, 2535–2544 [DOI] [PubMed] [Google Scholar]
- 10. Zhou G., Myers R., Li Y., Chen Y., Shen X., Fenyk-Melody J., Wu M., Ventre J., Doebber T., Fujii N., Musi N., Hirshman M. F., Goodyear L. J., Moller D. E. (2001) Role of AMP-activated protein kinase in mechanism of metformin action. J. Clin. Invest. 108, 1167–1174 [DOI] [PMC free article] [PubMed] [Google Scholar]
- 11. Guigas B., Detaille D., Chauvin C., Batandier C., De Oliveira F., Fontaine E., Leverve X. (2004) Metformin inhibits mitochondrial permeability transition and cell death: a pharmacological in vitro study. Biochem. J. 382, 877–884 [DOI] [PMC free article] [PubMed] [Google Scholar]
- 12. Hoek J. B. (2006) Metformin and the fate of fat. Gastroenterology 130, 2234–2237 [DOI] [PubMed] [Google Scholar]
- 13. Hoek J. B. (2006) Author reply. Gastroenterology 131, 974–975 [DOI] [PubMed] [Google Scholar]
- 14. Hardie D. G. (2006) Neither LKB1 nor AMPK are the direct targets of metformin. Gastroenterology 131, 973–975 [DOI] [PubMed] [Google Scholar]
- 15. Silva F. M., da Silva M. H., Bracht A., Eller G. J., Constantin R. P., Yamamoto N. S. (2010) Effects of metformin on glucose metabolism of perfused rat livers. Mol. Cell. Biochem. 340, 283–289 [DOI] [PubMed] [Google Scholar]
- 16. Ouyang J., Parakhia R. A., Ochs R. S. (2011) Metformin activates AMP kinase through inhibition of AMP deaminase. J. Biol. Chem. 286, 1–11 [DOI] [PMC free article] [PubMed] [Google Scholar]
- 17. Misra P. (2008) AMP activated protein kinase: a next generation target for total metabolic control. Expert Opin. Ther. Targets 12, 91–100 [DOI] [PubMed] [Google Scholar]
- 18. Blei M. L., Conley K. E., Kushmerick M. J. (1993) Separate measures of ATP utilization and recovery in human skeletal muscle. J. Physiol. 465, 203–222 [DOI] [PMC free article] [PubMed] [Google Scholar]
- 19. Haseler L. J., Hogan M. C., Richardson R. S. (1999) Skeletal muscle phosphocreatine recovery in exercise-trained humans is dependent on O2 availability. J. Appl. Physiol. 86, 2013–2018 [DOI] [PubMed] [Google Scholar]
- 20. He L., Sabet A., Djedjos S., Miller R., Sun X., Hussain M. A., Radovick S., Wondisford F. E. (2009) Metformin and insulin suppress hepatic gluconeogenesis through phosphorylation of CREB-binding protein. Cell 137, 635–646 [DOI] [PMC free article] [PubMed] [Google Scholar]
- 21. Caton P. W., Nayuni N. K., Kieswich J., Khan N. Q., Yaqoob M. M., Corder R. (2010) Metformin suppresses hepatic gluconeogenesis through induction of SIRT1 and GCN5. J. Endocrinol. 205, 97–106 [DOI] [PubMed] [Google Scholar]
- 22. Ronner P., Friel E., Czerniawski K., Fränkle S. (1999) Luminometric assays of ATP, phosphocreatine, and creatine for estimation of free ADP and free AMP. Anal. Biochem. 275, 208–216 [DOI] [PubMed] [Google Scholar]
- 23. Ochs R. S., Harris R. A. (1978) Studies on the relationship between glycolysis, lipogenesis, gluconeogenesis, and pyruvate kinase activity of rat and chicken hepatocytes. Arch. Biochem. Biophys. 190, 193–201 [DOI] [PubMed] [Google Scholar]
- 24. Smith P. K., Krohn R. I., Hermanson G. T., Mallia A. K., Gartner F. H., Provenzano M. D., Fujimoto E. K., Goeke N. M., Olson B. J., Klenk D. C. (1985) Measurement of protein using bicinchoninic acid. Anal. Biochem. 150, 76–85 [DOI] [PubMed] [Google Scholar]
- 25. Berridge M. V., Herst P. M., Tan A. S. (2005) Tetrazolium dyes as tools in cell biology: new insights into their cellular reduction. Biotechnol. Annu. Rev. 11, 127–152 [DOI] [PubMed] [Google Scholar]
- 26. Calabro A. R., Konsoula R., Barile F. A. (2008) Evaluation of in vitro cytotoxicity and paracellular permeability of intact monolayers with mouse embryonic stem cells. Toxicol. In Vitro 22, 1273–1284 [DOI] [PMC free article] [PubMed] [Google Scholar]
- 27. Janjic D., Wollheim C. B. (1992) Islet cell metabolism is reflected by the MTT (tetrazolium) colorimetric assay. Diabetologia 35, 482–485 [DOI] [PubMed] [Google Scholar]
- 28. Petty R. D., Sutherland L. A., Hunter E. M., Cree I. A. (1995) Comparison of MTT and ATP-based assays for the measurement of viable cell number. J. Biolumin. Chemilumin. 10, 29–34 [DOI] [PubMed] [Google Scholar]
- 29. Wiseman R. W., Kushmerick M. J. (1995) Creatine kinase equilibration follows solution thermodynamics in skeletal muscle. 31P NMR studies using creatine analogs. J. Biol. Chem. 270, 12428–12438 [DOI] [PubMed] [Google Scholar]
- 30. Veech R. L., Lawson J. W., Cornell N. W., Krebs H. A. (1979) Cytosolic phosphorylation potential. J. Biol. Chem. 254, 6538–6547 [PubMed] [Google Scholar]
- 31. Pressman B. C. (1963) The effects of guanidine and alkylguanidines on the energy transfer reactions of mitochondria. J. Biol. Chem. 238, 401–409 [Google Scholar]
- 32. Schäfer G., Bojanowski D. (1972) Interaction of biguanides with mitochondrial and synthetic membranes. Eur. J. Biochem. 27, 364–375 [DOI] [PubMed] [Google Scholar]
- 33. Musi N. (2006) AMP-activated protein kinase and type 2 diabetes. Curr. Med. Chem. 13, 583–589 [DOI] [PubMed] [Google Scholar]
- 34. Misra P., Chakrabarti R. (2007) The role of AMP kinase in diabetes. Indian J. Med. Res. 125, 389–398 [PubMed] [Google Scholar]
- 35. Hardie D. G. (2004) The AMP-activated protein kinase pathway–new players upstream and downstream. J. Cell Sci. 117, 5479–5487 [DOI] [PubMed] [Google Scholar]
- 36. Cornell N. W. (1983) in Isolation, Characterization, and Use of Hepatocytes (Harris R. A., Cornell N. W., eds) pp. 11–20, Elsevier Biomedical, New York [Google Scholar]
- 37. Baur H., Kasperek S., Pfaff E. (1975) Criteria of viability of isolated liver cells. Hoppe-Seyler's Z. Physiol. Chem. 356, 827–838 [DOI] [PubMed] [Google Scholar]
- 38. Janjetovic K., Vucicevic L., Misirkic M., Vilimanovich U., Tovilovic G., Zogovic N., Nikolic Z., Jovanovic S., Bumbasirevic V., Trajkovic V., Harhaji-Trajkovic L. (2011) Metformin reduces cisplatin-mediated apoptotic death of cancer cells through AMPK-independent activation of Akt. Eur. J. Pharmacol. 651, 41–50 [DOI] [PubMed] [Google Scholar]
- 39. Hardie D. G., Ross F. A., Hawley S. A. (2012) AMPK: a nutrient and energy sensor that maintains energy homeostasis. Nat. Rev. Mol. Cell Biol. 13, 251–262 [DOI] [PMC free article] [PubMed] [Google Scholar]
- 40. Otto M., Breinholt J., Westergaard N. (2003) Metformin inhibits glycogen synthesis and gluconeogenesis in cultured rat hepatocytes. Diabetes Obes. Metab. 5, 189–194 [DOI] [PubMed] [Google Scholar]
- 41. Hawley S. A., Gadalla A. E., Olsen G. S., Hardie D. G. (2002) The antidiabetic drug metformin activates the AMP-activated protein kinase cascade via an adenine nucleotide-independent mechanism. Diabetes 51, 2420–2425 [DOI] [PubMed] [Google Scholar]
- 42. Walker J., Jijon H. B., Diaz H., Salehi P., Churchill T., Madsen K. L. (2005) 5-Aminoimidazole-4-carboxamide riboside (AICAR) enhances GLUT2-dependent jejunal glucose transport: a possible role for AMPK. Biochem. J. 385, 485–491 [DOI] [PMC free article] [PubMed] [Google Scholar]
- 43. Stumvoll M., Häring H. U., Matthaei S. (2007) Metformin. Endocr. Res. 32, 39–57 [DOI] [PubMed] [Google Scholar]
- 44. Bridger W. A., Henderson J. F. (1983) Cell ATP, Wiley Interscience, John Wiley and Sons, New York [Google Scholar]
- 45. Morioka K., Nakatani K., Matsumoto K., Urakawa H., Kitagawa N., Katsuki A., Hori Y., Gabazza E. C., Yano Y., Nishioka J., Nobori T., Sumida Y., Adachi Y. (2005) Metformin-induced suppression of glucose-6-phosphatase expression is independent of insulin signaling in rat hepatoma cells. Int. J. Mol. Med. 15, 449–452 [PubMed] [Google Scholar]
- 46. Yuan L., Ziegler R., Hamann A. (2002) Inhibition of phosphoenolpyruvate carboxykinase gene expression by metformin in cultured hepatocytes. Chin. Med. J. 115, 1843–1848 [PubMed] [Google Scholar]
- 47. Zang M., Zuccollo A., Hou X., Nagata D., Walsh K., Herscovitz H., Brecher P., Ruderman N. B., Cohen R. A. (2004) AMP-activated protein kinase is required for the lipid-lowering effect of metformin in insulin-resistant human HepG2 cells. J. Biol. Chem. 279, 47898–47905 [DOI] [PubMed] [Google Scholar]
- 48. Suwa M., Egashira T., Nakano H., Sasaki H., Kumagai S. (2006) Metformin increases the PGC-1α protein and oxidative enzyme activities possibly via AMPK phosphorylation in skeletal muscle in vivo. J. Appl. Physiol. 101, 1685–1692 [DOI] [PubMed] [Google Scholar]
- 49. Warburg O. (1956) On respiratory impairment in cancer cells. Science 124, 269–270 [PubMed] [Google Scholar]
- 50. Vander Heiden M. G., Cantley L. C., Thompson C. B. (2009) Understanding the Warburg effect: the metabolic requirements of cell proliferation. Science 324, 1029–1033 [DOI] [PMC free article] [PubMed] [Google Scholar]
- 51. Lanaspa M. A., Cicerchi C., Garcia G., Li N., Roncal-Jimenez C. A., Rivard C. J., Hunter B., Andrés-Hernando A., Ishimoto T., Sánchez-Lozada L. G., Thomas J., Hodges R. S., Mant C. T., Johnson R. J. (2012) Counteracting roles of AMP deaminase and AMP kinase in the development of fatty liver. PloS One 7, e48801. [DOI] [PMC free article] [PubMed] [Google Scholar]
- 52. Foretz M., Hébrard S., Leclerc J., Zarrinpashneh E., Soty M., Mithieux G., Sakamoto K., Andreelli F., Viollet B. (2010) Metformin inhibits hepatic gluconeogenesis in mice independently of the LKB1/AMPK pathway via a decrease in hepatic energy state. J. Clin. Invest. 120, 2355–2369 [DOI] [PMC free article] [PubMed] [Google Scholar]
- 53. Stephenne X., Foretz M., Taleux N., van der Zon G. C., Sokal E., Hue L., Viollet B., Guigas B. (2011) Metformin activates AMP-activated protein kinase in primary human hepatocytes by decreasing cellular energy status. Diabetologia 54, 3101–3110 [DOI] [PMC free article] [PubMed] [Google Scholar]
- 54. Buler M., Aatsinki S. M., Izzi V., Hakkola J. (2012) Metformin reduces hepatic expression of SIRT3, the mitochondrial deacetylase controlling energy metabolism. PloS One 7, e49863. [DOI] [PMC free article] [PubMed] [Google Scholar]
- 55. Bruckbauer A., Zemel M. B. (2013) Synergistic effects of metformin, resveratrol, and hydroxymethylbutyrate on insulin sensitivity. Diabetes Metab. Syndr. Obes. 6, 93–102 [DOI] [PMC free article] [PubMed] [Google Scholar]
- 56. Simmons A., Meshulam L. N., Corkey B. E. (2013) Metformin relieves oxidative stress and leads to differential modulation of function in key metabolic tissues. FASEB J. 27, LB113 [Google Scholar]
- 57. Barreto-Torres G. A., Javadov S. (2013) AMP-kinase prevents oxidative stress-induced mitochondrial dysfunction through regulation of protein acetylation in cardiomyocytes. FASEB J. 27, 682.6 [Google Scholar]
- 58. Koh H.-J., Toyoda T., Fujii N., Jung M. M., Rathod A., Middelbeek R. J., Lessard S. J., Treebak J. T., Tsuchihara K., Esumi H., Richter E. A., Wojtaszewski J. F., Hirshman M. F., Goodyear L. J. (2010) Sucrose nonfermenting AMPK-related kinase (SNARK) mediates contraction-stimulated glucose transport in mouse skeletal muscle. Proc. Natl. Acad. Sci. U.S.A. 107, 15541–15546 [DOI] [PMC free article] [PubMed] [Google Scholar]
- 59. Guigas B., Bertrand L., Taleux N., Foretz M., Wiernsperger N., Vertommen D., Andreelli F., Viollet B., Hue L. (2006) 5-Aminoimidazole-4-carboxamide-1-β-d-ribofuranoside and metformin inhibit hepatic glucose phosphorylation by an AMP-activated protein kinase-independent effect on glucokinase translocation. Diabetes 55, 865–874 [DOI] [PubMed] [Google Scholar]


