Background: Motions of cytoplasm domains in phosphoenzyme transition of Ca2+-ATPase are critical for function.
Results: Rate analysis of electrostatic salt screening and mutagenesis on N and P domains combined with electric field analysis suggest electrostatics accelerate the transition.
Conclusion: The long-range electrostatics likely guide N and P domain motions.
Significance: P-type ion pumps may harness thermal energy through electrostatics.
Keywords: Bioenergetics, Calcium ATPase, Enzyme Mechanisms, Enzyme Structure, Kinetics, Molecular Modeling, Mutagenesis Site Specific, Domain Motion, Electrostatic Interaction, Enzyme Structure and Function
Abstract
Sarcoplasmic reticulum Ca2+-ATPase couples the motions and rearrangements of three cytoplasmic domains (A, P, and N) with Ca2+ transport. We explored the role of electrostatic force in the domain dynamics in a rate-limiting phosphoenzyme (EP) transition by a systematic approach combining electrostatic screening with salts, computer analysis of electric fields in crystal structures, and mutations. Low KCl concentration activated and increasing salt above 0.1 m inhibited the EP transition. A plot of the logarithm of the transition rate versus the square of the mean activity coefficient of the protein gave a linear relationship allowing division of the activation energy into an electrostatic component and a non-electrostatic component in which the screenable electrostatic forces are shielded by salt. Results show that the structural change in the transition is sterically restricted, but that strong electrostatic forces, when K+ is specifically bound at the P domain, come into play to accelerate the reaction. Electric field analysis revealed long-range electrostatic interactions between the N and P domains around their hinge. Mutations of the residues directly involved and other charged residues at the hinge disrupted in parallel the electric field and the structural transition. Favorable electrostatics evidently provides a low energy path for the critical N domain motion toward the P domain, overcoming steric restriction. The systematic approach employed here is, in general, a powerful tool for understanding the structural mechanisms of enzymes.
Introduction
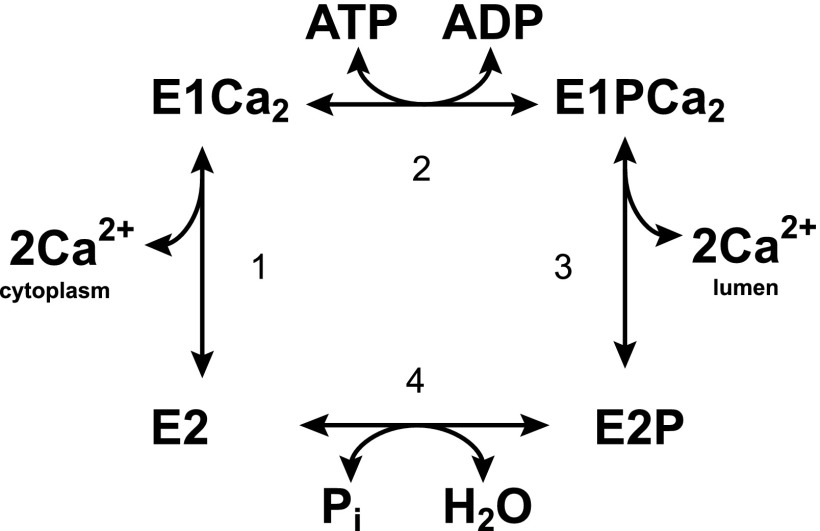
Sarcoplasmic reticulum Ca2+-ATPase (SERCA1a),2 a member of the P-type ATPase family, catalyzes Ca2+ transport coupled with ATP hydrolysis. The enzyme is activated by the binding of two cytoplasmic Ca2+ ions at the high affinity transport sites (E2 to E1Ca2, step 1 in Fig. 1) and autophosphorylated at Asp351 with MgATP to form an ADP-sensitive phosphoenzyme (E1P, step 2), which reacts with ADP to regenerate ATP in the reverse reaction. Upon E1P formation, the two bound Ca2+ are occluded in the transport sites (E1PCa2). The subsequent isomeric transition to the ADP-insensitive E2P form results in rearrangements of the Ca2+ binding sites to deocclude Ca2+, reduce the affinity, and open the lumenal gate, thus releasing Ca2+ into the lumen (step 3). Finally the Asp351-acylphosphate in E2P is hydrolyzed to form a Ca2+-unbound inactive E2 state (step 4).
FIGURE 1.
Reaction cycle of Ca2+-ATPase.
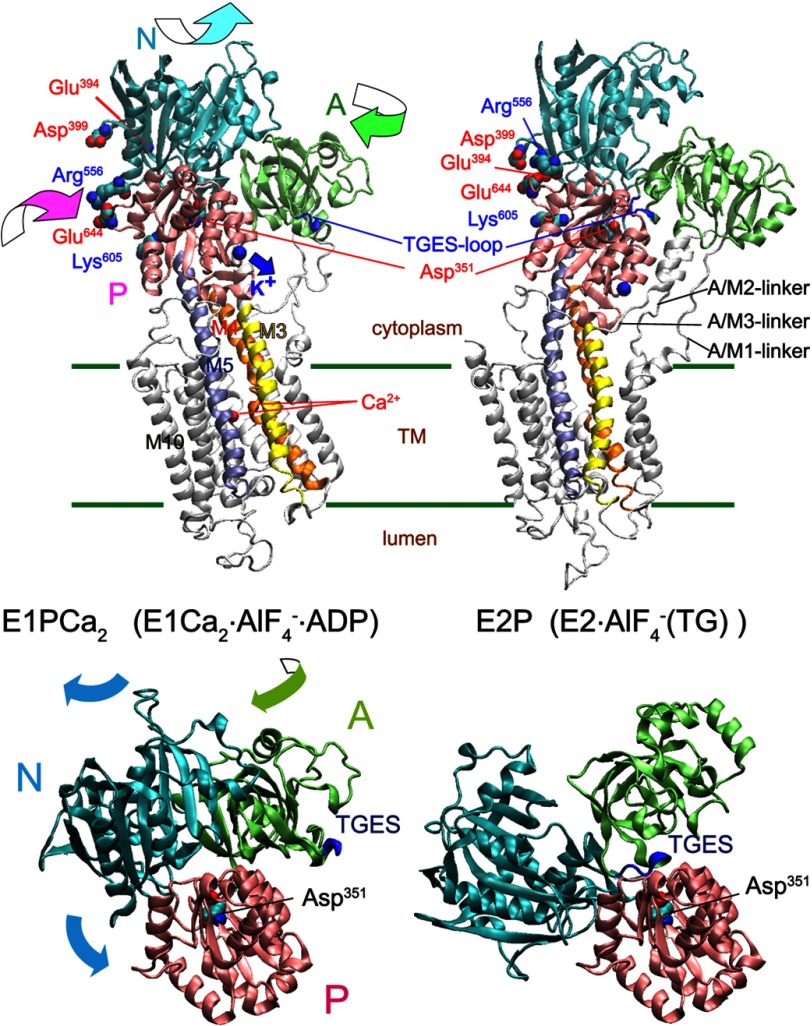
The enzyme consists of three cytoplasmic domains: nucleotide binding (N), phosphorylation (P), and actuator (A), and 10 transmembrane helices (M1–M10) (Fig. 2) (1). The cytoplasmic domains move considerably and change their interfaces in conjunction with rearrangements of the helices for Ca2+ transport (2–13). In the catalytic cycle, the transition of an autophosphorylated intermediate (EP) from E1PCa2 to the Ca2+-released form E2P by structural change (EP transition, E1PCa2 → E2P + 2Ca2+) is a key rate-limiting step (Fig. 1). During the transition, the A domain rotates from its position in E1PCa2 and the P domain with M4/M5 inclines to form a tight A-P domain association. Space for the A domain is created by the N domain swinging upwards at the N-P domain hinge, and the membrane helices rearrange reducing the Ca2+ affinity and opening the lumenal gate (Fig. 2).
FIGURE 2.
Structural change of Ca2+-ATPase in EP transition. Upper panel, the structural change is modeled on the crystal structures with bound K+, E1Ca2·AlF4−·ADP as the E1PCa2 analog and E2·AlF4− (TG) as the E2P analog (PDB 1T5T and 1XP5 (7), respectively). The two structures are aligned with the static M8-M10 helices. The approximate position of the transmembrane region (TM) is shown by green lines. The motions of the N, P, and A domains during the EP transition are indicated by curved arrows. The autophosphorylation site (Asp351), TGES-loop of the A domain (blue loop, Thr181-Ser184 that forms the catalytic site to hydrolyze E2P), the residues explored in this study, Glu394/Asp399 forming the N-P domain long-range electrostatic interactions with Lys605, and Arg556 and Glu644 as the representative two residues at the N-P domain hinge are indicated. Note that the K+ site with bound K+ on the P domain moves down to the A/M3-linker (blue arrow), and likely cross-links the P domain with the A/M3-linker in E2P. Lower panel, the motions of the N (cyan) and A (green) domains relative to the P domain (pink) during the EP transition E1PCa2 → E2P + 2Ca2+ are shown with the curved arrows. For simplicity the transmembrane helices are not depicted, otherwise as in the upper panel.
To understand the energy coupling, it is crucial to elucidate motive forces for the domain motions; how they are produced and how they function. The critical importance of several inter-domain interactions between the A and P domains is demonstrated by close contacts of residues in the E2P structure (14–17), but these contacts must occur after the domain motions and gathering and therefore cannot be the main driving forces. These interactions rather function to stabilize the E2P structure and also likely restrict the direction of motions to the next structural state, possibly acting as ratchets. On the other hand, for inducing and controlling the A domain motions during the EP transition and Ca2+ release, the critical importance of the length of the A/M1-linker (connecting the A domain and M1) (18–20) is well demonstrated. This linker also directs P domain motions via the associated A domain.
Other crucial questions, as yet unexplored, are how the N domain motion occurs and whether it plays an active role in the EP transition. ADP needs to be released first, since the N domain is cross-linked by ATP producing the closed N-P domain organization for phosphoryl transfer. The N domain is connected with the P domain via two short loops and no structural elements seem to induce or guide the required motion for creating the space for the A domain. Then, if thermal motions contribute (8, 10, 11), some mechanism of transforming an isotropic fluctuating motion into one appropriately directed would be essential for efficient functional coordination of the motions.
In this study, we therefore explored a possible role of electric force in the N domain motion by combining electrostatic screening with salts, mutations, and computer analysis of the electric field of the protein by a program APBS (adaptive Poisson-Boltzmann solver), which evaluates the electrostatic properties and interactions of nanoscale biomolecular systems in aqueous media at varying salt concentrations (21). We show that the N-P domain long-range electrostatic interactions markedly accelerate the EP transition probably by directing the N domain toward the P domain at their hinge, thereby opening up space for the in-swinging A domain. We also reveal residues on the N and P domains generating the critical long-range electrostatic interactions and the role of K+ specifically bound to the P domain of the ATPase for inducing the proper and efficient structural change. In general, the contribution of long-range electrostatic interactions between charged residues on the surface of the protein to enzyme catalysis have not received much attention because they are thought to be substantially masked by solvent. However, by using a systematic approach, we reveal the existence of such interactions in the Ca2+-pump and how they play a crucial role in domain dynamics. The approach may be usefully applied to elucidating electrostatics influences on structural transitions in other enzymes.
EXPERIMENTAL PROCEDURES
Mutagenesis and Expression
QuikChangeTM site-directed mutagenesis (Stratagene) was utilized for the substitution of residues in rabbit SERCA1a cDNA. The KpnI-SalI restriction fragment was ligated back into the corresponding region in the full-length SERCA1a cDNA in the pMT2 expression vector (17). The pMT2 DNA was transfected into COS-1 cells with LipofectamineTM and plus reagent (Invitrogen).
EP Formation and Transition
Microsomes expressing the wild type or mutant SERCA1a (20 μg/ml) prepared from the COS-1 cells (17) were phosphorylated with 10 μm [γ-32P]ATP for 20 s at 0 °C in MOPS/Tris (pH 7.0), 7 mm MgCl2, 10 μm CaCl2, 3 μm A23187, and various concentrations of monovalent salt. The phosphorylation was terminated by adding an equal volume of a solution containing 2 mm EGTA without CaCl2 and [γ-32P]ATP otherwise as described above. At various time points, the total amount of EP was determined following the addition of trichloroacetic acid. The amount of E2P was determined by adding an equal volume of a solution containing 2 mm ADP and 5 mm EGTA without CaCl2 and [γ-32P]ATP otherwise as described above, followed by trichloroacetic acid addition at 1 s after the ADP addition (Fig. 3). The amount of EP was quantified with digital autoradiography after separation by 5% SDS-PAGE at pH 6.0 according to Weber and Osborn (22), as described previously (17).
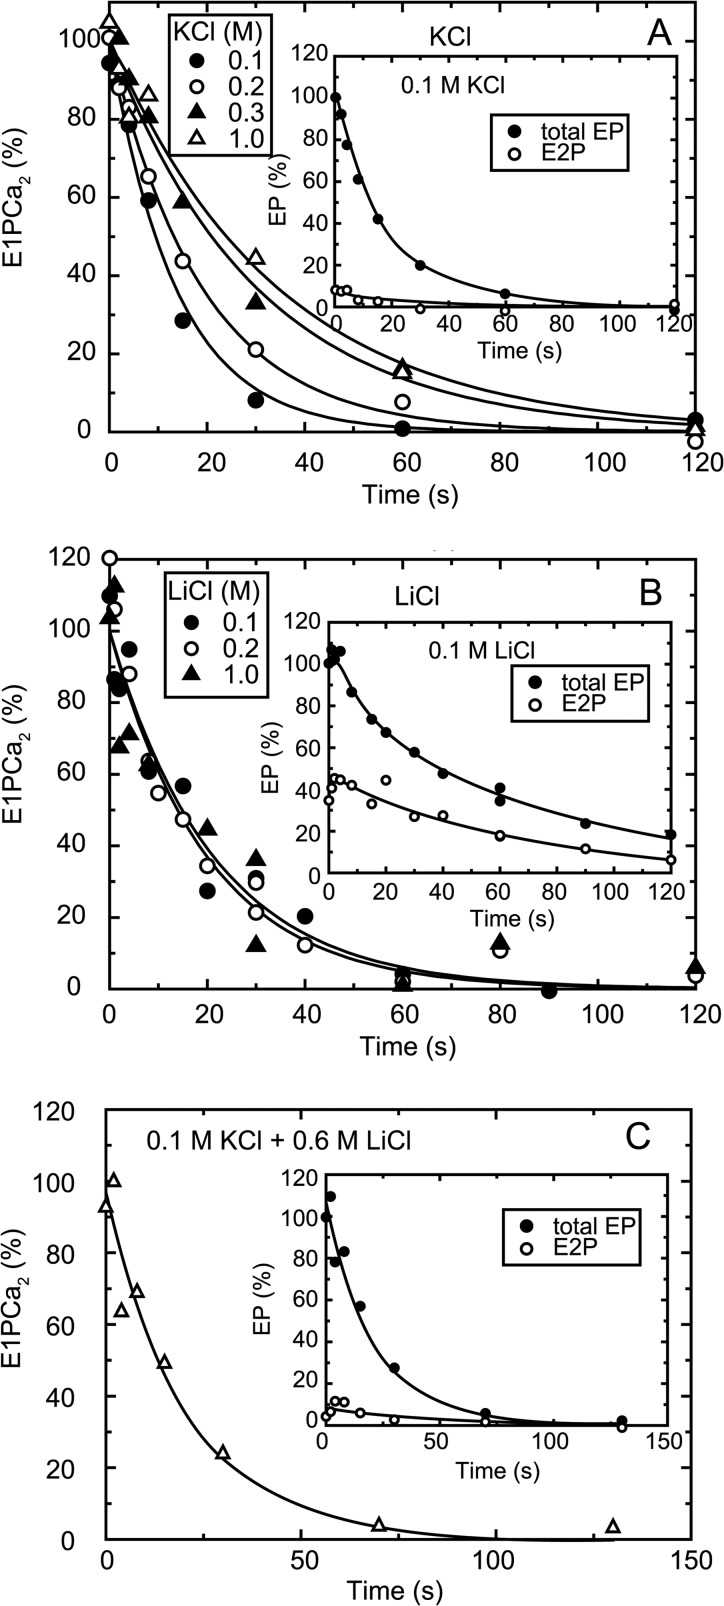
FIGURE 3.
Time course of EP transition from E1PCa2 to E2P. Microsomes expressing the wild type SERCA1a were phosphorylated with ATP for 20 s at 0 °C in the presence of various concentrations of KCl (A), LiCl (B), or 0.1 m KCl plus 0.6 m LiCl (C). The amount of E1PCa2 was estimated at each time point during EP decay by subtracting the amount of E2P from the total amount of EP (insets). The E1PCa2 decay thus obtained in the main panels reflects the EP transition, E1PCa2 → E2P + 2Ca2+. Solid lines in the main panels show the least squares fit to a single-exponential. Note in KCl at 0.1–1 m (A) and 0.1 m KCl plus 0.6 m LiCl (C), almost all EP was the ADP-sensitive form (E1PCa2) at steady state and during the EP decay (insets, in A as an example with 0.1 m KCl), because the rate-limiting E1PCa2 to E2P transition is followed by the rapid E2P hydrolysis in the K+-bound ATPase (31). Na+ gave the same kinetic effects as K+. Thus in K+ and Na+, the decay in the total amount of EP actually reflects the rate-limiting E1PCa2 to E2P transition. On the other hand, in LiCl at 0.1–1 m without K+ (B), a substantial amount of E2P in the total amount of EP accumulated at the steady state because of the slow E2P hydrolysis without the bound K+ (see for example, at 0.1 m in the inset). E2P accumulated largely in choline-Cl without K+ and in the absence of salts, as in LiCl (data not shown). Note also, in LiCl at 0.6 m with 0.1 m KCl (C), E2P accumulation was as low as in KCl (A), therefore Li+ even at the high concentrations does not inhibit (or substitute) K+ binding.
Basis for Plotting Logarithm of Rate Versus Square of Mean Activity Coefficient
Total electrostatic interaction energy of interacting solutes i and j in a whole system (Eelectric) can be described as the sum of each interaction energy (Eij).
 |
Here ni and nj are the number of i and j, respectively, which are proportional to their concentrations ci and cj, therefore,
Ionic solutes in an ionic solution do not behave ideally even at low concentrations. Their charges are shielded by surrounding ions in the environment, and therefore for understanding the behavior of the solute, its activity (a) rather than concentration (c) is utilized in a real system. In general, an increase in ionic strength decreases the activity of the solute thereby attenuating its electrostatic interaction energy. By using the mean activity coefficient of solutes (γ±), the activity is given as Equation 3.
The electrostatic interaction energy is therefore proportional to the square of the mean activity coefficient.
For a protein with its concentration c, the electrostatic interaction energy between the positively charged and negatively charged residues is described.
The mean activity coefficient γ± can be estimated according to the specific ion interaction theory as described below.
Estimation of Mean Activity Coefficient
In the specific ion interaction theory, an extension to the Debye-Hückel theory (23–25), the activity coefficient of an ion, e.g. j (γj), in a solution with an ionic strength I is expressed.
 |
Here z, b, and c are the electric charge of j, the specific ion interaction theory parameter (i.e. the interaction coefficient of salts), and the concentration of an interacting salt ion k in the environment, respectively. The first term comes from the Debye-Hückel theory. The second term with the specific ion interaction theory parameter shows how the contribution of “interaction” is dependent on the concentration ck. Thus, the specific ion interaction theory parameter is used as a correction to the first term derived from the Debye-Hückel theory. According to this equation and the fact that all the charges in the protein are monovalent (z = 1), the mean activity coefficient of protein in ionic solution was estimated as follows.
In the experiments, the ionic strength was varied with the chloride salt of monovalent cations (M+) in the presence of low and constant concentrations of buffer and other solutes (Mg2+ and Ca2+), therefore we divided the second term (correction factor) into variable and constant (const) terms, and considered the negatively charged residues and positively charged residues,
 |
for negatively charged residues, and
 |
for the positively charged residues.
By adding these two equations, the mean activity coefficient of protein is defined as Equation 9.
 |
We first calculated the γ±2 value solely according to the Debye-Hückel theory (the first term) without taking into account the second (correction) and third (constant) terms, and plotted the logarithm of the EP transition rate versus γ±2 thus estimated. The plot showed a very good linear relationship. Nevertheless, we employed the second term (without third term) by estimating bjMCl by best fit in a linear regression. The values bjMCl thus estimated were actually very small, i.e. 0.03, 0.01, −0.01, and −0.01 for KCl, LiCl, NaCl, and choline-Cl, respectively, showing the plots almost identical to those without the second and third terms.
Homology Modeling and Electric Potential Calculation
Homology models of SERCA1a mutants were generated from SERCA1a PDB files by the program MODELLER (26). PDB format files of the wild type and mutants were converted by the PDB2PQR server to PQR format files that possess information on per-atom charge and radius (27), and then applied to the simulation program APBS to calculate the electric potential on the three-dimensional structure in aqueous media containing salt (21). In APBS, the parameters were set to 78.58, 2, 0.15 m, and 298.15 K for the dielectric constant (relative permittivity) of water at 25 °C, that of the protein (28), the concentration of salts, and temperature, respectively. Three-dimensional models of SERCA1a and its mutants were reproduced and electric field lines were visualized by the program VMD (29).
Miscellaneous
Protein concentrations were determined according to Lowry et al. (30). Data were analyzed by nonlinear regression using the program Origin (Microcal Software, Inc.).
RESULTS
Salt Concentration Dependence of EP Transition
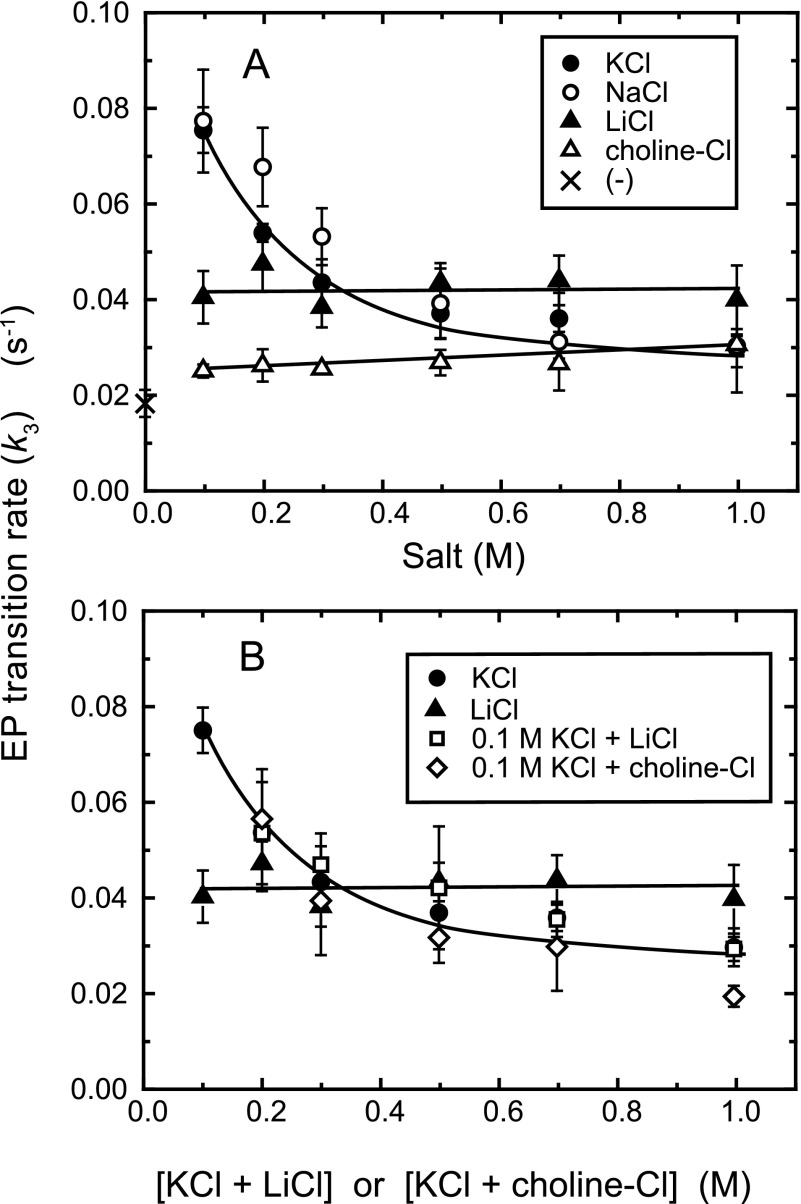
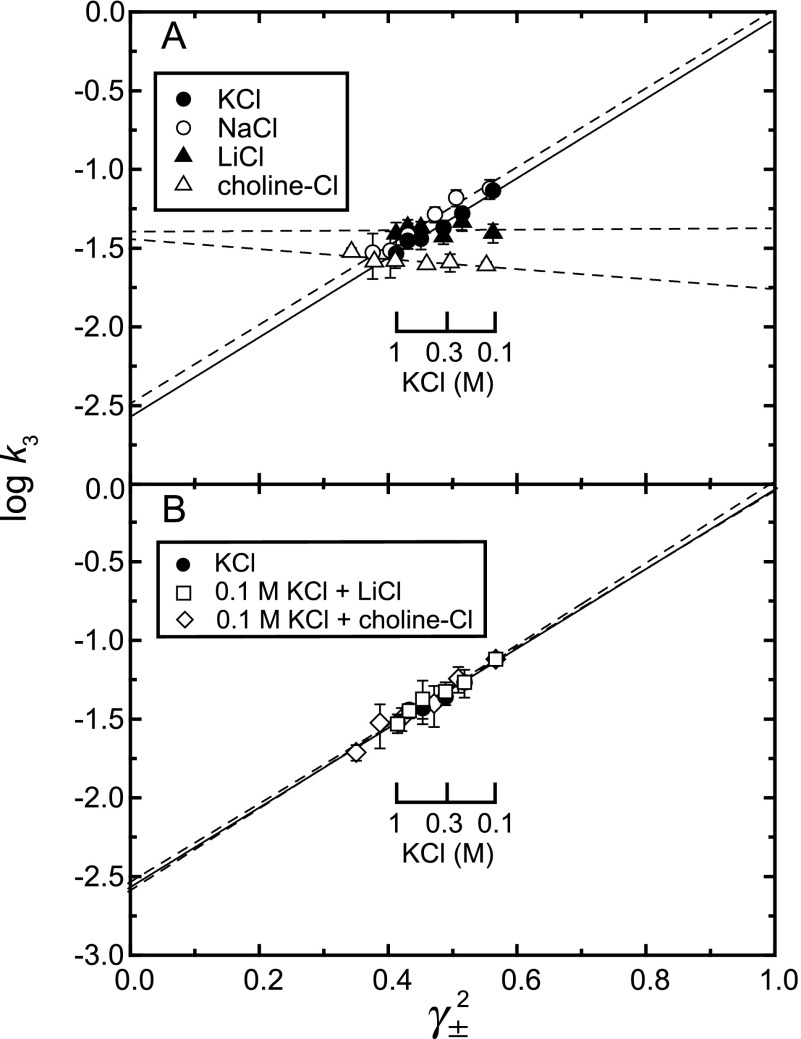
To explore effects of ionic strength and monovalent cations on the EP transition E1PCa2 → E2P + 2Ca2+, we determined the EP transition time course using 0.1–1 m monovalent chloride salts (see representative ones in Fig. 3). These transition rates (k3) are summarized in Fig. 4A. The rate in 0.1 m KCl and NaCl was much higher than that in the absence of salt, showing a marked acceleration of the EP transition by K+ (Na+). The binding of K+ (Na+) to a specific site on the P domain is known to occur below this concentration range and to accelerate E2P hydrolysis (5, 31, 32). The K+ acceleration occurs in a lower concentration range compared with that for Na+, the effect is nevertheless, apparently saturated by 0.1 m for both cations (31). Evidently, another consequence is to accelerate the EP transition from E1PCa2 to E2P, as found here.
FIGURE 4.
EP transition rate k3 in various concentrations of monovalent salt. A, the rate was determined in the indicated monovalent salt or without the salts (×) as described in the legend to Fig. 3. B, the rate was determined in the presence of 0.1 m KCl plus various concentrations of LiCl or choline-Cl otherwise as above, and plotted versus the total concentration of the salts. The rates determined with KCl and LiCl in A are also plotted for comparison. The values presented are the mean ± S.D. (n = 3–5).
With increasing KCl (or NaCl) above 0.1 m, the rate decreased markedly. The rate in LiCl was somewhat higher than that in the absence of salt, and did not change in the 0.1–1 m range. The rate in 0.1–1 m choline-Cl was close to that without salts, suggesting no choline+ binding. In contrast, with increasing LiCl and choline-Cl in the presence of 0.1 m KCl (Fig. 4B), the rate decreased markedly with the same concentration dependence as in KCl or NaCl, thus showing that in the ATPase with specifically bound K+ (or Na+), attenuation of electrostatic energy by increasing ionic strength retards the EP transition. Therefore the electric force functions to accelerate the reaction. Note also in Figs. 3C and 4B that Li+ even at the high concentrations (0.6 or 0.9 m) in 0.1 m K+ does not affect the unique kinetics of the K+-bound ATPase, therefore not inhibiting the specific binding of K+ at 0.1 m.
Log Rate Versus Square of Mean Activity Coefficient γ±2
The logarithm of rate is a linear function of activation energy. Electrostatic energy between interacting charges is expected to be proportional to the product of activities of the charges and therefore to the square of the mean activity coefficient γ±2 (see “Experimental Procedures”). Hence a plot of the logarithm of rate versus γ±2 would give a linear relationship and thereby divide the activation energy into two components, an electrostatic force and a non-electrostatic force; i.e. the slope reflects the amplitude of the contribution of electrostatic energy, and the intercept at γ±2 = 0 reveals the contribution of non-electrostatic energy because these are conditions in which the electrostatic interactions that are able to be screened on the protein surface are completely shielded by salt. Note here that electrostatic forces of residues within the protein, inaccessible to salts, and formed by close strong contacts even on the protein surface are not shielded. In Fig. 5, plots of the data in Fig. 4 do indeed show a linear relationship. In KCl and NaCl as well as in LiCl and choline-Cl with 0.1 m KCl, the plot gave a nearly identical steep positive slope showing the marked acceleration by electric force in the K+ (or Na+)-bound ATPase (Table 1). In contrast, without K+, the slope was nearly zero in LiCl or slightly negative in choline-Cl, showing apparently no effect or a negative effect of an electrostatic component. Notably also, the intercept at γ±2 = 0 in KCl and NaCl as well as in LiCl and choline-Cl with 0.1 m KCl was much lower than that in LiCl and choline-Cl without KCl, showing that a substantial non-electrostatic restriction is produced by K+ (Na+) binding for the EP transition. Thus at ∼0.1 m K+ (physiological conditions), the bound K+ markedly accelerates the EP transition as a consequence of an electrostatic effect overcoming a non-electrostatic restriction.
FIGURE 5.
Relationship between logarithm of EP transition rate k3 and square of mean activity coefficient γ±2. Log k3 determined in Fig. 4 is plotted versus γ±2. Lines are best fit in a linear regression, and the fitting parameters (the intercept and slope) are listed in Table 1. The solid line in A and B is for the data in KCl. The salt concentration indicated is for KCl. The values presented are the mean ± S.D. (n = 3–5).
TABLE 1.
Fitting parameters in Fig. 5
| Salt | Fitting parametersa |
|
|---|---|---|
| Intercept | Slope | |
| KCl | −2.57 ± 0.09 | 2.52 ± 0.18 |
| NaCl | −2.48 ± 0.11 | 2.50 ± 0.23 |
| LiCl | −1.39 ± 0.14 | 0.02 ± 0.30 |
| Choline-Cl | −1.43 ± 0.05 | −0.32 ± 0.12 |
| 0.1 m KCl + LiCl | −2.59 ± 0.10 | 2.59 ± 0.22 |
| 0.1 m KCl + choline-Cl | −2.53 ± 0.10 | 2.48 ± 0.20 |
a The values presented are the mean ± S.E. in a least-squares fitting.
Disruption of N-P Domain Electric Field and of Electrostatic Acceleration of EP Transition by Mutations
Interdomain bonds by charged residues seen in crystal structures have been revealed by mutation and kinetic studies to be critical for particular intermediates via stabilizing the domains' contact at the interface (or bound ATP) (14–16, 33, 34). Distinct mutation effects observed even under a limited ionic strength are evidently due to serious disruption of short-distance high energy interactions (as the energy is high over a short distance but falls off with distance), and thus clearly demonstrated the structural roles of the charged residues.
On the other hand, long-range electrostatic interactions of residues on a protein surface possessing low interaction energy and being exposed to solute may be sensitively screened and revealed by electrostatic salt screening in combination with mutations. During the EP transition the N and P domains only have contact at the joining hinge, but need to move relative to each other to create space for the incoming A domain (Fig. 2). Therefore to explore the structural mechanism involved in the electrostatic acceleration of the EP transition, we examined the surfaces of the N and P domains and their relative motions. First, we inspected electric field lines on the N and P domains in crystal structures by APBS computer analysis of the electric potential, which incorporates the contribution of surrounding water molecules (by the dielectric constant of water) and salt (by its concentration) as described under “Experimental Procedures” (Fig. 6). The electric field lines represent the electric force due to electric charges, which can act over great distances and along which an isolated charge would move were it free to do so.
FIGURE 6.
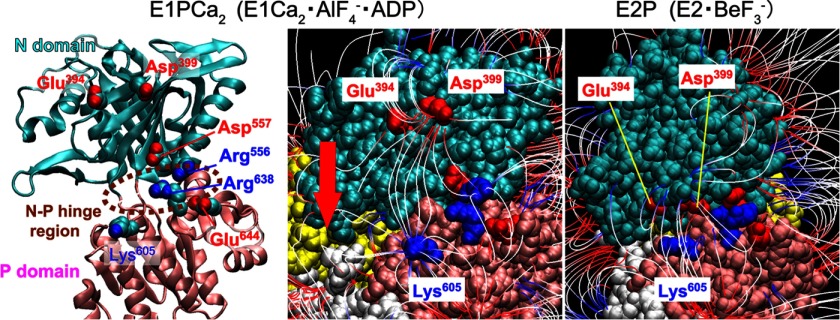
Electric field lines between N and P domains in E1PCa2 and E2P models. The domains P (amino acid number 330–359 and 602–750, pink), N (360–601, cyan), and A (1–40 and 125–235, yellow) of E1Ca2·AlF4−·ADP (PDB 1T5T (7), the E1PCa2 analog with bound K+; left and center panels) and of E2·BeF3− (PDB 3B9B (9), the E2P ground state analog with bound Na+ (in place of K+); right panel) are depicted for the wild type with the residues explored in this study. The models are viewed from the side opposite the phosphorylation site and the A domain, and shown with van der Waals spheres (center and right panels) and a schematic model (left panel, in which the A domain is omitted for simplicity). In the center and right panels, the electric field lines revealed by computer analysis of electric potential are colored from red to blue (−1κT/e to 1κT/e J/coulomb (red is negative, blue is positive, and white is neutral), in which κ is the Boltzmann constant, T is the temperature, and e is the electron charge). The red arrow on E1Ca2·AlF4−·ADP (center panel) shows the approximate movement of Glu394/Asp399 toward Lys605 during the EP transition (E1Ca2·AlF4−·ADP → E2·BeF3−).
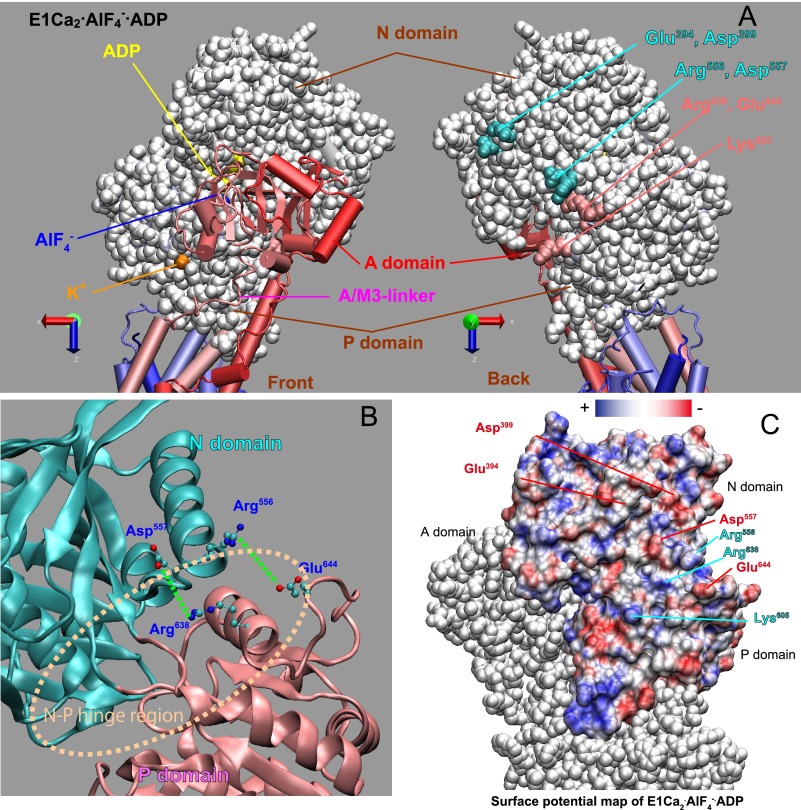
In the E1PCa2 analog E1Ca2·AlF4−·ADP and the E2P ground state analog E2·BeF3−, the electric field lines, i.e. electrostatic interactions, form between the N and P domains around the hinge, linking Glu394-Lys605 and Asp399-Lys605 (see the vertical lines in Fig. 6). During E1Ca2·AlF4−·ADP to E2·BeF3−, Glu394 and Asp399 move toward Lys605 changing the intervening distance from 29 to 14 Å. At the hinge region, there are four charged residues Arg556, Asp557, Arg638, and Glu644, which potentially form ion pairs, i.e. close contacts between the N and P domains (Arg556-Glu644 and Asp557-Arg638, Figs. 6 and 7). We therefore examined the effects of disruption by mutations both in the wide-range electric field and in the hinge region. It should be noted that at the N-P domain hinge the selected two-ion pair mutations are the only available pairs in this region, i.e. only the possible close contact residues between the N and P domains. Note also that all the mutations are spatially distant from, in fact at the back of, the nucleotide/catalytic sites and stimulatory K+ site (Fig. 7), and therefore are unlikely to disrupt directly these sites.
FIGURE 7.
Location of residues involved in formation of N-P domain long-range electrostatic interactions (A and B) and surface potential (C) in the E1PCa2 analog E1Ca2·AlF4−·ADP (PDB 1T5T). A, the cytoplasmic region is shown in left and right with views from the catalytic site (Front) and its opposite side (Back), respectively. The N and P domains are depicted with van der Waals spheres, and the other parts including the A domain by a schematic model. AlF4− bound at the catalytic site and ADP at the nucleotide binding site are indicated in blue and yellow, respectively. The three residues directly involved in the N-P domain long-range electrostatic interactions (Glu394/Asp399 and Lys605) and four charged residues at the N-P domain hinge (Arg556, Asp557, Arg638, and Glu644) are indicated. B, the enlarged view of the N-P hinge region, in which the four residues (Arg556, Asp557, Arg638, and Glu644) that potentially form ion pairs (green dashed lines) between the N (cyan) and P (pink) domains are indicated. C, the electrostatic potential of the N and P domain surface is colored from red to blue (−5κT/e to 5κT/e J/coulomb (red is negative, blue is positive, and white is neutral), in which κ is the Boltzmann constant, T is the temperature, and e is the electron charge. For simplicity, the potential on the A domain is not depicted.
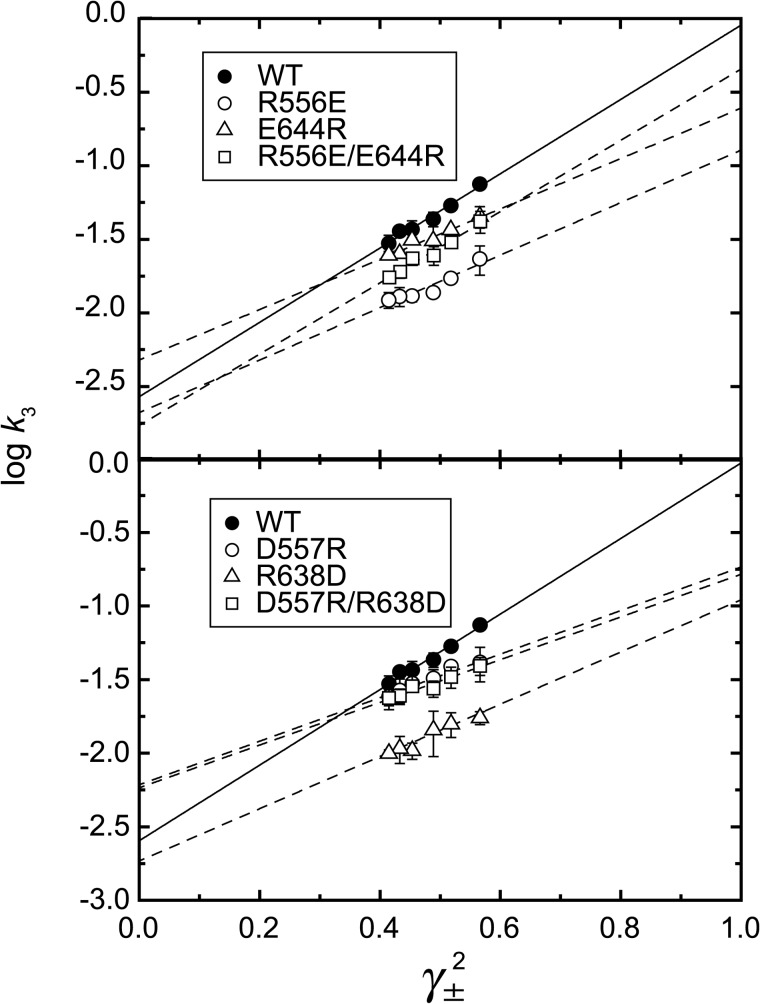
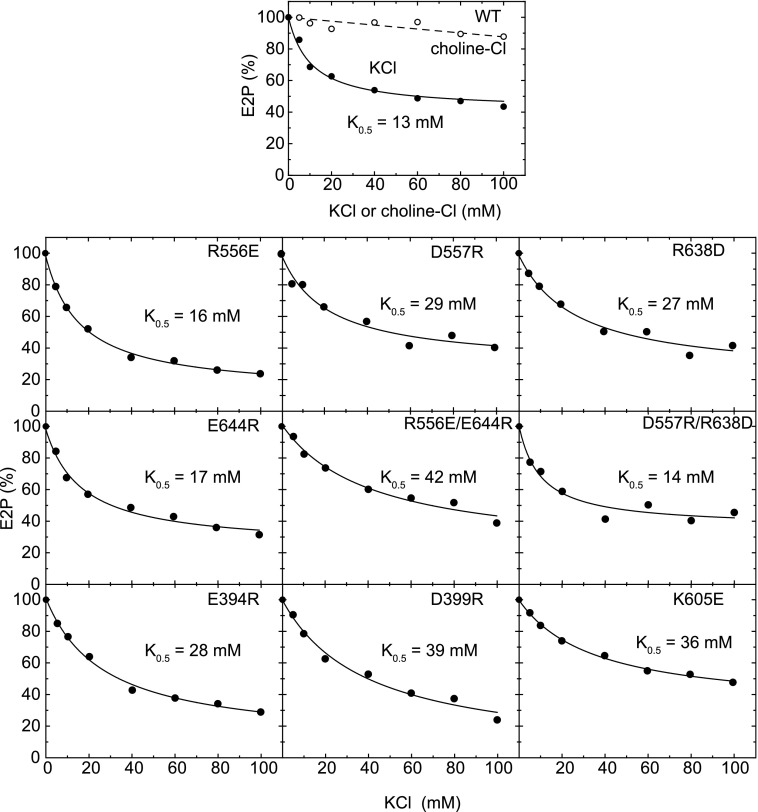
First, on the N-P domain hinge residues, we introduced opposite charges. The EP transition rate in the mutants was determined at 0.1–1 m KCl and plotted as its logarithm versus γ±2 (Fig. 8). As summarized in Table 2, all the single mutations decreased the slope compared with the wild type, indicating that the mutations disrupted the electrostatic energy. The swap mutation R556E/E644R restored the slope to the wild type, but D557R/R638D did not. The results indicate that the charged residues at the N-P hinge are critical for electrostatic acceleration of the EP transition, and that the possible ion pairs Arg556-Glu644 and Asp557-Arg638 do not seem directly involved (although a contribution from Arg556-Glu644 cannot be ruled out). Note that these mutations do not disrupt the K+-site structure (Fig. 9) nor the high K+ affinity (Fig. 10).
FIGURE 8.
Log k3versus γ±2 in the wild type and hinge mutants. The rates were determined in various concentrations of KCl for the wild type (WT) and the N-P domain hinge mutants as indicated, and their logarithms are plotted versus γ±2. Lines are best fit in a linear regression, and the fitting parameters are listed in Table 2. The solid lines are for the wild type. The values presented are the mean ± S.D. (n = 3–5).
TABLE 2.
| Fitting parametersa |
||
|---|---|---|
| Intercept | Slope | |
| WT | −2.57 ± 0.09 | 2.52 ± 0.18 |
| R556E | −2.68 ± 0.14 | 1.78 ± 0.30 |
| E644R | −2.32 ± 0.09 | 1.71 ± 0.19 |
| R556E/E644R | −2.77 ± 0.09 | 2.42 ± 0.20 |
| D557R | −2.21 ± 0.08 | 1.48 ± 0.10 |
| R638D | −2.73 ± 0.15 | 1.78 ± 0.30 |
| D557R/R638D | −2.23 ± 0.08 | 1.46 ± 0.15 |
| K605E | −1.87 ± 0.10 | 1.43 ± 0.20 |
| E394R | −1.66 ± 0.10 | 0.49 ± 0.21 |
| D399R | −1.68 ± 0.09 | 0.64 ± 0.19 |
a The values presented are the mean ± S.E. in a least-squares fitting.
FIGURE 9.
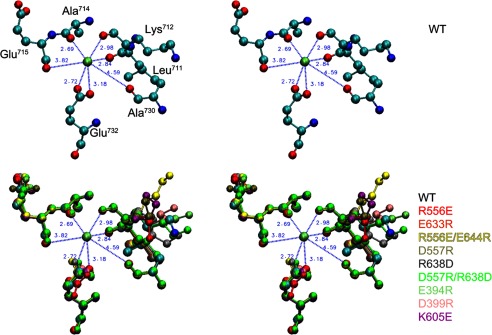
Stereo view of K+ binding site. The three-dimensional structures of the mutants are generated by MODELLER (26) from the wild-type structure E1Ca2·AlF4−·ADP (PDB 1T5T) that possesses specifically bound K+. To reveal possible maximum effects of the mutations on the K+-site structure, the modeling was performed without K+ coordination (by omitting the K+). Nevertheless, the overall structure of the ATPase molecule (not shown) and the configurations of the residues for the K+ coordination (depicted in this figure) in the mutants are almost identical with those in the wild type. The K+ (lime sphere placed at the wild-type position) and the residues likely involved in the K+ coordination (blue dashed lines with the coordination length (Å) in the wild type) are shown for the wild type (WT in upper and lower panels; red for oxygen atom, blue for nitrogen atom, cyan for carbon atom) and for the mutants with the respective single colors (lower panel). Note that the configurations in all the mutants superimpose very well with those in the wild type.
FIGURE 10.
Apparent K+ affinity determined by inhibition of E2P formation from Pi. Microsomes expressing the wild type (WT) or mutant SERCA1a as indicated were incubated with 1 mm 32Pi to form E2P from the E2 state for 30 min at 0 °C in the presence of 50 mm MOPS/Tris (pH 7.0), 7 mm MgCl2, 1 mm EGTA, 20% dimethyl sulfoxide, and various concentrations of KCl (closed circles) or choline-Cl (open circles). The amounts of E2P formed at steady state are plotted. Solid lines show the least squares fit to the equation (E2P = E2PKCl = 0 − (E2PKCl = 0 − E2PKCl = ∞)/(1 + K0.5/[KCl])). The half-effective concentrations of K+ (K0.5) thus determined are described in the panels. Note that K+ has dual effects on the EP transition kinetics as revealed in this study: the acceleration due to its specific binding and the retardation due to the increase in ionic strength (the loss of electric acceleration energy, even below 0.1 m). Note also that E2P hydrolysis is accelerated by the specific K+ binding and further accelerated at higher K+ concentrations, i.e. even in the Ca2+-ATPase with specifically bound K+ (37). Actually we found under our conditions that such complicated K+-dependent kinetics made it difficult to estimate the high K+ affinity at its specific site. On the other hand, the steady state E2P level formed from the E2 state with Pi was previously observed to be sensitive to K+ (38) and actually shown clearly here to be largely and saturably reduced by the high affinity K+ binding in low K+ concentration range most probably at its specific site, therefore we employed this method.
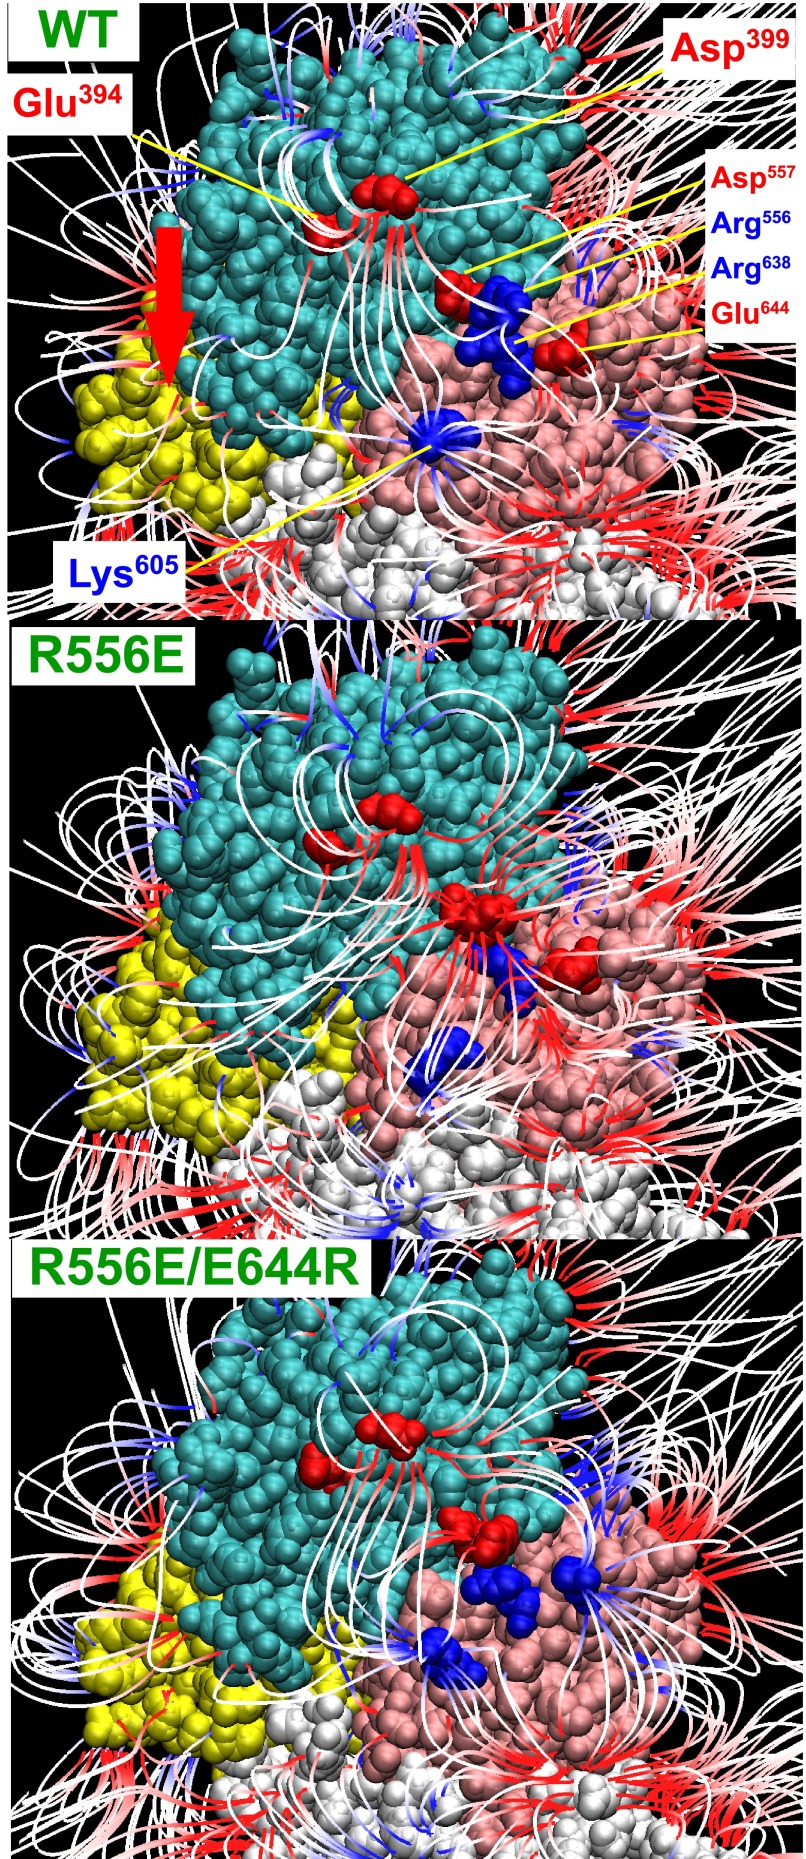
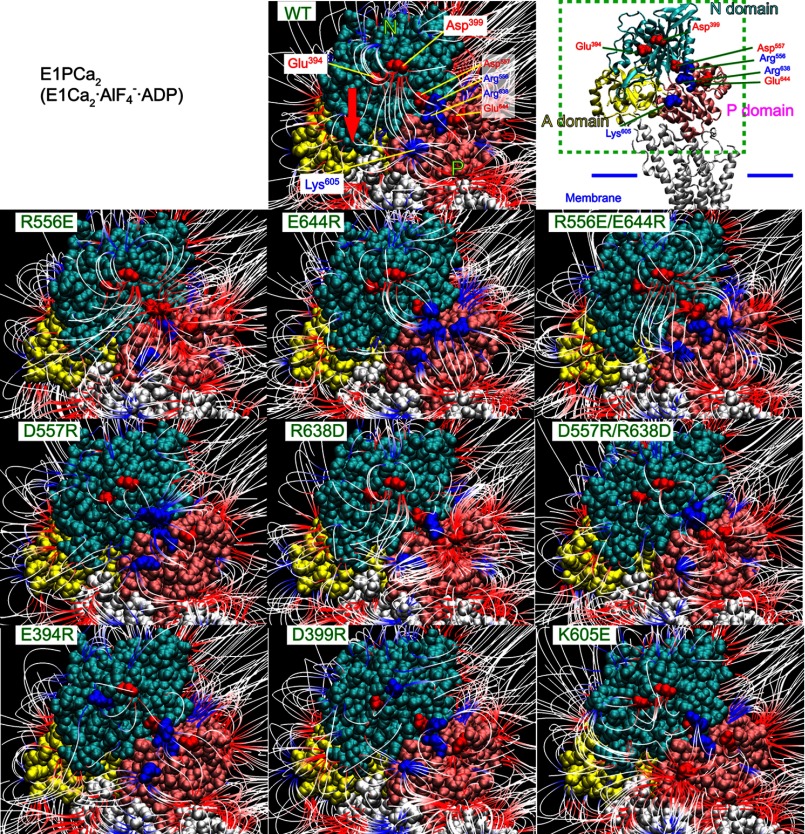
The computer simulation showed that all the single mutations at the hinge disrupt the long-range N-P domain Glu394/Asp399-Lys605 electric field lines (e.g. note in R556E the loss of Glu394/Asp399-Lys605, vertical lines) (Figs. 11 and 12). The swap mutation R556E/E644R, but not D557R/R638D, restored the Glu394/Asp399-Lys605 electric field lines. Thus the mutation-induced disruption/restoration of electric field lines occurs in parallel with the attenuation/restoration of the electric energy component for the acceleration of the EP transition. The results indicate that these charged residues at the hinge critically contribute to generate a proper N-P domain electric field, through forming long-range electrostatic interactions involving Glu394/Asp399-Lys605. Thereby the electrostatic acceleration of the EP transition is achieved.
FIGURE 11.
Electric field lines on N and P domains of the wild type and representative hinge mutants. Three-dimensional structural models of the representative two hinge mutants were constructed from the wild-type structure E1Ca2·AlF4−·ADP (PDB 1T5T) (7), and the N (cyan), P (pink), and A (yellow) domains were shown with the electric field lines, otherwise as in Fig. 6. The red arrow in the wild type (WT) shows the approximate movement of Glu394/Asp399 toward Lys605 during the EP transition (E1Ca2·AlF4−·ADP → E2·BeF3−, see more in Fig. 12). The four residues at the N-P domain hinge are indicated on the wild type.
FIGURE 12.
Disruption of N-P domain electric field by mutations. The N and P domains in E1Ca2·AlF4−·ADP are shown with the electric field lines for the wild type (WT) and all the nine mutants as indicated, otherwise as shown in Fig. 11. The enlarged area of the ATPase molecule is indicated with a schematic model in green dashed lines. The red arrow in the wild type (WT) shows the approximate movement of Glu394/Asp399 toward Lys605 during the EP transition (E1Ca2·AlF4−·ADP → E2·BeF3−).
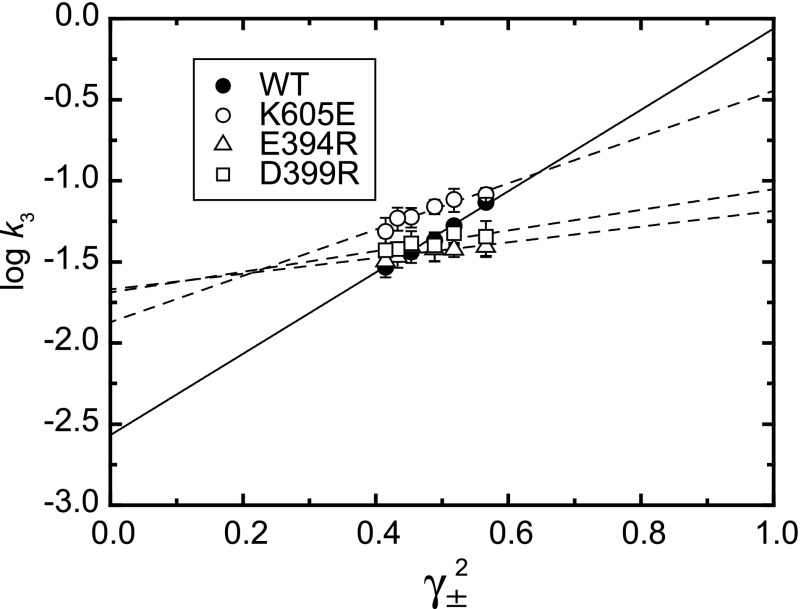
We then introduced opposite charges to Glu394, Asp399, and Lys605 to disrupt directly the N-P domain long-range interactions (Fig. 12). We found a marked decrease in the slope of the log k3 versus γ±2 plot (Fig. 13 and Table 2). The disruption was much clearer than that by the hinge mutations. The results confirm a critical role of the Glu394/Asp399-Lys605 long-range N-P domain electrostatic interactions in accelerating the structural changes occurring in the EP transition. It should be noted that the slope in these mutants was, however, not completely zero suggesting possible involvement of some other screenable ionic interactions, nevertheless, the Glu394/Asp399-Lys605 interactions make the major contribution to the acceleration of the EP transition.
FIGURE 13.
Log k3versus γ±2 in the wild type and mutants for Glu394, Asp399, and Lys605. The rates were determined in various concentrations of KCl for the wild type (WT) and mutants as indicated, and their logarithms are plotted versus γ±2. Lines are best fit in a linear regression, and the fitting parameters are listed in Table 2. The solid line is for the wild type. The values presented are the mean ± S.D. (n = 3–5).
DISCUSSION
Log Rate Versus Square of Mean Activity Coefficients γ±2
High-salt treatment is generally used to attenuate electrostatic interactions on proteins. The difficulty has been to process the data in a manner that reveals their significance. A critical role of electrostatic interactions in the association of barnase with its inhibitor protein barstar was demonstrated by the linear relationship that exists between the logarithm of association rate constant versus the logarithm of mean activity coefficient, log γ±, which is directly related to “electrostatic potential” (28, 35). An extrapolate at a very high salt concentration was taken as the basal association rate constant in the absence of electrostatic forces (although the extrapolate is not at the “zero” mean activity coefficient that really reflects the state in the complete absence of electrostatic forces). We employed here the logarithm of rate versus the square of mean activity coefficient γ±2 and found a linear relationship, permitting, with salt screening, division of the activation energy into two components, electrostatic and non-electrostatic. Use of our new plot allowed us to define two specific roles of K+ bound to the ATPase, namely to restrict the EP transition and to generate an electrostatic environment that overcomes the restriction and accelerates the reaction.
Restriction by Specifically Bound K+
We previously found (36) that K+ bound specifically at the bottom part of the P domain stabilizes the E1PCa2 structure with occluded Ca2+, thereby helping to avoid futile Ca2+ release without a change in the high affinity. The stabilization probably occurs by preventing fluctuating motions of the top parts of M4/M5 embedded in an α/β network in the P domain. In E2P, on the other hand, the bound K+ stabilizes an open lumenal gate with reduced Ca2+ affinity thus permitting rapid Ca2+ release (E2PCa2 → E2P + 2Ca2+) and establishing appropriate lumenal and cytoplasmic Ca2+ levels (17). The Ca2+-released distorted E2P structure is probably stabilized by a K+-mediated interaction network between the P domain K+-site (32) and the A/M3-linker resulting from the E1PCa2 → E2P large structural change; i.e. P domain inclination and A domain rotation, which brings them from their distant positions (Fig. 2). Thus for efficient Ca2+ transport, the structural change E1PCa2 → E2P + 2Ca2+ should occur in a precise restricted manner. Our present findings show that the required steric change is provided by the specifically bound K+ albeit with an energy cost, namely, a marked increase in a non-electrostatic component of the activation energy.
Roles of N-P Domain Electrostatic Interactions and Specifically Bound K+
The long-range N-P domain electrostatic interactions occur around the connecting hinge at the back of the N/P domains and on the opposite side of the A domain position (Figs. 6 and 7). The direction of the electric field lines linking the N and P domains in E1PCa2 seems ideal for the N domain to track toward the P domain. Mutations at the hinge as well as those of residues directly involved (Lys605 and Glu394/Asp399) perturbed in parallel the electric field and the electrostatic component of the activation energy. Hence the N-P domain long-range electrostatic interactions are crucial for accelerating the structural change in the EP transition, probably by directing the appropriate N domain motion toward the P domain at their hinge, opening a space at the opposite side and allowing the A domain to rotate into the opened N-P domain space and associate with the P domain (Fig. 2).
Note again that the required structural change is due to the specific binding of K+ (Na+ is able to substitute for K+ under non-physiological conditions). The slopes of the log k3 versus γ±2 plots in Fig. 5, reflecting the electrostatic component of the activation energy, are almost zero in LiCl or rather negative in choline-Cl. Without the K+, the E1PCa2 and E2P structures are unstable as noted above (17, 36), and the transition between them could occur as a loose, functionally inefficient steric change, where the N-P domain electrostatic interactions could actually restrict, or act as a barrier, for the domain motions. At the physiological ∼0.1 m K+, the bound K+ markedly accelerates the EP transition probably by allowing a sterically restricted precise domain motion in the proper direction guided by the N-P domain electrostatic interactions, thereby accomplishing efficient Ca2+ transport.
Quantitative Examination of Transition State Stabilization and Electrostatic Interaction Energy
The reduction in the activation energy, ΔΔG‡, due to screening in 0.1 m KCl was estimated to be −7.4 kJ/mol, which is ∼10% of the whole activation energy, a bit small to be the sole motive force but evidently still responsible for the marked acceleration (Table 3). The transition state structure must be between the initial and product states (modeled here by E1Ca2·AlF4−·ADP → E2·BeF3−), and the N-P domain Glu394/Asp399-Lys605 electrostatic interactions exist in both structures (Fig. 6). Such interactions likely persist in the transition state at intermediate distances. Because it is not possible to evaluate an exact permittivity (dielectric constant) of the solution, or more precisely, that of the protein surface in solution, we estimated the Glu394/Asp399-Lys605 electrostatic interaction energy of the transition state assuming two extremes of permittivity: that of water and protein (Table 4). In a real situation, the surface permittivity lies between these two extreme cases. Nevertheless, we found that the electrostatic interaction energy, estimated as a minimum value using the extreme water permittivity assumption, is in the same order of magnitude as ΔΔG‡. Actually, the true electrostatic interaction energy is greater since the permittivity of the protein surface must be lower than that of water.
TABLE 3.
Activation energy in the EP transition E1PCa2 → E2P + 2Ca2+
Activation energy of the EP transition (ΔG‡) was calculated for the wild type according to the transition state theory (28), ΔG‡ = −RT ln (hk3/κT), by using the rate (k3) determined at 0.1 m KCl and at the intercept of the plot in KCl, γ±2 = 0 (KCl) (Fig. 5). Here, R, T, h, and κ are the gas constant, absolute temperature, Planck constant, and Boltzmann constant, respectively. ΔΔG‡ is obtained by subtracting ΔG‡ at γ±2 = 0 (KCl) from ΔG‡ at 0.1 m KCl, and represents the reduction of the activation energy, i.e. the stabilization of the transition state in the reaction by the electrostatic energy in 0.1 m KCl.
| log k3 | k3 | ΔG‡ | |
|---|---|---|---|
| s−1 | kJ/mol | ||
| γ±2 = 0 (KCl) | −2.57 | 0.0027 | 80.1 |
| 0.1 m KCl | −1.14 | 0.072 | 72.7 |
| ΔΔG‡ | −7.4 |
TABLE 4.
Electrostatic interaction energy between Glu394/Asp399 and Lys605
The electrostatic interaction energy (Eelectrostatic) was calculated according to: Eelectrostatic = (q1q2)/(4πϵrϵ0D), with the distances (D) between the ϵ-amino nitrogen of Lys605 and the carboxyl carbons of Glu394 and Asp399, which were estimated in the structures E1Ca2·AlF4−·ADP (PDB 1T5T as E1PCa2 analog) and E2·BeF3− (PDB 2ZBE, E2P ground state analog). Here, q1 and q2 are the charges of the residues, and ϵ0 and ϵr are the vacuum permittivity and the relative permittivity. ΔEelectrostatic is the difference in the electrostatic energy between the E1PCa2 and E2P states, and reflects the stabilization of the product state E2P relative to the initial state E1PCa2. Because it is not possible to evaluate the exact ϵr value of the solution or more precisely, that of the protein surface of our interest in solution, and because the value changes region by region on the protein surface, we assumed two extreme cases: first, each of the interacting free amino acids is completely surrounded by water molecules and thereby ϵr = 87.74 for water at 0 °C; in the other case the two residues are interacting in protein where typically ϵr = 2 (28). The ϵr value on a protein surface in solution is generally expected to be between these two extreme cases. Namely, in a real situation, residues on a protein surface are exposed to and surrounded by water molecules but not completely. Therefore the charged residues on a protein surface are able to produce electric fields over a wide surface region and form long-range electrostatic interactions (Figs. 6, 7C, 11, and 12). Consistently, we found that mutations over a wide surface region of the N and P domains (i.e. Glu394/Asp399 and Lys605 and the residues at the N-P domain hinge region) disrupt the N-P domain electric field and the acceleration of the EP transition.
|
E1PCa2 (E1Ca2·AlF4−·ADP) |
E2P (E2·BeF3−) |
ΔEelectrostatic |
||||||
|---|---|---|---|---|---|---|---|---|
| D |
Eelectrostatic |
D |
Eelectrostatic |
|||||
| ϵr = 87.74 | ϵr = 2 | ϵr = 87.74 | ϵr = 2 | ϵr = 87.74 | ϵr = 2 | |||
| Å | kJ/mol | kJ/mol | Å | kJ/mol | kJ/mol | kJ/mol | kJ/mol | |
| Glu394-Lys605 | 28.3 | −0.56 | −24.5 | 11.8 | −1.34 | −58.9 | −0.78 | −34.4 |
| Asp399-Lys605 | 30.0 | −0.53 | −23.1 | 15.9 | −1.00 | −43.7 | −0.47 | −20.6 |
| Suma | −1.09 | −47.6 | −2.34 | −102.6 | −1.25 | −55.0 | ||
a The sum of the two interactions Glu394-Lys605 and Asp399-Lys605 (Glu394/Asp399-Lys605).
This quantitative analysis is consistent with our conclusion that the N-P domain electrostatic interactions function to accelerate the structural change E1PCa2 → E2P + 2Ca2+. The enhancement is probably expedited by control of the proper N domain motion toward the P domain. As noted above, ΔΔG‡ due to the electrostatic energy is obviously too small to be the sole motive force. A large proportion may come from the thermal Brownian motion but then, for efficiency, the isotropic motion needs to be converted into anisotropic motion. The N-P domain electric field likely assists by guiding the N domain motion and thus accelerates the functionally required proper domain motion in the EP transition.
Acknowledgments
We thank Dr. David H. MacLennan, University of Toronto, for his generous gift of SERCA1a cDNA and Dr. Randal J. Kaufman, Genetics Institute, Cambridge, MA, for his generous gift of the expression vector pMT2. We thank Dr. Chikashi Toyoshima, University of Tokyo, for helpful discussions. We are grateful to Dr. David B. McIntosh for help in improving the manuscript.
This work was supported by a Grant-in-Aid for Scientific Research (C) (to K. Y.) and (B) (to H. S.) from the Ministry of Education, Culture, Sports, Science, and Technology of Japan.
- SERCA1a
- adult fast-twitch skeletal muscle sarcoplasmic reticulum Ca2+-ATPase
- EP
- phosphoenzyme
- E1Ca2
- Ca2+-bound enzyme
- E2
- Ca2+-unbound enzyme
- E1P
- ADP-sensitive phosphoenzyme
- E2P
- ADP-insensitive phosphoenzyme
- APBS
- adaptive Poisson-Boltzmann solver
- PDB
- Protein Data Bank.
REFERENCES
- 1. Toyoshima C., Nakasako M., Nomura H., Ogawa H. (2000) Crystal structure of the calcium pump of sarcoplasmic reticulum at 2.6-Å resolution. Nature 405, 647–655 [DOI] [PubMed] [Google Scholar]
- 2. Danko S., Yamasaki K., Daiho T., Suzuki H., Toyoshima C. (2001) Organization of cytoplasmic domains of sarcoplasmic reticulum Ca2+-ATPase in E1P and E1ATP states. A limited proteolysis study. FEBS Lett. 505, 129–135 [DOI] [PubMed] [Google Scholar]
- 3. Toyoshima C., Nomura H. (2002) Structural changes in the calcium pump accompanying the dissociation of calcium. Nature 418, 605–611 [DOI] [PubMed] [Google Scholar]
- 4. Danko S., Yamasaki K., Daiho T., Suzuki H. (2004) Distinct natures of beryllium fluoride-bound, aluminum fluoride-bound, and magnesium fluoride-bound stable analogues of an ADP-insensitive phosphoenzyme intermediate of sarcoplasmic reticulum Ca2+-ATPase. J. Biol. Chem. 279, 14991–14998 [DOI] [PubMed] [Google Scholar]
- 5. Toyoshima C., Mizutani T. (2004) Crystal structure of the calcium pump with a bound ATP analogue. Nature 430, 529–535 [DOI] [PubMed] [Google Scholar]
- 6. Toyoshima C., Nomura H., Tsuda T. (2004) Lumenal gating mechanism revealed in calcium pump crystal structures with phosphate analogues. Nature 432, 361–368 [DOI] [PubMed] [Google Scholar]
- 7. Sørensen T. L., Møller J. V., Nissen P. (2004) Phosphoryl transfer and calcium ion occlusion in the calcium pump. Science 304, 1672–1675 [DOI] [PubMed] [Google Scholar]
- 8. Toyoshima C., Norimatsu Y., Iwasawa S., Tsuda T., Ogawa H. (2007) How processing of aspartylphosphate is coupled to lumenal gating of the ion pathway in the calcium pump. Proc. Natl. Acad. Sci. U.S.A. 104, 19831–19836 [DOI] [PMC free article] [PubMed] [Google Scholar]
- 9. Olesen C., Picard M., Winther A. M., Gyrup C., Morth J. P., Oxvig C., Møller J. V., Nissen P. (2007) The structural basis of calcium transport by the calcium pump. Nature 450, 1036–1042 [DOI] [PubMed] [Google Scholar]
- 10. Toyoshima C. (2008) Structural aspects of ion pumping by Ca2+-ATPase of sarcoplasmic reticulum. Arch. Biochem. Biophys. 476, 3–11 [DOI] [PubMed] [Google Scholar]
- 11. Toyoshima C. (2009) How Ca2+-ATPase pumps ions across the sarcoplasmic reticulum membrane. Biochim. Biophys. Acta 1793, 941–946 [DOI] [PubMed] [Google Scholar]
- 12. Danko S., Daiho T., Yamasaki K., Liu X., Suzuki H. (2009) Formation of the stable structural analog of ADP-sensitive phosphoenzyme of Ca2+-ATPase with occluded Ca2+ by beryllium fluoride. J. Biol. Chem. 284, 22722–22735 [DOI] [PMC free article] [PubMed] [Google Scholar]
- 13. Møller J. V., Olesen C., Winther A. M., Nissen P. (2010) The sarcoplasmic Ca2+-ATPase. Design of a perfect chemi-osmotic pump. Q. Rev. Biophys. 43, 501–566 [DOI] [PubMed] [Google Scholar]
- 14. Kato S., Kamidochi M., Daiho T., Yamasaki K., Gouli W., Suzuki H. (2003) Val200 residue in Lys189-Lys205 outermost loop on the A domain of sarcoplasmic reticulum Ca2+-ATPase is critical for rapid processing of phosphoenzyme intermediate after loss of ADP sensitivity. J. Biol. Chem. 278, 9624–9629 [DOI] [PubMed] [Google Scholar]
- 15. Wang G., Yamasaki K., Daiho T., Suzuki H. (2005) Critical hydrophobic interactions between phosphorylation and actuator domains of Ca2+-ATPase for hydrolysis of phosphorylated intermediate. J. Biol. Chem. 280, 26508–26516 [DOI] [PubMed] [Google Scholar]
- 16. Ma H., Lewis D., Xu C., Inesi G., Toyoshima C. (2005) Functional and structural roles of critical amino acids within the “N,” “P,” and “A” domains of the Ca2+ ATPase (SERCA) headpiece. Biochemistry 44, 8090–8100 [DOI] [PubMed] [Google Scholar]
- 17. Yamasaki K., Wang G., Daiho T., Danko S., Suzuki H. (2008) Roles of Tyr122-hydrophobic cluster and K+ binding in Ca2+-releasing process of ADP-insensitive phosphoenzyme of sarcoplasmic reticulum Ca2+-ATPase. J. Biol. Chem. 283, 29144–29155 [DOI] [PMC free article] [PubMed] [Google Scholar]
- 18. Daiho T., Yamasaki K., Wang G., Danko S., Iizuka H., Suzuki H. (2003) Deletions of any single residues in Glu40-Ser48 loop connecting A domain and the first transmembrane helix of sarcoplasmic reticulum Ca2+-ATPase result in almost complete inhibition of conformational transition and hydrolysis of phosphoenzyme intermediate. J. Biol. Chem. 278, 39197–39204 [DOI] [PubMed] [Google Scholar]
- 19. Daiho T., Yamasaki K., Danko S., Suzuki H. (2007) Critical role of Glu40-Ser48 loop linking actuator domain and first transmembrane helix of Ca2+-ATPase in Ca2+ deocclusion and release from ADP-insensitive phosphoenzyme. J. Biol. Chem. 282, 34429–34447 [DOI] [PubMed] [Google Scholar]
- 20. Daiho T., Danko S., Yamasaki K., Suzuki H. (2010) Stable structural analog of Ca2+-ATPase ADP-insensitive phosphoenzyme with occluded Ca2+ formed by elongation of A-domain/M1′-linker and beryllium fluoride binding. J. Biol. Chem. 285, 24538–24547 [DOI] [PMC free article] [PubMed] [Google Scholar]
- 21. Baker N. A., Sept D., Joseph S., Holst M. J., McCammon J. A. (2001) Electrostatics of nanosystems. Application to microtubules and the ribosome. Proc. Natl. Acad. Sci. U.S.A. 98, 10037–10041 [DOI] [PMC free article] [PubMed] [Google Scholar]
- 22. Weber K., Osborn M. (1969) The reliability of molecular weight determinations by dodecyl sulfate-polyacrylamide gel electrophoresis. J. Biol. Chem. 244, 4406–4412 [PubMed] [Google Scholar]
- 23. Brönsted J. N. (1922) Studies on solubility. IV. The principle of the specific interaction of ions. J. Am. Chem. Soc. 44, 877–898 [Google Scholar]
- 24. Scatchard G. (1936) Concentrated solutions of strong electrolytes. Chem. Rev. 19, 309–327 [Google Scholar]
- 25. Guggenheim E. A., Turgeon J. C. (1955) Specific interaction of ions. Trans. Faraday Soc. 51, 747–761 [Google Scholar]
- 26. Sali A., Blundell T. L. (1993) Comparative protein modelling by satisfaction of spatial restraints. J. Mol. Biol. 234, 779–815 [DOI] [PubMed] [Google Scholar]
- 27. Dolinsky T. J., Nielsen J. E., McCammon J. A., Baker N. A. (2004) PDB2PQR. An automated pipeline for the setup of Poisson-Boltzmann electrostatics calculations. Nucleic Acids Res. 32, W665–W667 [DOI] [PMC free article] [PubMed] [Google Scholar]
- 28. Fersht A. R. (1999) Structure and Mechanism in Protein Science, W. H. Freeman and Co., New York [Google Scholar]
- 29. Humphrey W., Dalke A., Schulten K. (1996) VMD. Visual molecular dynamics. J. Mol. Graph. 14, 33–38 [DOI] [PubMed] [Google Scholar]
- 30. Lowry O. H., Rosebrough N. J., Farr A. L., Randall R. J. (1951) Protein measurement with the folin phenol reagent. J. Biol. Chem. 193, 265–275 [PubMed] [Google Scholar]
- 31. Shigekawa M., Pearl L. J. (1976) Activation of calcium transport in skeletal muscle sarcoplasmic reticulum by monovalent cations. J. Biol. Chem. 251, 6947–6952 [PubMed] [Google Scholar]
- 32. Sørensen T. L., Clausen J. D., Jensen A. M., Vilsen B., Møller J. V., Andersen J. P., Nissen P. (2004) Localization of a K+-binding site involved in dephosphorylation of the sarcoplasmic reticulum Ca2+-ATPase. J. Biol. Chem. 279, 46355–46358 [DOI] [PubMed] [Google Scholar]
- 33. Clausen J. D., McIntosh D. B., Anthonisen A. N., Woolley D. G., Vilsen B., Andersen J. P. (2007) ATP-binding modes and functionally important interdomain bonds of sarcoplasmic reticulum Ca2+-ATPase revealed by mutation of glycine 438, glutamate 439, and arginine 678. J. Biol. Chem. 282, 20686–20697 [DOI] [PubMed] [Google Scholar]
- 34. Liu X., Daiho T., Yamasaki K., Wang G., Danko S., Suzuki H. (2009) Roles of interaction between actuator and nucleotide binding domains of sarco(endo)plasmic reticulum Ca2+-ATPase as revealed by single and swap mutational analyses of serine 186 and glutamate 439. J. Biol. Chem. 284, 25190–25198 [DOI] [PMC free article] [PubMed] [Google Scholar]
- 35. Schreiber G., Fersht A. R. (1996) Rapid, electrostatically assisted association of proteins. Nat. Struct. Biol. 3, 427–431 [DOI] [PubMed] [Google Scholar]
- 36. Yamasaki K., Daiho T., Danko S., Suzuki H. (2010) Ca2+ release to lumen from ADP-sensitive phosphoenzyme E1PCa2 without bound K+ of sarcoplasmic reticulum Ca2+-ATPase. J. Biol. Chem. 285, 38674–38683 [DOI] [PMC free article] [PubMed] [Google Scholar]
- 37. Wakabayashi S., Shigekawa M. (1984) Role of divalent cation bound to phosphoenzyme intermediate of sarcoplasmic reticulum ATPase. J. Biol. Chem. 259, 4427–4436 [PubMed] [Google Scholar]
- 38. Punzengruber C., Prager R., Kolassa N., Winkler F., Suko J. (1978) Calcium gradient-dependent and calcium gradient-independent phosphorylation of sarcoplasmic reticulum by orthophosphate. Eur. J. Biochem. 92, 349–359 [DOI] [PubMed] [Google Scholar]


