Abstract
Purpose.
To investigate photoreceptor and postreceptor retinal function in patients with congenital stationary night blindness (CSNB).
Methods.
Forty-one patients with CSNB (ages 0.19–32 years) were studied. ERG responses to a series of full-field stimuli were obtained under scotopic and photopic conditions and were used to categorize the CSNB patients as complete (cCSNB) or incomplete (iCSNB). Rod and cone photoreceptor (RROD, SROD, RCONE, SCONE) and rod-driven postreceptor (VMAX, log σ) response parameters were calculated from the a- and b-waves. Cone-driven responses to 30 Hz flicker and ON and OFF responses to a long duration (150 ms) flash were also obtained. Dark-adapted thresholds were measured. Analysis of variance was used to compare data from patients with cCSNB, patients with iCSNB, and controls.
Results.
We found significant reduction in saturated photoreceptor amplitude (RROD, RCONE) but normal photoreceptor sensitivity (SROD, SCONE) in both CSNB groups. Rod-driven postreceptor response amplitude (VMAX) and sensitivity (log σ) were significantly reduced in CSNB. Log σ was significantly worse in cCSNB than in iCSNB; this was the only scotopic parameter that differed between the two CSNB groups. Photopic b-wave amplitude increased monotonically with stimulus strength in CSNB patients rather than showing a normal photopic hill. The amplitude of the 30-Hz flicker response was reduced compared with controls, more so in iCSNB than in cCSNB. The mean dark-adapted threshold was significantly elevated in CSNB, more so in cCSNB than in iCSNB.
Conclusions.
These results are evidence of normal photoreceptor function (despite the low saturated photoresponse amplitude) and anomalous postreceptor retinal circuitry.
Keywords: congenital stationary night blindness, electroretinogram, dark-adapted threshold, photoreceptor, postreceptor
We investigated photoreceptor and postreceptor retinal function in patients with congenital stationary night blindness (CSNB). We found normal photoreceptor function and evidence of anomalous postreceptor retinal circuitry.
Introduction
Congenital stationary night blindness (CSNB) is a group of retinal conditions generally characterized by subnormal visual acuity and poor vision in dim light.1–4 High myopia at a young age, nystagmus, and strabismus are common in CSNB.5,6 CSNB is considered nonprogressive, although exceptions have been noted. A number of genetic mutations associated with CSNB have been identified.7–19
Clinical diagnosis of CSNB is typically based on a characteristic negative ERG waveform in which the ratio of the scotopic b-wave to a-wave amplitude is less than one. This is ordinarily attributed to a defect in transmission from photoreceptors to second-order cells.6,20 Consistent with normal rod function,21 the amplitude of the ERG a-wave is usually normal in CSNB,22,23 although reduced a-wave amplitude has been reported in some patients.21,24–28 Furthermore, the rhodopsin density and kinetics of regeneration, assessed using reflection densitometry, are normal in some patients29,30 but abnormal in others.31 In the photopic conditions that have been studied, results suggest altered retinal circuitry.22,25,28,32,33
CSNB is classified as either complete (cCSNB) or incomplete (iCSNB).1,34 In cCSNB, the defect is localized to the ON bipolar cell and alters transmission of the photoreceptor signal to the bipolar cell. In iCSNB, the defect is localized to the photoreceptor terminal and alters transmission from photoreceptors to both ON and OFF bipolar cells.2,6,35
The goal of the present study was to investigate retinal function in CSNB using contemporary ERG procedures and analyses. We analyzed the activation of phototransduction and postreceptor function and assessed the relationship of photoreceptor to postreceptor activity. Our overall aim is to delineate the retinal circuitry in patients with CSNB.
Methods
Subjects
Forty-one patients (34 males, 7 females) with CSNB were studied. All but two were myopic. Corrected letter acuity, tested in 31 patients, was reduced. Grating acuity,36 tested in the remaining 10 patients who were younger than 2.5 years, was below the 95% prediction limits of normal for age in all but one.
To classify the patients as either cCSNB or iCSNB, we used characteristics of both the scotopic and photopic ERG response.3,37 For the dark-adapted response to a 3.35 cd·s/m2 stimulus, all 41 patients had a negative ERG waveform; that is, the ratio of b-wave amplitude to a-wave amplitude was less than 1. Additionally, all had a reduced or absent response to a dim flash (0.11 cd·s/m2). Thirty-five of the 41 were tested in photopic conditions. Twenty-one of the patients were categorized as cCSNB and 14 as iCSNB; their clinical characteristics are listed in Table 1.
Table 1.
Clinical Characteristics of Patients With cCSNB and iCSNB
|
cCSNB, n
= 21 |
iCSNB, n
= 14 |
|||
|
Median |
Range |
Median |
Range |
|
| Age, y | 6.5 | 0.19 to 20 | 9.0 | 0.86 to 32 |
| Letter acuity, logMAR [Snellen] | 0.40 [20/50] | 0.18 to 0.60 [20/25 to 20/80] | 0.54 [20/70] | 0.30 to 1.00 [20/40 to 20/100] |
| Grating acuity, cpd | 3.9 | 2.2 to 4.5 | 3.1 | 1.3 to 4.5 |
| Spherical equivalent, D | −7.25 | −13.75 to +1.00 | −4.88 | −10.50 to +1.75 |
|
Number |
Percent |
Number |
Percent |
|
| Nystagmus | 13 | 62 | 9 | 64 |
| Strabismus | 13 | 62 | 4 | 29 |
| Paradoxical pupillary response | 14 | 67 | 1 | 7 |
We did not classify the six patients who were not tested in photopic conditions. The diagnosis of CSNB was appropriate in these six because all had a negative ERG waveform, normal fundi, and significantly elevated dark-adapted thresholds.
ERG responses were recorded from 61 healthy control subjects recruited for prior studies; the a- and b-wave data from the majority of these subjects have been reported previously.38 Dark-adapted thresholds were obtained from 26 control subjects; these data have also been reported previously.39 All control subjects had best corrected logMAR letter acuity of 0.1 (20/25) or better. The spherical equivalent of control subjects ranged from −10.25 to +3.00 (median −1.41) diopters. For purposes of analysis, we designated subjects with myopia of 4.00 diopters or more as myopic controls (n = 17).
The patients' data were collected as part of their clinical care and were analyzed with approval of the Boston Children's Hospital Committee on Clinical Investigation (CCI). Control subjects were recruited and tested with approval from the CCI. The study conformed to the tenets of the Declaration of Helsinki. Written informed consent was obtained from control subjects, consent from the parents of minors, and assent from subjects age 8 to 18 years.
Procedures
Electroretinography.
Pupils of the CSNB patients were dilated with cyclopentolate hydrochloride (1%) and phenylephrine (2.5%); control subjects were dilated with tropicamide (1%). The subject dark adapted for 30 minutes. Then, under dim red light, 0.5% proparacaine was instilled and a bipolar Burian-Allen electrode (Hansen Ophthalmic Development Laboratory, Coralville, IA) was placed on the cornea and a ground electrode on the skin over the mastoid.
Stimulus strength was measured using a calibrated photodiode (IL1700; International Light, Newburyport, MA) with a scotopic or photopic filter. For the dark-adapted eye with an 8-mm pupil, the maximum flash produced approximately 3.4 log scotopic troland seconds (scot td s). The 3.35 cd·s/m2 stimulus, which was used to identify the negative ERG waveform, and thus to diagnose CSNB, produced approximately 1.5 log scot td s. This is similar to the dark-adapted 3.0 International Society for Clinical Electrophysiology of Vision (ISCEV) standard stimulus condition.40 To estimate photopic trolands, we accounted for the Stiles Crawford effect by using an effective pupil area of 20 mm2 for the dilated 8 mm pupil.41
Twenty-two of the patients and 31 of the control subjects were tested using a Nicolet Compact 4 system (Nicolet Biomedical, Madison, WI). The remaining patients and controls were tested using an Espion system (Diagnosys, Lowell, MA). Differences in the stimuli, amplifiers, and data acquisition between these systems have been summarized.42 The bandpass for the amplifiers was 1 to 1000 Hz for the Nicolet system and 0.625 to 1000 Hz for the Espion system. For control subjects, no significant differences between Nicolet and Espion results were found for scotopic or photopic ERG parameters. Therefore, the results obtained using the two systems were combined.
Fourteen of the patients were tested under brief, light general anesthesia (Minimum Alveolar Concentration ∼1.0) that does not significantly affect the ERG parameters.43 The other patients (n = 27) and all control subjects were tested awake.
Dark-Adapted Rod and Rod-Driven Activity.
Responses to full field, brief (<3 ms), blue stimuli were recorded over an approximately 5 log unit range (from −2–3 log scot td s); stimuli were incremented in 0.3 log unit steps. Responses contaminated by artifacts such as blinks and eye movements were rejected. Two to 16 responses were averaged in each stimulus condition. The interstimulus interval ranged from 2 to 60 seconds. Digitized responses were amplified, displayed and stored for analysis. The amplitude and implicit time of the a- and b-wave responses were measured and examined as a function of stimulus strength.
Rod photoreceptor function was assessed using ensemble fits of the Hood and Birch44 formulation of the Lamb and Pugh model of the activation of phototransduction.45,46 A curve-fitting routine (fminsearch/fmin subroutine; Matlab; The Mathworks, Natick, MA) was used to determine the best-fitting values of SROD [(scot td)−1 s−3], RROD (μV), and a brief delay td (seconds) in the following equation:
 |
In this equation, I is the stimulus in scot td s and RROD (μV) is the saturated response amplitude. SROD scales the response with stimulus strength44 and is related to the amplification constant in the Lamb and Pugh model.45 Equation 1 was fit to the leading edge of the a-wave up to the trough or to a maximum of 20 ms. All parameters were free to vary.
The rod-driven b-wave stimulus/response function47 was summarized by
 |
that was fit to the b-wave amplitudes of each subject. In this equation, V is the b-wave amplitude produced by stimulus I (scot td s), VMAX (μV) is the saturated amplitude, and σ is the stimulus that evokes a half-maximum b-wave amplitude. Thus, 1/σ is a measure of b-wave sensitivity. The function was fit only to those stimuli at which substantial a-wave intrusion did not occur.48 Under these conditions, the b-wave represents activity mainly in the rod-driven ON bipolar and other postreceptor retinal cells.49–51
Light-Adapted Cone and Cone-Driven Activity.
In 29 of the 41 patients, cone and cone-driven responses were recorded to a range of red flashes (0.3–35 cd·s/m2) presented on a steady, white rod-saturating background (25.5 cd/m2). Cone photoresponse parameters were calculated by fit of a model of the activation of phototransduction to the first 5.5 ms of the a-wave. A cascaded RC filter models the capacitance of the cone membrane by numerical convolution of the filter output with the Gaussian function.52 The equation is
 |
where RCONE is the saturated response amplitude (μV), SCONE a gain parameter [(phot td)−1 s−3], td (seconds) a brief delay, and τ the time constant of the RC filter (1.8 ms). The symbol * represents the convolution operation. The amplitude and implicit time of the a-wave and b-wave responses were examined as a function of stimulus strength.
Thirty-one of the 41 patients also had photopic function tested with a 30-Hz flickering stimulus of 2.25 cd·s/m2. Additionally, when we noticed that the photopic stimulus response function in the CSNB group did not show a photopic hill,53 we added a long-duration (150 ms) white flash (200 cd/m2) presented on a steady background (42 cd/m2) to evaluate the OFF response of cone bipolar cells.54 Ten of the patients were tested with the long flash. The amplitude and time to peak of the response to the 30-Hz stimulus and the amplitude and implicit time of the ON response (b-wave) and OFF response (d-wave) to the long flash were measured.
Dark-Adapted Visual Threshold.
Thresholds were measured using a two-alternative, spatial, forced-choice psychophysical procedure. Following 30 minutes of dark adaptation, the subject's gaze was attracted to a small (30 minute arc) flickering (1 Hz) red LED fixation target at the center of a dark screen. When the subject was alert and looking at the fixation target, a blue (λ < 510 nm) stimulus (10° deg diameter, 50 ms duration) was presented 20° to the left or the right of the fixation target. For young children, on every trial, an adult observer reported stimulus location (right or left) based on the child's head and/or eye movements and received feedback. Older subjects pointed to the stimulus or reported verbally the stimulus location. A staircase method55 was used to estimate threshold. Threshold was obtained in 40 of the 41 patients with CSNB. For CSNB patients tested awake, the ERG and dark-adapted visual threshold (DAT) were measured on the same day. When the ERG was done under anesthesia, thresholds were measured on a different day.
Statistical Analyses
Although the clinical testing had been performed on both eyes, ERG data from one eye of each patient were analyzed. The eye with the better scotopic b-wave sensitivity (log σ) was selected. ANOVA was used to compare data from patients with cCSNB, patients with iCSNB, and controls. Post hoc comparisons were made using the Bonferroni test. The uncategorized patients (n = 6) were not included in the analyses. The Mann-Whitney U test was used to compare long-flash results in cCSNB patients and controls; this nonparametric test was used because criteria for equal variance between groups was not met. The significance level of all tests was α less than or equal to 0.01. Linear regression analysis was used to evaluate ERG parameters for significant relationship to refractive error (spherical equivalent). We also evaluated rod photoreceptor parameters (SROD and RROD) for significant relationship to postreceptor parameters (log σ and VMAX).
Results
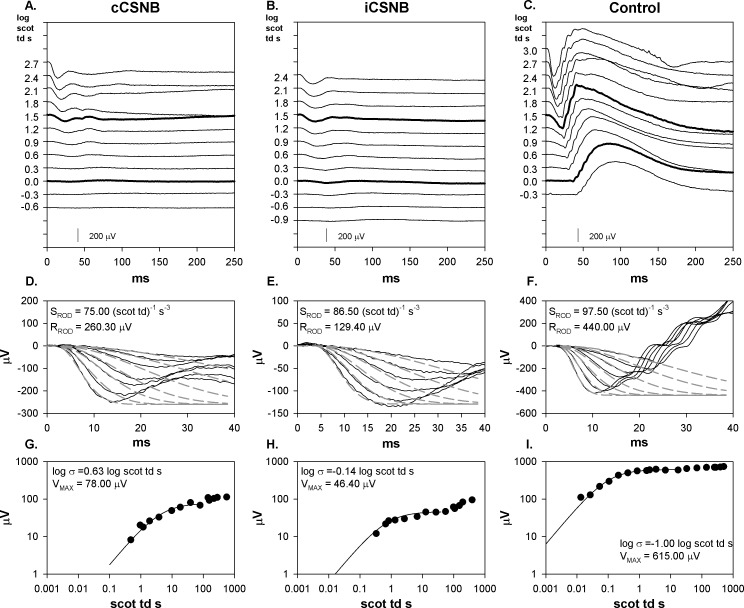
Sample scotopic ERG records for cCSNB, iCSNB, and control subjects are shown in Figures 1A through 1C. Both cCSNB and iCSNB patients show a negative waveform with much reduced b-wave amplitude compared with the control. Fits of a model of activation of rod phototransduction are shown in Figures 1D through 1F. The results show normal SROD but low saturated rod amplitude (RROD) in cCSNB and iCSNB. The CSNB b-wave stimulus response functions (Figs. 1G, 1H) are characterized by low b-wave sensitivity (log σ) and low saturated amplitude (VMAX) compared with controls (Fig. 1I).
Figure 1.
Sample scotopic (dark-adapted) ERG records and model fits to a- and b-waves from a cCSNB patient, iCSNB patient, and control subject. (A–C) ERG responses to a series of flashes. Flash strength in log scot td s is indicated to the left of the traces. The responses to the stimuli equivalent to the ISCEV dark-adapted 0.01 and 3.0 condition are represented by a thicker line. (D–F) The first 40 ms of the response (solid lines) and the model fits of equation 1 to the leading edge of the a-wave (dashed lines). The calculated values of SROD and RROD are indicated. Note that the scale on the vertical axes in these three panels differ. (G–I) B-wave amplitude plotted as a function of stimulus strength. The smooth curve represents equation 2. The calculated values of log σ and VMAX are indicated.
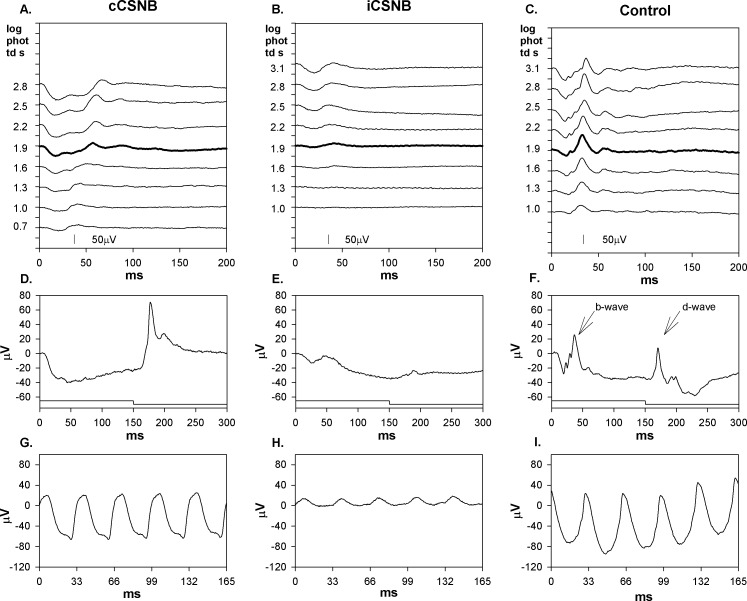
Sample photopic records are shown in Figures 2A through 2C. In CSNB patients, the amplitude of the photopic b-wave increased with stimulus strength, whereas controls showed a photopic hill; that is, at higher stimulus strengths (2.5–3.1 log phot td s), amplitude decreased. In controls (Fig. 2F), the response to the long flash shows both b-wave and d-wave. In cCSNB (Fig. 2D), the response shows little or no b-wave and normal d-wave. In iCSNB (Fig. 2E), the response shows small b-wave and small d-wave.
Figure 2.
Sample photopic (light-adapted) ERG records from the same subjects as in Figure 1. (A–C) ERG responses to a series of flashes. Flash strength in log phot td s is indicated to the left of the traces. The response to the stimulus equivalent to the ISCEV light adapted 3.0 condition is represented by a thicker line. (D–F) Responses to a long (150 ms) flash; the stimulus onset and offset are indicated below the responses. The b-wave (ON) and d-wave (OFF) components are indicated by arrows in panel (F). (G, H) Responses to 30 Hz flickering light.
The photoreceptor and postreceptor ERG parameters (mean ± SD) of CSNB patients and controls are summarized in Table 2; the results of the statistical analyses are also shown.
Table 2.
ERG Photoreceptor and Postreceptor Parameters in cCSNB Patients, iCSNB Patients, and All Control Subjects
|
Parameter |
cCSNB |
iCSNB |
Control |
Statistics |
||||||
|
Mean |
SD |
n |
Mean |
SD |
n |
Mean |
SD |
n |
||
| Scotopic | ANOVA | |||||||||
| Log SROD (scot td−1)s−3 | 1.91 | 0.07 | 21 | 1.93 | 0.62 | 14 | 1.95 | 0.07 | 58 | F = 2.331; df = 2, 90; ns |
| RROD, μV | 253.96 | 59.60 | 21 | 225.62 | 73.55 | 14 | 382.34 | 70.78 | 58 | F = 45.618; df = 2, 90; P < 0.01 |
| Log σ | 1.14 | 0.51 | 21 | 0.13 | 0.48 | 14 | −0.80 | 0.12 | 61 | F = 313.773; df = 2, 93; P < 0.01 |
| VMAX, μV | 91.71 | 40.56 | 21 | 88.28 | 31.86 | 14 | 410.02 | 78.33 | 61 | F = 255.099; df = 2, 93; P < 0.01 |
| Photopic | ANOVA | |||||||||
| Log SCONE (phot td−1)s−3 | 1.44 | 0.15 | 17 | 1.51 | 0.10 | 12 | 1.52 | 0.11 | 25 | F = 2.474; df = 2, 51; ns |
| RCONE, μV | 49.53 | 24.09 | 17 | 32.28 | 14.15 | 12 | 77.48 | 22.03 | 25 | F = 20.520; df = 2, 51; P < 0.01 |
| 30-Hz flicker | ||||||||||
| Amplitude, μV | 77.23 | 19.50 | 20 | 17.83 | 10.62 | 11 | 119.80 | 43.05 | 35 | F = 40.438; df = 2, 63; P < 0.01 |
| Time to peak, ms | 33.65 | 3.77 | 20 | 35.40 | 3.89 | 11 | 28.25 | 2.03 | 35 | F = 34.619; df = 2, 63; P < 0.01 |
| Long flash d-wave | Mann-Whitney U | |||||||||
| Amplitude, μV | 64.75 | 30.88 | 9 | 35.49 | 10.49 | 22 | ns | |||
| Implicit time, ms | 176.72 | 2.72 | 9 | 171.98 | 1.29 | 22 | U = 21; P < 0.01 | |||
ns, nonsignificant.
Rod and Rod-Driven Activity
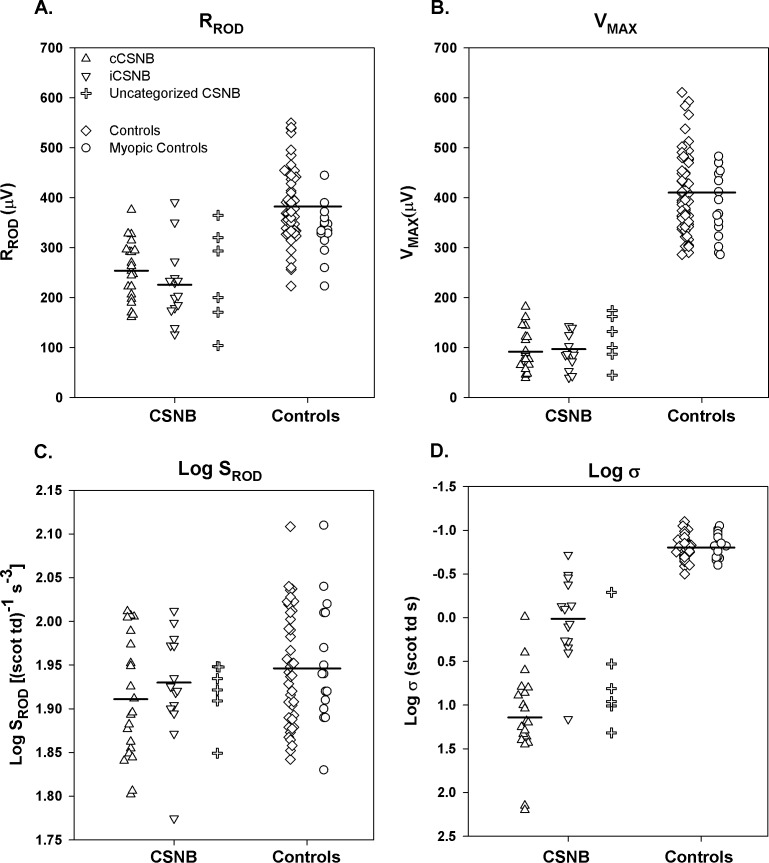
Saturated amplitudes (RROD and VMAX) were significantly lower in CSNB patients than in controls but did not differ between cCSNB and iCSNB (Figs. 3A, 3B). Photoreceptor sensitivity (log SROD) did not differ between CSNB patients and controls (Fig. 3C). Postreceptor sensitivity (log σ), however, was significantly worse in CSNB patients than in controls (Fig. 3D); that is, a brighter stimulus was required to produce a half maximum b-wave amplitude in the former. Patients with cCSNB had significantly poorer log σ compared to those with iCSNB.
Figure 3.
Rod and rod-mediated ERG parameters in cCSNB (upright triangles), iCSNB (inverted triangles), uncategorized CSNB (plus sign), control subjects (diamonds), and myopic control subjects (circles). (A) RROD, (B) VMAX, (C) Log SROD, and (D) Log σ. Each point represents one subject. The horizontal bars indicate the means for cCSNB patients, for iCSNB patients, and for all control subjects.
We found no relationships between rod photoreceptor and rod-driven postreceptor response parameters in our patients. For the sensitivity parameters, deficits in log σ, which were significant and broadly distributed (Fig. 3D), were not related to log SROD, the values of which were almost entirely within the range found in control subjects (Fig. 3C). For the amplitude parameters, the relationship of saturated b-wave amplitude (VMAX; Fig. 3B) and saturated rod amplitude (RROD; Fig. 3A) was not significant. We interpret these results as consistent with a defect in transmission from rods to postreceptor cells.
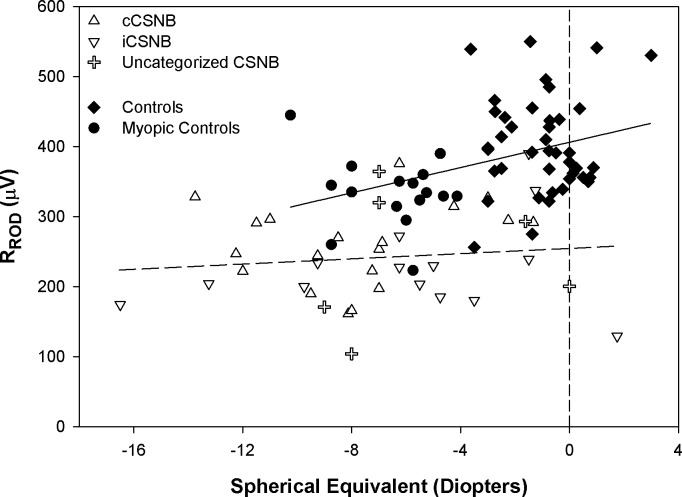
RROD as a function of spherical equivalent is shown in Figure 4. In controls, RROD decreased as the amount of myopia increased. In the CSNB patients (all categories combined), there was no significant relationship, indicating no effect of refractive error on response amplitude. The zero intercept for the CSNB group differed from that in controls (normal and myopic combined) by approximately 150 μV. This offset indicates that deficits in RROD in CSNB cannot be due solely to myopia.
Figure 4.
RROD as a function of spherical equivalent (diopters) for cCSNB (upright triangles), iCSNB (inverted triangles), uncategorized CSNB (plus sign), control subjects (diamonds), and myopic control subjects (circles). The regression fit to all control data is represented by the solid line (y = 9.03x + 406.21) and to all patient data by the dashed line (y = 1.9x + 254.6). The vertical dashed line represents the zero diopter intercept.
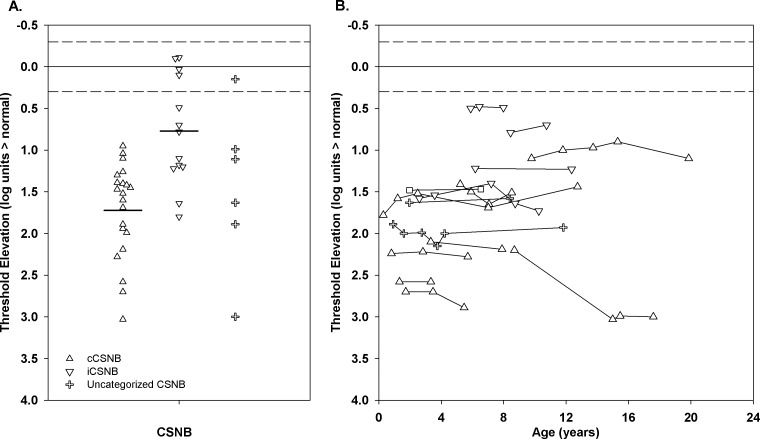
Figure 5A shows the results of the first measurement of DAT in the patients; the median age at first test was 6 years. All but five subjects had significantly elevated threshold. The median threshold was 1.40 (range, −0.11–3.03) log units above normal. Threshold elevation was significantly greater (t = 4.5, df = 32, P < 0.01) in the patients with cCSNB (mean 1.72 [range, 0.95–3.03] log units) than in those with iCSNB (mean 0.77 [range, −0.11–1.80] log units). Figure 5B shows repeated measurements of DAT over a 2- to 10-year span in 15 patients. In 14, the thresholds were quite stable; in one, elevation increased 0.8 log unit, which is less than the 1 log unit defined as a significant change in threshold.39 DAT and postreceptor b-wave sensitivity (log σ) in our patients with CSNB were significantly correlated (r = 0.46; P < 0.01).
Figure 5.
(A) The first DAT measurement for cCSNB (upright triangles), iCSNB (inverted triangles), and uncategorized CSNB (plus sign). The horizontal bars indicate the means for the cCSNB and iCSNB patients. (B) DAT as a function of age for patients who were tested at least twice. In both panels, the solid line represents the mean and the dashed lines represent ±2 SD for control subjects.
Cone and Cone-Driven Activity
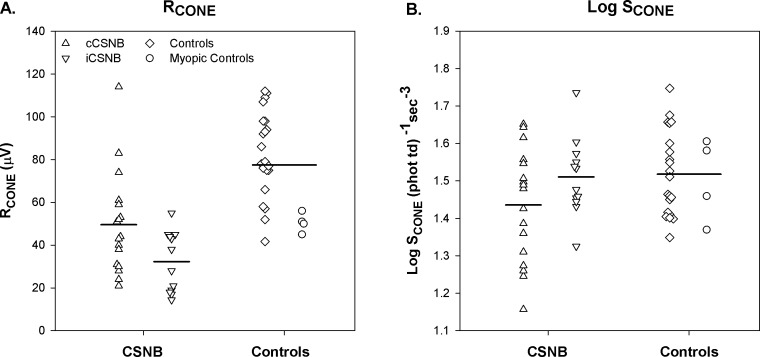
The photopic ERG data are summarized in the lower half of Table 2. The cone photoreceptor parameters, RCONE and log SCONE, for the patients and control subjects, are shown in Figure 6. RCONE was significantly lower in both cCSNB and iCSNB patients than in controls. There was no significant difference in log SCONE between patients and controls.
Figure 6.
Cone photoresponse parameters in cCSNB (upright triangles), iCSNB (inverted triangles), control subjects (diamonds), and myopic control subjects (circles). (A) RCONE, (B) Log SCONE. The horizontal bars indicate the means for cCSNB patients, for iCSNB patients, and for all control subjects.
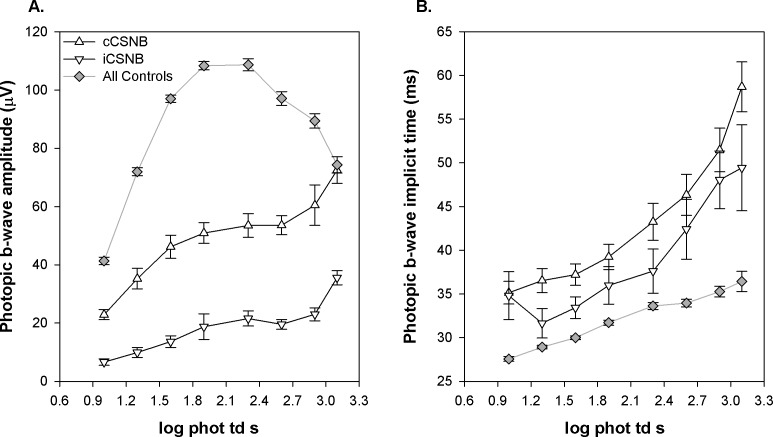
Figure 7 shows mean (±SEM) photopic b-wave amplitude as a function of stimulus strength. In both cCSNB and iCSNB, amplitude was lower than in controls and did not show a photopic hill53 (Fig. 7A). Mean b-wave implicit time was delayed in both patient groups across all intensities compared with controls (Fig. 7B).
Figure 7.
Photopic b-wave amplitude and implicit time plotted as a function of flash strength in cCSNB (upright triangles), iCSNB (inverted triangles), and all control subjects, including those with myopia (gray diamonds). (A) Amplitude. (B) Implicit time. The 1.9 log phot td s stimulus corresponds to the ISCEV light-adapted photopic 3.0 condition.
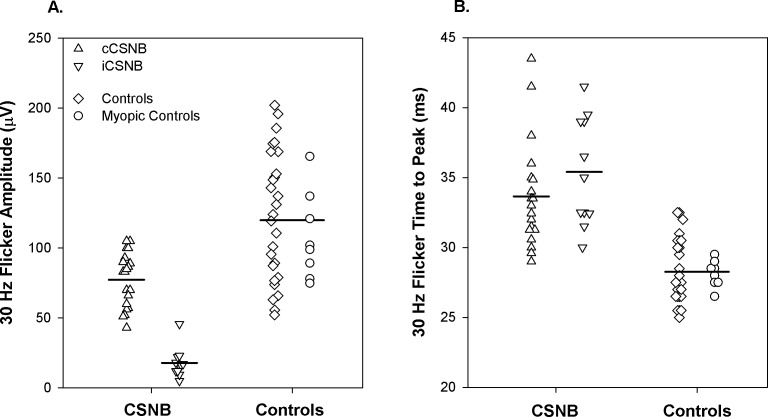
Amplitude of the response to the 30-Hz stimulus was significantly lower in CSNB than in controls (Fig. 8A). Amplitude was significantly smaller in iCSNB than in cCSNB. Time to peak differed significantly between patients and controls but did not differ between cCSNB and iCSNB (Fig. 8B).
Figure 8.
The 30-Hz flicker for the cCSNB (upright triangles), iCSNB (inverted triangles), control subjects (diamonds), and myopic control subjects (circles) for (A) amplitude and (B) time to peak. Each point represents one subject. The horizontal bars indicate the means for cCSNB patients, for iCSNB patients, and for all control subjects.
Of the 10 patients with CSNB who were tested with the long-duration (150 ms) flash, 9 had cCSNB. The b-wave (ON response) was markedly reduced in all nine (<6.5 μV), but all had a prominent d-wave (OFF response). The mean implicit time of the d-wave was prolonged compared with control subjects (Table 2). The one patient with iCSNB had reduced b- and d-wave amplitude and prolonged implicit time compared with controls.
Discussion
Our quantitative assessment of photoreceptor activity (a-wave responses) showed significant reductions in amplitude parameters (RROD and RCONE) in patients with CSNB. Photoreceptor sensitivity (SROD and SCONE) estimated from the models (equations 1 and 3) did not differ between patients and controls; this is evidence that activation of phototransduction is normal in these patients. Significant deficits in postreceptor activity were found for both rod-driven and cone-driven responses. Consistent with the hypothesis that there is a functional disconnect between the photoreceptors and postreceptor neural retina in CSNB,1,6,20,35 we found no significant relationship between rod and rod-driven postreceptor response parameters.
Low RROD could be explained by a reduction either in rod outer segment length or in the number of rod photoreceptors. However, no changes in retinal structure were apparent in two anatomic studies of eyes with CSNB.56,57 Retinal imaging using adaptive optics found normal rod density (cells/area) 10° from fixation and a normal rod photoreceptor mosaic in the perifoveal region in patients with CSNB.58 Thus, the significant deficits in RROD found in our patients must have some other explanation. Jamison et al.59 used APB (2-amino-4-phosphonobutyric acid) to block the activity of simian ON bipolar cells and found that RROD decreased but SROD did not change. They concluded that the postreceptor cells scaled the rod dark current leading to the decrease in a-wave amplitude and low RROD. Perhaps the low RROD values in our patients are explained by this mechanism, by the absence of early postreceptor components,60 or by an as yet unidentified feedback mechanism or anomalous cell-to-cell interaction.
Under rod-mediated conditions, the normal postreceptor b-wave reflects the activity of ON bipolar cells and other second- and third-order neurons.49–51,61,62 In our patients, we designated the small positive potential that followed the a-wave as the b-wave and used it to estimate postreceptor activity (Figs. 1, 3). Over the stimulus range used to fit equation 2, the implicit time of this potential was similar to that in controls, and at higher stimulus strengths, the implicit time of this potential was shorter than in controls (Fig. 1). Other studies of CSNB have demonstrated similar shortening of b-wave implicit time.25,26 As for the mechanism, we are reminded that Jamison et al.59 showed that block of both ON and OFF pathways by administration of APB plus PDA (piperidine-dicarboxylic acid) led to short implicit time of the small positive potential following the a-wave. They speculated that this potential was produced by photoreceptors or other light-sensitive postreceptor cells rather than by bipolar cells. In intact human records, we cannot specify with certainty the origin of the small (b-wave) potential.
The photoreceptor results in photopic conditions were similar to those in scotopic conditions in that RCONE was significantly lower in patients than in controls but SCONE was normal (Fig. 6). The reduced amplitude and prolonged implicit time of the photopic b-wave in patients suggests defects in the ON pathway (Fig. 7). The photopic hill that characterizes the normal b-wave stimulus response function and is attributed to the interaction between ON and OFF bipolar cell activity63 was not found in our CSNB patients. A decrease in the amplitude of the ON bipolar cell response and a delay in the peak of the OFF response with increasing stimulus intensity is thought to account for the photopic hill in the normal cone-mediated ERG. Altered interplay between the ON and OFF bipolar circuitry may account in part for the lack of a photopic hill in CSNB. In the cCSNB patients who were tested with the long (150-ms) flash, the b-wave amplitude was markedly attenuated, indicating an ON pathway abnormality, coupled with prolonged d-wave implicit time, indicating an OFF pathway defect (Fig. 2D). Together these alterations in retinal circuitry could account for the absence of a photopic hill in cCSNB. Sustar et al.64 have reported abnormal long-flash responses in a larger sample of patients with CSNB.
We can find no explanation for the normal dark-adapted threshold in five of our patients (Fig. 5A). All five had a negative ERG, and four of the five had additional ERG characteristics of iCSNB; all had normal fundi on serial examinations. Prior studies of CSNB have reported dark-adapted thresholds ranging from 0.5 to 3.6 log units above normal.37,65–68 Our average threshold elevation was 1.4 log units, whereas final thresholds measured following a bleaching exposure were elevated up to 3.6 log units. Thresholds in our patients were measured after dark adapting from room light rather than following a bleaching exposure. Recovery of threshold from room light has a shorter time course than recovery from a bleach. Thus, procedural differences, the known slow kinetics of recovery in several forms of CSNB,37,69 and the small sample size may explain, in part, the apparent discrepancy between our results and those previously reported.
In summary, we interpret our results as indicative of robust and normal photoreceptor function in CSNB despite the low saturated photoresponse amplitude. Postreceptor function in our patients shows evidence of anomalous retinal circuitry that varies with type of CSNB. Among animal models of CSNB,70–72 postreceptor retinal circuitry, which varies with genetic diagnosis, may be analyzed by pharmacological dissection.73 Study of the ERG in these animal models using the approach applied in the present study would be a step in translating the knowledge to the human retina. Another step would be further noninvasive study of retinal processes in genotyped patients with CSNB. This is expected to advance knowledge of CSNB circuitry in particular and of human retinal circuitry more generally.
Acknowledgments
Presented in part at the annual meeting of the Association for Research in Vision and Ophthalmology, Fort Lauderdale, Florida, May 2009.
Supported in part by National Eye Institute Grant EY010957.
Disclosure: A. Raghuram, None; R.M. Hansen, None; A. Moskowitz, None; A.B. Fulton, None
References
- 1. Audo I, Robson AG, Holder GE, Moore AT. The negative ERG: clinical phenotypes and disease mechanisms of inner retinal dysfunction. Surv Ophthalmol. 2008; 53: 16–40 [DOI] [PubMed] [Google Scholar]
- 2. Traboulsi EI, Leroy BP, Zeitz C. Congenital stationary night blindness. In: Traboulsi EI. ed Genetic Diseases of the Eye. New York: Oxford University Press; 2012: 476–478 [Google Scholar]
- 3. Miyake Y. Congenital stationary night blindness. In: Heckenlively JR, Arden GB. eds Principles and Practice of Clinical Electrophysiology of Vision. Cambridge, MA: MIT Press; 2006: 829–842 [Google Scholar]
- 4. Miyake Y. Electrodiagnosis of Retinal Diseases. New York: Springer; 2006. [Google Scholar]
- 5. Nakamura M, Ito S, Piao CH, Terasaki H, Miyake Y. Retinal and optic disc atrophy associated with a CACNA1F mutation in a Japanese family. Arch Ophthalmol. 2003; 121: 1028–1033 [DOI] [PubMed] [Google Scholar]
- 6. Zeitz C. Molecular genetics and protein function involved in nocturnal vision. Expert Rev Ophthalmol. 2007; 2: 467–485 [Google Scholar]
- 7. Bech-Hansen NT, Naylor MJ, Maybaum TA, et al. Loss-of-function mutations in a calcium-channel alpha1-subunit gene in Xp11.23 cause incomplete X-linked congenital stationary night blindness. Nat Genet. 1998; 19: 264–267 [DOI] [PubMed] [Google Scholar]
- 8. Strom TM, Nyakatura G, Apfelstedt-Sylla E, et al. An L-type calcium-channel gene mutated in incomplete X-linked congenital stationary night blindness. Nat Genet. 1998; 19: 260–263 [DOI] [PubMed] [Google Scholar]
- 9. Bech-Hansen NT, Naylor MJ, Maybaum TA, et al. Mutations in NYX, encoding the leucine-rich proteoglycan nyctalopin, cause X-linked complete congenital stationary night blindness. Nat Genet. 2000; 26: 319–323 [DOI] [PubMed] [Google Scholar]
- 10. Pusch CM, Zeitz C, Brandau O, et al. The complete form of X-linked congenital stationary night blindness is caused by mutations in a gene encoding a leucine-rich repeat protein. Nat Genet. 2000; 26: 324–327 [DOI] [PubMed] [Google Scholar]
- 11. Dryja TP, McGee TL, Berson EL, et al. Night blindness and abnormal cone electroretinogram ON responses in patients with mutations in the GRM6 gene encoding mGluR6. Proc Natl Acad Sci U S A. 2005; 102: 4884–4889 [DOI] [PMC free article] [PubMed] [Google Scholar]
- 12. Zeitz C, Kloeckener-Gruissem B, Forster U, et al. Mutations in CABP4, the gene encoding the Ca2+-binding protein 4, cause autosomal recessive night blindness. Am J Hum Genet. 2006; 79: 657–667 [DOI] [PMC free article] [PubMed] [Google Scholar]
- 13. Zeitz C, van Genderen M, Neidhardt J, et al. Mutations in GRM6 cause autosomal recessive congenital stationary night blindness with a distinctive scotopic 15-Hz flicker electroretinogram. Invest Ophthalmol Vis Sci. 2005; 46: 4328–4335 [DOI] [PubMed] [Google Scholar]
- 14. Audo I, Kohl S, Leroy BP, et al. TRPM1 is mutated in patients with autosomal-recessive complete congenital stationary night blindness. Am J Hum Genet. 2009; 85: 720–729 [DOI] [PMC free article] [PubMed] [Google Scholar]
- 15. Morgans CW, Brown RL, Duvoisin RM. TRPM1: the endpoint of the mGluR6 signal transduction cascade in retinal ON-bipolar cells. Bioessays. 2010; 32: 609–614 [DOI] [PMC free article] [PubMed] [Google Scholar]
- 16. Nakamura M, Sanuki R, Yasuma TR, et al. TRPM1 mutations are associated with the complete form of congenital stationary night blindness. Mol Vis. 2010; 16: 425–437 [PMC free article] [PubMed] [Google Scholar]
- 17. Audo I, Bujakowska K, Orhan E, et al. Whole-exome sequencing identifies mutations in GPR179 leading to autosomal-recessive complete congenital stationary night blindness. Am J Hum Genet. 2012; 90: 321–330 [DOI] [PMC free article] [PubMed] [Google Scholar]
- 18. Peachey NS, Ray TA, Florijn R, et al. GPR179 is required for depolarizing bipolar cell function and is mutated in autosomal-recessive complete congenital stationary night blindness. Am J Hum Genet. 2012; 90: 331–339 [DOI] [PMC free article] [PubMed] [Google Scholar]
- 19. Zeitz C, Jacobson SG, Hamel CP, et al. Whole-exome sequencing identifies LRIT3 mutations as a cause of autosomal-recessive complete congenital stationary night blindness. Am J Hum Genet. 2013; 92: 67–75 [DOI] [PMC free article] [PubMed] [Google Scholar]
- 20. Schubert G, Bornschein H. Analysis of the human electroretinogram. Ophthalmologica. 1952; 123: 396–413 [DOI] [PubMed] [Google Scholar]
- 21. Hood DC, Birch DG. The A-wave of the human electroretinogram and rod receptor function. Invest Ophthalmol Vis Sci. 1990; 31: 2070–2081 [PubMed] [Google Scholar]
- 22. Dryja TP. Molecular genetics of Oguchi disease, fundus albipunctatus, and other forms of stationary night blindness: LVII Edward Jackson Memorial Lecture. Am J Ophthalmol. 2000; 130: 547–563 [DOI] [PubMed] [Google Scholar]
- 23. Kim JM, Payne JF, Yan J, Barnes CS. Negative electroretinograms in the pediatric and adult population. Doc Ophthalmol. 2012; 124: 41–48 [DOI] [PubMed] [Google Scholar]
- 24. Bradshaw K, Allen L, Trump D, Hardcastle A, George N, Moore A. A comparison of ERG abnormalities in XLRS and XLCSNB. Doc Ophthalmol. 2004; 108: 135–145 [DOI] [PubMed] [Google Scholar]
- 25. Krill AE, Martin D. Photopic abnormalities in congenital stationary nightblindness. Invest Ophthalmol. 1971; 10: 625–636 [PubMed] [Google Scholar]
- 26. Scholl HP, Langrova H, Pusch CM, Wissinger B, Zrenner E, Apfelstedt-Sylla E. Slow and fast rod ERG pathways in patients with X-linked complete stationary night blindness carrying mutations in the NYX gene. Invest Ophthalmol Vis Sci. 2001; 42: 2728–2736 [PubMed] [Google Scholar]
- 27. Sergouniotis PI, Robson AG, Li Z, et al. A phenotypic study of congenital stationary night blindness (CSNB) associated with mutations in the GRM6 gene. Acta Ophthalmol. 2012; 90: e192–e197 [DOI] [PubMed] [Google Scholar]
- 28. Tremblay F, Laroche RG, De Becker I. The electroretinographic diagnosis of the incomplete form of congenital stationary night blindness. Vision Res. 1995; 35: 2383–2393 [DOI] [PubMed] [Google Scholar]
- 29. Alpern M, Holland MG, Oba N. Rhodopsin bleaching signals in essential night blindness. J Physiol. 1972; 225: 457–476 [DOI] [PMC free article] [PubMed] [Google Scholar]
- 30. Carr RE, Ripps H, Siegel IM, Weale RA. Rhodopsin and the electrical activity of the retina in congenital night blindness. Invest Ophthalmol. 1966; 5: 497–507 [PubMed] [Google Scholar]
- 31. Keunen JE, Van Meel GJ, Van Norren D. Rod densitometry in night blindness: a review and two puzzling cases. Rod densitometry in night blindness. Doc Ophthalmol. 1988; 68: 375–387 [DOI] [PubMed] [Google Scholar]
- 32. Lachapelle P, Little JM, Polomeno RC. The photopic electroretinogram in congenital stationary night blindness with myopia. Invest Ophthalmol Vis Sci. 1983; 24: 442–450 [PubMed] [Google Scholar]
- 33. Siegel IM, Greenstein VC, Seiple WH, Carr RE. Cone function in congenital nyctalopia. Doc Ophthalmol. 1987; 65: 307–318 [DOI] [PubMed] [Google Scholar]
- 34. Miyake Y, Yagasaki K, Horiguchi M, Kawase Y. On- and off-responses in photopic electroretinogram in complete and incomplete types of congenital stationary night blindness. Jpn J Ophthalmol. 1987; 31: 81–87 [PubMed] [Google Scholar]
- 35. Fulton A, Moskowitz A, Hansen R, Raghuram A. Examination of pediatric retinal function/ERG in infants and children. In: Hartnett M, Trese M, Capone A, Caputo G, Keats B. eds Pediatric Retina. Philadelphia: Lippincott Williams & Wilkins; In press [Google Scholar]
- 36. Mayer DL, Beiser AS, Warner AF, Pratt EM, Raye KN, Lang JM. Monocular acuity norms for the Teller Acuity Cards between ages one month and four years. Invest Ophthalmol Vis Sci. 1995; 36: 671–685 [PubMed] [Google Scholar]
- 37. Miyake Y, Yagasaki K, Horiguchi M, Kawase Y, Kanda T. Congenital stationary night blindness with negative electroretinogram. A new classification. Arch Ophthalmol. 1986; 104: 1013–1020 [DOI] [PubMed] [Google Scholar]
- 38. Fulton AB, Hansen RM, Moskowitz A, Akula JD. The neurovascular retina in retinopathy of prematurity. Prog Retin Eye Res. 2009; 28: 452–482 [DOI] [PMC free article] [PubMed] [Google Scholar]
- 39. Hansen RM, Eklund SE, Benador IY, et al. Retinal degeneration in children: dark adapted visual threshold and arteriolar diameter. Vision Res. 2008; 48: 325–331 [DOI] [PMC free article] [PubMed] [Google Scholar]
- 40. Marmor MF, Fulton AB, Holder GE, Miyake Y, Brigell M, Bach MISCEV. Standard for full-field clinical electroretinography (2008 update). Doc Ophthalmol. 2009; 118: 69–77 [DOI] [PubMed] [Google Scholar]
- 41. Paupoo AA, Mahroo OA, Friedburg C, Lamb TD. Human cone photoreceptor responses measured by the electroretinogram [correction of electoretinogram] a-wave during and after exposure to intense illumination. J Physiol. 2000; 529: 469–482 [DOI] [PMC free article] [PubMed] [Google Scholar]
- 42. Fulton AB, Hansen RM, Moskowitz A. The cone electroretinogram in retinopathy of prematurity. Invest Ophthalmol Vis Sci. 2008; 49: 814–819 [DOI] [PMC free article] [PubMed] [Google Scholar]
- 43. Wongpichedchai S, Hansen RM, Koka B, Gudas VM, Fulton AB. Effects of halothane on children's electroretinograms. Ophthalmology. 1992; 99: 1309–1312 [DOI] [PubMed] [Google Scholar]
- 44. Hood DC, Birch DG. Rod phototransduction in retinitis pigmentosa: estimation and interpretation of parameters derived from the rod a-wave. Invest Ophthalmol Vis Sci. 1994; 35: 2948–2961 [PubMed] [Google Scholar]
- 45. Lamb TD, Pugh EN Jr. A quantitative account of the activation steps involved in phototransduction in amphibian photoreceptors. J Physiol. 1992; 449: 719–758 [DOI] [PMC free article] [PubMed] [Google Scholar]
- 46. Pugh EN Jr, Lamb TD. Amplification and kinetics of the activation steps in phototransduction. Biochim Biophys Acta. 1993; 1141: 111–149 [DOI] [PubMed] [Google Scholar]
- 47. Fulton AB, Hansen RM. The development of scotopic sensitivity. Invest Ophthalmol Vis Sci. 2000; 41: 1588–1596 [PubMed] [Google Scholar]
- 48. Peachey NS, Alexander KR, Fishman GA. The luminance-response function of the dark-adapted human electroretinogram. Vision Res. 1989; 29: 263–270 [DOI] [PubMed] [Google Scholar]
- 49. Aleman TS, LaVail MM, Montemayor R, et al. Augmented rod bipolar cell function in partial receptor loss: an ERG study in P23H rhodopsin transgenic and aging normal rats. Vision Res. 2001; 41: 2779–2797 [DOI] [PubMed] [Google Scholar]
- 50. Wurziger K, Lichtenberger T, Hanitzsch R. On-bipolar cells and depolarising third-order neurons as the origin of the ERG-b-wave in the RCS rat. Vision Res. 2001; 41: 1091–1101 [DOI] [PubMed] [Google Scholar]
- 51. Stockton RA, Slaughter MM. B-wave of the electroretinogram. A reflection of ON bipolar cell activity. J Gen Physiol. 1989; 93: 101–122 [DOI] [PMC free article] [PubMed] [Google Scholar]
- 52. Hood DC, Birch DG. Phototransduction in human cones measured using the alpha-wave of the ERG. Vision Res. 1995; 35: 2801–2810 [DOI] [PubMed] [Google Scholar]
- 53. Wali N, Leguire LE. The photopic hill: a new phenomenon of the light adapted electroretinogram. Doc Ophthalmol. 1992; 80: 335–345 [DOI] [PubMed] [Google Scholar]
- 54. Sieving PA., Photopic ON- and OFF-pathway abnormalities in retinal dystrophies. Trans Am Ophthalmol Soc. 1993; 91: 701–773 [PMC free article] [PubMed] [Google Scholar]
- 55. Wetherill GB, Levitt H. Sequential estimation of points on a psychometric function. Br J Math Stat Psychol. 1965; 18: 1–10 [DOI] [PubMed] [Google Scholar]
- 56. Vaghefi HA, Green WR, Kelley JS, Sloan LL, Hoover RE, Patz A. Correlation of clinicopathologic findings in a patient. Congenital night blindness, branch retinal vein occlusion, cilioretinal artery, drusen of the optic nerve head, and intraretinal pigmented lesion. Arch Ophthalmol. 1978; 96: 2097–2104 [DOI] [PubMed] [Google Scholar]
- 57. Watanabe I, Taniguchi Y, Morioka K, Kato M. Congenital stationary night blindness with myopia: a clinico-pathologic study. Doc Ophthalmol. 1986; 63: 55–62 [DOI] [PubMed] [Google Scholar]
- 58. Godara P, Cooper RF, Sergouniotis PI, et al. Assessing retinal structure in complete congenital stationary night blindness and Oguchi disease. Am J Ophthalmol. 2012; 154: 987–1001 [DOI] [PMC free article] [PubMed] [Google Scholar]
- 59. Jamison JA, Bush RA, Lei B, Sieving PA. Characterization of the rod photoresponse isolated from the dark-adapted primate ERG. Vis Neurosci. 2001; 18: 445–455 [DOI] [PubMed] [Google Scholar]
- 60. Robson JG, Saszik SM, Ahmed J, Frishman LJ. Rod and cone contributions to the a-wave of the electroretinogram of the macaque. J Physiol. 2003; 547: 509–530 [DOI] [PMC free article] [PubMed] [Google Scholar]
- 61. Hood DC, Birch DG. Beta wave of the scotopic (rod) electroretinogram as a measure of the activity of human on-bipolar cells. J Opt Soc Am A Opt Image Sci Vis. 1996; 13: 623–633 [DOI] [PubMed] [Google Scholar]
- 62. Robson JG, Frishman LJ. Dissecting the dark-adapted electroretinogram. Doc Ophthalmol. 1998; 95: 187–215 [DOI] [PubMed] [Google Scholar]
- 63. Ueno S, Kondo M, Niwa Y, Terasaki H, Miyake Y. Luminance dependence of neural components that underlies the primate photopic electroretinogram. Invest Ophthalmol Vis Sci. 2004; 45: 1033–1040 [DOI] [PubMed] [Google Scholar]
- 64. Sustar M, Stirn-Kranjc B, Hawlina M, Brecelj J., Photopic ON- and OFF-responses in complete type of congenital stationary night blindness in relation to stimulus intensity. Doc Ophthalmol. 2008; 117: 37–46 [DOI] [PubMed] [Google Scholar]
- 65. Kabanarou SA, Holder GE, Fitzke FW, Bird AC, Webster AR. Congenital stationary night blindness and a “Schubert-Bornschein” type electrophysiology in a family with dominant inheritance. Br J Ophthalmol. 2004; 88: 1018–1022 [DOI] [PMC free article] [PubMed] [Google Scholar]
- 66. Noble KG, Carr RE, Siegel IM. Autosomal dominant congenital stationary night blindness and normal fundus with an electronegative electroretinogram. Am J Ophthalmol. 1990; 109: 44–48 [DOI] [PubMed] [Google Scholar]
- 67. Peachey NS, Fishman GA, Kilbride PE, Alexander KR, Keehan KM, Derlacki DJ. A form of congenital stationary night blindness with apparent defect of rod phototransduction. Invest Ophthalmol Vis Sci. 1990; 31: 237–246 [PubMed] [Google Scholar]
- 68. Young RSL, Price J, Harrison J. Psychophysical studies of rod adaptation in patients with congenital stationary night blindness. Clin Vis Sci. 1986; 1: 137–143 [Google Scholar]
- 69. Lamb TD, Pugh EN Jr. Phototransduction, dark adaptation, and rhodopsin regeneration the proctor lecture. Invest Ophthalmol Vis Sci. 2006; 47: 5137–5152 [DOI] [PubMed] [Google Scholar]
- 70. Maddox DM, Vessey KA, Yarbrough GL, et al. Allelic variance between GRM6 mutants, Grm6nob3 and Grm6nob4 results in differences in retinal ganglion cell visual responses. J Physiol. 2008; 586: 4409–4424 [DOI] [PMC free article] [PubMed] [Google Scholar]
- 71. McCall MA, Gregg RG. Comparisons of structural and functional abnormalities in mouse b-wave mutants. J Physiol. 2008; 586: 4385–4392 [DOI] [PMC free article] [PubMed] [Google Scholar]
- 72. Tao Y, Chen T, Liu B, et al. Visual signal pathway reorganization in the Cacna1f mutant rat model. Invest Ophthalmol Vis Sci. 2013; 54: 1988–1997 [DOI] [PubMed] [Google Scholar]
- 73. Shirato S, Maeda H, Miura G, Frishman LJ. Postreceptoral contributions to the light-adapted ERG of mice lacking b-waves. Exp Eye Res. 2008; 86: 914–928 [DOI] [PMC free article] [PubMed] [Google Scholar]


