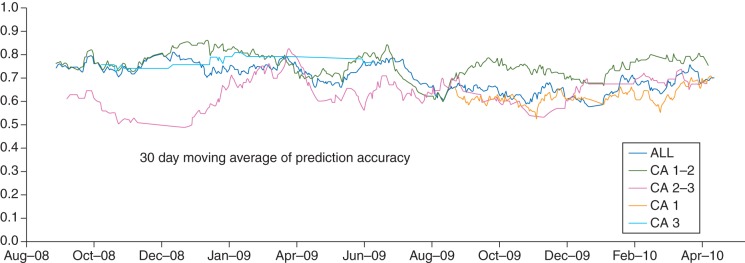
Fig 3.

Thirty day moving average of prediction accuracy over duration of study. CA 1–2 are residents who enrolled as first-year residents when the study began and were second-year residents at the end of the study; CA 2–3 are residents who enrolled as second-year residents when the study began and were third-year residents at the end of the study; CA 1–1 are residents who enrolled as first-year residents the second year of the study; CA 3 are residents who enrolled as third-year residents the first year of the study.
