


Abstract
Both 454 and Ion Torrent sequencers are capable of producing large amounts of long high-quality sequencing reads. However, as both methods sequence homopolymers in one cycle, they both suffer from homopolymer uncertainty and incorporation asynchronization. In mapping, such sequencing errors could shift alignments around homopolymers and thus induce incorrect mismatches, which have become a critical barrier against the accurate detection of single nucleotide polymorphisms (SNPs). In this article, we propose a hidden Markov model (HMM) to statistically and explicitly formulate homopolymer sequencing errors by the overcall, undercall, insertion and deletion. We use a hierarchical model to describe the sequencing and base-calling processes, and we estimate parameters of the HMM from resequencing data by an expectation-maximization algorithm. Based on the HMM, we develop a realignment-based SNP-calling program, termed PyroHMMsnp, which realigns read sequences around homopolymers according to the error model and then infers the underlying genotype by using a Bayesian approach. Simulation experiments show that the performance of PyroHMMsnp is exceptional across various sequencing coverages in terms of sensitivity, specificity and F1 measure, compared with other tools. Analysis of the human resequencing data shows that PyroHMMsnp predicts 12.9% more SNPs than Samtools while achieving a higher specificity. (http://code.google.com/p/pyrohmmsnp/).
INTRODUCTION
The 454 (1), Ion Torrent (2) and Fluorogenic sequencing (3), derived from the pyrosequencing technology (4–6), sequence DNA homopolymers by detecting by-products of the nucleotide incorporation reactions, i.e. the pyrophosphates (454), hydrogen ions (Ion Torrent) and fluorescent molecules (Fluorogenic sequencing). This technology is based on the sequencing-by-synthesis technique by which a sequencer cyclically delivers the chemical reagents at a predefined order through a slide that has millions of wells filled with beads carrying millions of template copies. For homopolymer sequencing, the chemical reagent, lacking a reversible terminator on the 3′-hydroxyl group, allows the sequencing procedure to incorporate multiple nucleotides within one flow (7,8). Therefore, at each reagent flow, the measured flow intensity is theoretically proportional to the run length of the incorporated nucleotides. However, the inevitable stochastic nature of the biochemical reactions and apparatus raises uncertainty in sequencing homopolymer regions. In this situation, the linearity between the flow intensity and the number of incorporated nucleotides would not be exact, given the increasing length of nascent homopolymers (9). Such uncertainty causes errors in determining the length of homopolymers, either longer (overcall) or shorter (undercall) than the actual length (Supplementary Figures S1 and S2). In addition, a few template copies may grow in de-synchronization with the population, causing the carry forward and incomplete extension effects (CAFIE) (1–3). More specifically, homopolymers originated from past flow cycles appear as insertions termed ‘the carry forward’, whereas homopolymers originated from future flow cycles appear as insertions termed ‘the incomplete extension’. As described in the literature (10), the mismatches in sequence alignments are predominantly caused by insertions followed by deletions or vice versa. Therefore, homopolymer uncertainty, carry forward and incomplete extension account for most of the errors in homopolymer sequencing.
Homopolymer sequencing has been applied to the genome-wide detection of single nucleotide polymorphisms (SNPs) (11). Assuming that the reads are correctly mapped and aligned, the discovery of SNPs would be a straightforward matter of detecting sites where observations are truly different from the reference. However, this is not always the case as insertions and deletions occurring around homopolymers can shift the alignments and induce false mismatches. We give several examples of improper alignments that occur around homopolymer regions in Supplementary Figures S1 and S2. Furthermore, such false mismatches have been shown to critically obstruct accurate detection of SNPs near homopolymers. To address this problem, a few studies have proposed to improve the accuracy of SNP calling in homopolymer sequencing data through quality score recalibration (12,13) or statistical classification (12–15). The quality scores can be recalibrated (12) by considering multiple factors, such as the vendor’s quality of the whole read, sequence context, e.g. homopolymers around a site and distance to the 3′-end where polymerase molecules lose activity. An SNP calling method, i.e. PolyBayes (16), is then applied to call SNPs. Statistical classification methods also use these aforementioned factors as predictive features to discriminate SNPs from sequencing errors. For example, Atlas-SNP2 (14) built a logistic regression model to predict SNPs, whereas ProbHD (15) built a random forest classifier. However, all these methods would fail to detect SNPs if the alignments were incorrect. Therefore, realignment is a critical step for SNP calling.
Intuitively, a realignment strategy will take advantage of characteristics of sequencing errors to design a scoring function along with an alignment algorithm, with which one can search for the proper (optimal) alignment to avoid false mismatches induced by alignment errors. This strategy has been proved effective for variant detection in Illumina sequencing data (17–20). For the Ion Torrent and 454 sequencing data, the scoring function should be homopolymer-aware to reflect the characteristics of sequencing errors, and the algorithm should treat a nucleotide sequence as a homopolymer sequence, which is a more accurate representation of the sequencing process. It has been observed that longer homopolymers are more likely to be sequenced incorrectly, causing gaps when aligning homopolymers. Based on this rationale, PanGEA (21) proposed a homopolymer-aware Smith–Waterman algorithm that treated each homopolymer as a unit in the dynamic programming and gave a smaller gap open penalty for longer homopolymers. FAAST (22) improved this method by incorporating flow information into the scoring function such that the greater the observed flow intensity, the smaller the gap open penalty in the alignment. However, the scoring parameters used in these two methods were set up heuristically, independent of both the sequencing machine and the experimental protocol. The publicly released Ion Torrent software uses a realignment approach that first transforms the reference sequence into a theoretical flowgram and then aligns the theoretical flowgram with the flowgram of a read.
In this article, we propose a hidden Markov model (HMM), called PyroHMMsnp, to realign sequencing reads with reference sequences. The core probabilistic components of the HMM include the hidden states that represent the homopolymer sequencing patterns of a machine, a base call rate matrix (23) that captures the pattern of homopolymer insertions and a length call rate matrix that follows the statistical distribution of the called length with respect to the actual length of homopolymers. To call SNPs, we develop a Bayesian approach to infer the most probable genotype from which the observed reads are sequenced. In the present work, we set up two simulation experiments, test the performance of the proposed method and then apply it to two experimental data sets. Results of the simulation experiments show that PyroHMMsnp achieves higher accuracy than other state-of-the-art methods at various levels of sequencing coverage. We tested it again using the whole-genome resequencing data of G. Moore generated by Ion Torrent (2), as well as the genome resequencing data of 15 individuals from the 1000 Genome Project generated by 454 sequencing. Compared with Samtools (24) at the similar level of specificity, PyroHMMsnp identified more SNPs, which could be validated by the NCBI dbSNP database.
MATERIALS AND METHODS
Nucleotide, homopolymer and homopolymer sequence
We first define an alphabetic set  to represent symbolic elements in a sequence with
  denoting the nucleotides and
  denoting an insertion or a deletion. We use a bold random variable, e.g.
  where
where  for
for  , to represent a sequence. A homopolymer, which consists of homogeneous nucleotides, can be represented by its nucleotide and length, denoted as
  where
where  and
and  . Using this representation, a nucleotide sequence can be transformed into a homopolymer sequence (25). For example, sequence
  can be transformed into a homopolymer sequence
  . A naturally occurring homopolymer in a biological sequence has non-zero length. However, in sequence comparison, we need a special homopolymer, a null homopolymer
  , to represent homopolymer indels. We define two homopolymers
  and
and  to be similar if
  , or different if
  . The comparison between two empty homopolymers is not allowed in pairwise alignment.
Overview of PyroHMMsnp
In this article, we implement a realignment-based SNP calling method termed ‘PyroHMMsnp’. Figure 1 describes the workflow of PyroHMMsnp, which consists of two separate components: an HMM and a Bayesian SNP calling method. First, PyroHMMsnp takes input of raw mappings generated by programs, such as MegaBlast (26), SSAHA2 (27), Burrows-Wheeler Aligner with Smith-Waterman algorithm (BWA-SW) (28), Roche’s GSmapper and Ion Torrent’s TMAP, and then computes the optimal alignment between every read and the reference through the HMM. Then, a Bayesian method is used to infer the underlying genotype that maximizes the observed reads.
Figure 1.

Algorithmic overview of the HMM-based SNP calling method termed PyroHMMsnp. PyroHMMsnp consists of two components: a HMM for read-reference realignment and a Bayesian SNP calling method. (i) The HMM performs the realignment for a read with a reference sequence and estimates the parameters using the expectation-maximization algorithm. After the training, HMM searches for the optimal alignment between a read and the reference sequence. (ii) PyroHMMsnp accepts the raw mappings generated by a mapping program as the input to the SNP calling procedure, identifies all candidate polymorphic sites along the genome, clusters together the nearby polymorphic sites into a window, enumerates all possible haplotypes within the window and infers the most possible underlying haplotype.
PyroHMMsnp: HMM
We propose an HMM to describe the ‘local alignment’ of a read with the corresponding reference sequence. The model performs like a virtual sequencing machine that takes a homopolymer reference sequence as input and produces a read, which resembles the sequencing characteristics of a 454 or Ion Torrent sequencer (Supplementary Figure S3). As illustrated in Figure 2A, the HMM includes three essential hidden states  for sequencing (alignment), where
  stands for correct homopolymer calling,
  for deletion and
  for insertion. More specifically, state
  takes a non-empty homopolymer
  as the input and emits a similar non-empty homopolymer
  . If
. If  , it is undercalled, and if
  , it is overcalled. State
  also takes a non-empty homopolymer
  as the input and emits a null homopolymer
  , whereas state
  takes an empty homopolymer as the input and emits a non-empty homopolymer. Two hidden states
  are added into the model to represent the beginning and ending of the alignment because (i) the quality at the beginning and ending of a read may be low and (ii) sometimes the exact boundaries (the beginning and ending) of the corresponding reference that produces the read are not clearly defined. Thus, the HMM model represents a local, rather than global, alignment. Based on the aforementioned notation, a hidden state
  can take values from the set
  , and a hidden state sequence becomes
  , which represents a unique alignment between a read and the corresponding reference sequence.
Figure 2.

(A) The topological structure of the HMM. The HMM takes an input of a nucleotide sequence and transforms it into a homopolymer sequence for which an HMM is set up. The HMM is comprised of three essential hidden states:  for correct-call, undercall, and overcall;
  for deletion;
  for insertion and two silent nodes
  to represent the beginning and ending of the alignment. (B) The parameter estimation procedure of the HMM. (C) An illustrative example of the realignment-based SNP calling.
In the aforementioned HMM, each hidden state can emit a homopolymer, either non-empty or empty. Let  represent the homopolymer input to a state
  , and let
  where
where  represent the homopolymer emitted by the state. The probability that state
  emits output
  , given input
  is modeled by two independent components: the base call rates (23) and the length call rates, as
where the base call rate  represents the probability that an input base
  is sequenced to an observed base
  during nucleotide incorporation, and the length call rate
  reflects the probability of observing
  consecutive bases in the sequencing process. In this article, we follow the literature (23) to calculate the base call rates, but for the length call, we propose the following two-level hierarchical model.
Distribution of called homopolymer length
Homopolymer sequencing can be divided into two contiguous stages. At the first stage, the flow intensity  is detected from an input homopolymer
  , and at the second stage, the homopolymer length
  is called from
  :
:
We model the first stage by  , or simply
  , in the context where
  is clearly defined. We model
  by a Laplace distribution, as
 |
where  is the scale parameter that is modelled as a power-law function of
  ,
,
where  ,
,  and
and  are constants and satisfy
  . For
. For  , we follow the literature (1) to model
  using a log-normal distribution, which models the negative flow intensity resulting from the empty homopolymer input to the sequencing machine.
We model the second stage by  , or simply
  , which can be estimated according to the following Bayes formula,
where,  is the prior distribution of homopolymer length along the genome that can be estimated from the existing or closely related genome sequences,
  is the likelihood of observing the flow intensity
  , given the observed homopolymer length
  , and
, and  is the normalization term calculated as
If the flow intensities are not given, we compute the homopolymer-length call rates by an integration over the intensities, as
If the intensities are given, a one-level model of  should be sufficient.
Homopolymer quality score
We include the base quality score in the hidden state emission of the HMM. For a read homopolymer  , each compositional nucleotide
  has a quality score
  . We therefore define the quality score of the homopolymer as the average over the compositional nucleotides, as
 |
In the homopolymer emission, we can model the observation of the homopolymer quality score for a hidden state  as
as
Thus, the full model becomes
Sequence realignment
Given a read  and the corresponding reference sequence
  , which is located through read-mapping, we first transform the reference
  into homopolymer sequence
  , where
  . Then, we apply the HMM to search for the optimal alignment between the read
  and the template
  using the Viterbi algorithm (29). We define the Viterbi variable
  as the probability of the optimal alignment between the read prefix subsequence
  and the homopolymer prefix subsequence
  ending with the hidden state
  , and, simultaneously, the suffix of
  is a homopolymer of length
  . We use the following recursion to calculate the Viterbi variable for
  ,
,  , as
, as
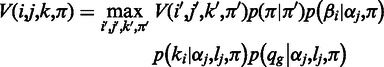 |
where  ,
,  ,
,  ,
,  ,
,  is the maximum length of the homopolymer ended at read position
  ,
,  is the maximum length of the homopolymer at read position
  and
and  is the transition probability between two states. Based on the recursion, we can use dynamic programming to compute the Viterbi variables, starting with the boundary conditions
  and
and  , where
  , and ending with the Viterbi score
  .
.
Parameter estimation
Parameters in the aforementioned HMM include the hidden state transition matrix, the base call rates and the parameters of the two-level hierarchical model. The estimation of these parameters would be simple if the ground-truth alignments that represent the procedure of generating read sequences from templates were known. However, because the ground-truth alignments are not available, we propose an iterative strategy that is inspired by the expectation-maximization algorithm (30) to train the HMM without the ground-truth alignments (Supplementary Methods). In this strategy, the learning procedure is divided into two subsequent processes, as illustrated in Figure 2B. First, given a read and its mapped reference sequence, the best alignment is computed and simultaneously assigned a posterior probability conditional on the previously learned parameters using the forward–backward algorithm (Supplementary Methods). The occurrences of the state transitions and state emissions are counted from the probabilistically weighted alignments, and parameters of the HMM are updated according to the occurrences by using the maximum likelihood estimation. This procedure iterates until the likelihood value converges.
PyroHMMsnp: Bayesian method for SNP calling
Based on the aforementioned HMM, we propose a realignment-based approach to call SNPs. As illustrated in Figure 2C, the proposed approach infers the most likely genotype from the realignments of the reads within a window and reports SNPs if the inferred genotype is different from the reference. The detail is described as follows:
Haploid organism
Using the raw mapping results, we first extract all candidate polymorphic sites along the genome and then cluster together close polymorphic sites. Next, for each cluster, we set up a window of size  and collect all substrings of the reads mapped to this window. Let
  be the set of the substrings, where
  is the number of substrings within the window. Let
  be the number of candidate polymorphic sites. We enumerate all
  possible haplotypes according to the raw read pileup.
Let  be one of the haplotypes. We set up the prior probability
  according to the estimated density of SNPs in the genome or the value provided by the user. Within the window, we infer the posterior probability of the haplotype using the Bayesian method, as
where  is calculated as the score of the optimal alignment between
  and the haplotype
  using the HMM model. Because the genotype comprises a single haplotype, we choose the haplotype
  , which has the maximal posterior probability as the candidate haplotype and report SNPs at the sites where
  differs from the reference. The quality score of the SNP is calculated as
  .
.
Diploid organism
We adopt a similar approach to the SNP calling for diploid organisms, but with some slight modifications. Each genotype consists of two underlying haplotypes  in which the two haplotypes may be the same (homozygous) or different (heterozygous). The prior probability for the genotype is calculated by
  , and the likelihood is computed by the following equation:
where  . Then, we apply the Bayesian method to compute the genotype that maximizes the posterior probability
  . We call SNPs at the sites where
  differs from the reference and calculate the corresponding quality score.
RESULTS
Data sets
To assess the performance of PyroHMMsnp, we used two Escherichia coli resequencing data sets. The first one is the whole-genome resequencing data of E. coli substrain DH10B (Life Technology Website: C22-169), which was generated by an Ion Torrent sequencer Ion 318™ Chip. The data set consists of 6 479 267 reads with an average length of ∼240 bp and an average coverage of ∼333.2-fold. The second one is the whole-genome resequencing data of E. coli substrain MG1655 (NCBI Short Read Archive: SRR001355), which was sequenced by a GS 454 FLX sequencer. The data set consists of 256 503 reads with an average length of 244 bp and an average coverage of ∼9.6-fold. These two data sets were also used to study the distributions of the flow intensities and compare the Ion Torrent sequencing data with 454 sequencing data.
We applied PyroHMMsnp to call SNPs in human genome using the whole-genome resequencing data produced by an Ion Torrent PGM machine for an individual G. Moore (NCBI Short Read Archive: ERX016676). The data set consists of 859 757 279 reads, with an average length of ∼183 bp.
We also applied PyroHMMsnp to call SNPs in population sequencing data. We downloaded the mapping file for chromosome 20 resequencing data produced by the GS 454 FLX Titanium for 15 Utah residents with Northern and Western European ancestry (CEU) from the 1000 Genome Project. The file consists of 11 855 924 mapped reads, with an average length of ∼246 bp.
Homopolymer emission model in HMM
We used the aforementioned two E. coli whole-genome sequencing data to explore the empirical distributions of the flow intensities for both the Ion Torrent and 454 sequencing data conditional on the lengths of the reference homopolymers. To ensure the quality of reads in these data sets, we first performed a filtration procedure following the literature (10) to eliminate reads that were too long or too short, or had more than two ambiguous bases. Then, we mapped the remaining reads onto the reference genome using MegaBlast (26). In this process, we set the gap-open penalty, gap-extend penalty and e-value cutoff to 1. Results showed that the mapping rates of the Ion Torrent data and the 454 data were 88.4 and 92.6%, respectively. Next, we applied the HMM (with default parameters) to compute the optimal alignments for the mapped reads, in which the homopolymers in the reads were aligned with the reference homopolymers, and their flow intensities matched the length of the reference homopolymers. Figure 3A and B illustrate the empirical distributions of the flow intensities for adenine homopolymer stretches, conditional on the lengths of the reference homopolymers obtained from the Ion Torrent and 454 data, respectively. We then fitted these empirical distributions of the flow intensities to Laplace distributions, which accurately described these distributions of the flow intensities emitted from the reference homopolymers for both data sets.
Figure 3.

The distribution of the flow intensity and homopolymer emission modeling of poly(dA) stretches. (A) The distribution of the flow intensity extracted from the Ion Torrent data conditional on the length of the poly(dA) stretches. The dark dash-dotted curves are the data-fitted Laplace distribution models. (B) The distribution of the flow intensity extracted from the 454 data conditional on the lengths of the poly(dA) stretches. (C) The plot of the estimated scale parameter  against the homopolymer size
  from the Ion Torrent data. The red upward-pointing triangles represent the estimated scale parameters of the Laplace distributions. The fitted model is shown by the dark dash-dotted curve. (D) The plot of the estimated scale parameter
  estimated from the 454 data against the homopolymer size
  . (E) The posterior probability of homopolymer size
  , given the flow intensity
  estimated from Ion Torrent data. (F) The length calling rates for poly(dA). The
  axis is the logarithmic scale of
  . The color decline from red to blue represents the probability from high to low.
We also observed that the distribution of the flow intensity had greater variance as the reference homopolymers became longer. For the Laplace distribution, the variance information is encoded by the scale parameter. We then plotted the estimated scale parameters of the Laplace distributions against the reference homopolymer lengths in Figure 3C and D. We fitted the estimated scale parameters by a power-law function that was proposed in the ‘Materials and Methods’ section. As shown in Figure 3C and D, the scaling exponents of the power-law functions are ∼1.23 for the Ion Torrent data and 1.46 for the 454 data. In addition, we also explored the empirical distributions of the flow intensities for homopolymers of cytosine, guanine and thymine and fitted them by the Laplace distributions. The results are plotted in Supplementary Figures S4–S7. Compared with previous studies that model the variance using the quadratic equation (1,9,13), our proposed power-law functions have better fit and could be explained by the random walking of polymerases along the nascent DNA strands (31,32).
We used a two-level hierarchical model to describe the homopolymer length calling procedure. The first level is the flow intensity emission component  , the probability that the sequencer detects flow intensity
  for an input homopolymer of length
  .
.  can be modeled by the aforementioned Laplace distribution (Figure 3A). The second level is the length calling component,
  , the probability that the base-calling software calls a length
  homopolymer, given the flow intensity
  (Figure 3E). If the flow intensities are given, a one-level model,
  , should be sufficient. For the two-level model, we used the Bayesian method to integrate out the latent flow intensity
  to obtain the length call rates,
  .
.
Comparing the Ion Torrent and 454 sequencing data
This comparison was based on the two E. coli whole-genome sequencing data sets. Although both the 454 and Ion Torrent technologies have similar sequencing characteristics (33,34), their detection methods are different. The Ion Torrent uses a semiconductor sensor to detect the change of solution pH, whereas the 454 technology detects enzymatic-reacted luminescence. From Figure 3A and B, we can clearly observe that the distributions of the 454 data have a more compact shape than that of the Ion Torrent data. The estimated scale parameters, as illustrated in Figure 3C and D, also confirm that the flow intensities of the 454 data have smaller variance than that of the Ion Torrent data, implying that the flow intensities of 454 data have higher fidelity.
Furthermore, we analyzed the two E. coli whole-genome sequencing data sets, computed the optimal alignment using the HMM, and decoded the hidden state paths for the alignments. Table 1 shows the statistics of the homopolymer correct-call, undercall, overcall, mismatch, insertion and deletion. The Ion Torrent data have a lower correct-call rate and higher undercall, overcall, deletion and insertion rates than those of the 454 data. We further catalogued the insertions into two subgroups: insertions caused by incorporation asynchronization and insertions caused by other sequencing errors. Although 97.05% of the insertions in the 454 data are caused by incorporation asynchronization, this is true for only 56.73% of the insertions in the Ion Torrent data. These results show that the 454 sequencing data have higher accuracy than the Ion Torrent data.
Table 1.
The comparison between the 454 and Ion Torrent sequencing data
| Platform | Correct-call (%) | Undercall (%) | Overcall (%) | Mismatch (%) | Deletion (%) | Insertion (%) (Non-CAFIE:CAFIE) (%) |
|---|---|---|---|---|---|---|
| 454 | 99.659 | 0.096 | 0.122 | 0.007 | 0.013 | 0.103 (2.954:97.046) |
| Ion Torrent | 97.487 | 0.950 | 1.033 | 0.008 | 0.084 | 0.437 (43.271:56.729) |
PyroHMMsnp was applied to the E. coli genome sequencing data sets generated by the 454 and Ion Torrent sequencers.
The raw mappings were realigned using the HMM, and the alignments were catalogued into correct-call, undercall, overcall, mismatch, deletion and insertion, according to the hidden states.
The insertion was further grouped into CAFIE and non-CAFIE.
Simulation experiments for haploid genomes
The performance of PyroHMMsnp is measured by the following three criteria: sensitivity, specificity and  score. Sensitivity is defined as the fraction of the annotated SNPs called by the program, specificity as the fraction of the called SNPs that are correct and
  score as a harmonic mean of sensitivity and specificity. The formulas are shown in the following:
 |
To compare PyroHMMsnp with other SNP-calling programs of Samtools (v0.1.17), VarScan (v2.2.8) and Atlas-SNP2 (v1.4.1), we designed the following simulation experiments based on the E. coli whole-genome sequencing data generated by the Ion Torrent machine. The simulation strategy consists of the following three steps. First, we generated an artificial reference genome by uniformly mutating single bases on the E. coli DH10B genome, creating a set of ground-truth SNPs. Second, we ran the SNP-calling programs to predict SNPs using both the Ion Torrent resequencing data and the artificial reference genome. Finally, we assessed the accuracy of the predictions using the aforementioned criteria.
To perform this simulation, we sampled 10 000 random alleles from the E. coli genome and mutated each into one of the other three alleles with equal probabilities. As the Ion Torrent data have deep coverage, we were able to test the performance of SNP calling methods using different sequencing depths by down-sampling the reads to 5×, 10× and 15× coverage. The sampled reads were then mapped onto the artificial reference genome and used to call SNPs. We then applied PyroHMMsnp, Samtools, VarScan and Atlas-SNP2, to call SNPs. Samtools integrated a built-in module to recalibrate quality scores through realignment and computed the optimal alignments using a simple scoring function that was specifically designed for homopolymers. VarScan implemented a batch of heuristic filters to reduce false-positive discoveries of SNPs. Atlas-SNPs developed a binary classifier to discriminate SNPs from sequencing errors.
We summarize the performance of these methods in Table 2. PyroHMMsnp achieves the highest  scores in all three levels of sequencing coverage indicated, suggesting that PyroHMMsnp has the best overall performance. As the sequencing coverage increases, both the sensitivity and specificity of PyroHMMsnp, Samtools and Atlas-SNP2 increase, and the
  score of Samtools grows closer to that of PyroHMMsnp. In contrast, the specificity of VarScan decreases with the increase of sequencing coverage, although the sensitivity does increase, possibly because VarScan does not model sequencing error well. On the other hand, Atlas-SNP2 is conservative in calling SNPs, as evidenced by its higher specificity (100% in all three sequencing coverage) and lower sensitivity than PyroHMMsnp and Samtools. This haploid simulation experiment shows that the HMM-based realignment strategy in PyroHMMsnp works well for the homopolymer sequencing data.
Table 2.
Sensitivities, specificities and  scores of four SNP calling methods across various levels of coverage, including 5×, 10×, 15×, of the Ion Torrent data
| Coverage | PyroHMMsnp | Samtools | VarScan | Atlas-SNP2 |
|---|---|---|---|---|
| 5× | ||||
| Sensitivity | 82.2% (±3.1e-3) | 76.1% (±3.4e-3) | 81.3% (±3.4e-4) | 17.0% (±3.4e-3) |
| Specificity | 99.3% (±1.8e-4) | 99.9% (±2.5e-4) | 97.2% (±8.0e-4) | 100.0% (±0.0e+0) |
| F1 | 89.9% (±1.8e-3) | 86.4% (±2.2e-3) | 88.5% (±2.1e-3) | 29.0% (±5.0e-3) |
| 10× | ||||
| Sensitivity | 93.8% (±2.2e-3) | 92.2% (±2.2e-3) | 93.6% (±2.2e-3) | 58.5% (±4.2e-3) |
| Specificity | 99.7% (±3.1e-4) | 99.8% (±3.5e-4) | 92.2% (±4.7e-4) | 100.0% (±5.5e-5) |
| F1 | 96.7% (±1.1e-3) | 95.9% (±1.2e-3) | 92.9% (±1.1e-3) | 73.8% (±3.3e-3) |
| 15× | ||||
| Sensitivity | 94.8% (±1.9e-3) | 94.4% (±1.9e-3) | 94.8% (±2.1e-3) | 79.8% (±5.3e-3) |
| Specificity | 99.8% (±2.9e-4) | 99.8% (±3.4e-4) | 85.4% (±7.3e-4) | 100.0% (±1.5e-4) |
| F1 | 97.2% (±1.0e-3) | 97.0% (±1.0e-3) | 89.9% (±1.1e-3) | 88.7% (±3.2e-3) |
The simulation experiment is repeated 10 times to evaluate sensitivities, specificities and  measurements. Numbers in parenthesis are the standard deviations across 10 replicate simulations.
We also performed the simulation experiment using the E. coli whole-genome sequencing data generated by the 454 machine (Supplementary Experiment). The sensitivity-versus-specificity plot (Supplementary Figure S10) also confirms that PyroHMMsnp has the best overall performance.
Simulation experiments for diploid genomes
To conduct a diploid simulation experiment to assess the performance of the SNP-calling methods, we randomly selected a 5 million bp segment on human chromosome 20 as the template to generate simulated SNPs and pyrosequencing data. To generate SNPs, we randomly selected a site and mutated it into a homozygous SNP with one-third chance and heterozygous SNPs with two-third chance. Setting the SNP density to be 0.1%, we simulated an artificial genome segment with 4942 SNPs, and then, using this genome segment, we applied the 454 simulator ART (35) to generate eight sets of sequencing reads with varying coverage: 5×, 10×, 15×, 20×, 25×, 30×, 35× and 40×. The SNP-calling programs were applied to the original genome template and the simulated 454 data sets to call SNPs. The resulting sensitivity, specificity and  measure are shown in Figure 4.
Figure 4.

The sensitivity, specificity and  score of the diploid simulation experiment.
At the coverage of 5×, PyroHMMsnp calls 1264 true positive variants and 136 false positive variants. In contrast, Samtools calls 480 true positives and 40 false positives, VarScan calls 189 true positives and 21 false positives and Atlas-SNP2 calls 359 true positives and 23 false positives. These results clearly suggest that PyroHMMsnp is sensitive enough to detect true positive variants at the shallow coverage, although the specificity is slightly less than that of either Samtools or Atlas-SNP2. As the sequencing coverage increases to 20, the sensitivity of PyroHMMsnp increases to 96.3%, significantly higher than that of Samtools (75.3%), VarScan (67.2%) and Atlas-SNP2 (80.0%). Similarly, the specificity of PyroHMMsnp increases to 99.4%, which is higher than that of Samtools (99.1%), VarScan (95.1%) and Atlas-SNP2 (99.3%). This diploid simulation experiment clearly shows the exceptional performance of PyroHMMsnp.
Application to the human genome resequencing data
Finally, we applied PyroHMMsnp to the resequencing data of human genome generated by the Ion Torrent PGM machine and evaluated its performance. We mapped the data onto the human reference genome hg19 by using BWA-SW (28) with the default parameter configuration. We filtered out low-quality reads, discarding reads with either low mapping quality score or <15 in vendor’s quality score. To evaluate the performance of PyroHMMsnp, Samtools and VarScan, we focused on chromosome 20, with an average read coverage of ∼6.4-fold, and we assessed the accuracy of SNP calling using the SNP annotations in dbSNP 136. The performance is measured by both the number of predictions and accuracy, which is the fraction of the true positives (SNPs that can be found in dbSNPs) in the predicted SNPs, the same as specificity that we have defined before. We do not use sensitivity here because the sensitivity cannot be measured when the ground-truth is not available.
As shown in Table 3, PyroHMMsnp calls 37 739 SNPs, 3311 (12.9%) more than Samtools (33 428), with a slightly higher accuracy (98.4%) than Samtools (98.3%). Both PyroHMMsnp and Samtools are more accurate in predicting homozygous SNPs, with 99.6 and 99.5%, respectively, than heterozygous SNPs, with 97.0 and 96.7%, respectively. The transition-versus-transversion ratio (Ti/Tv) is 2.17 for PyroHMMsnp and 2.33 for Samtools. In contrast, VarScan predicts 63 997 SNPs, of which only 47 755 (74.6%) are annotated in dbSNP, and its Ti/Tv ratio is 1.79. Atlas-SNP2 predicts only 6007 SNPs, of which 5817 (96.8%) are annotated in dbSNP, and its Ti/Tv ratio is 2.20. We also plot the overlaps of SNPs called by these four methods in Supplementary Figure S8.
Table 3.
The comparison of four SNP calling programs using the Ion Torrent human genome resequencing data (Chromosome 20)
| Method | All predicted SNPs |
Homozygous SNPs |
Heterozygous SNPs |
Transition/ Transversion | Run time (min) | |||
|---|---|---|---|---|---|---|---|---|
| Predictions | Found in dbSNP | Predictions | Found in dbSNP | Predictions | Found in dbSNP | |||
| PyroHMMsnp | 37 739 | 37 154 (98.4%) | 20 651 | 20 574 (99.6%) | 17 088 | 16 580 (97.0%) | 2.17 | 66.8 |
| Samtools | 33 428 | 32 876 (98.3%) | 19 585 | 19 486 (99.5%) | 13 843 | 13 390 (96.7%) | 2.33 | 20.4 |
| VarScan | 63 997 | 47 755 (74.6%) | 26 044 | 25 022 (96.1%) | 37 953 | 22 733 (59.9%) | 1.79 | 36.1 |
| Atlas-SNP2 | 6007 | 5817 (96.8%) | 3310 | 3121 (99.7%) | 2877 | 2696 (93.7%) | 2.20 | 21.1 |
Prediction results were validated by dbSNP136.
We conducted the aforementioned experiment using a laptop computer with 2.30 GHz CPU and 6 GB memory. In terms of running time, PyroHMMsnp took ∼66.8 min (Table 3) to call the SNPs on the 63 M-base human chromosome 20 (hg19). In comparison, Samtools and Atlas-SNP2 took a similar running time, ∼20 min, and VarScan took 36.1 min.
Figure 5 shows some representative cases in which PyroHMMsnp succeeds in finding the SNPs, whereas Samtools fails. As depicted in Figure 5A, a homozygous SNP can be found at the locus 346 751. PyroHMMsnp reports this site as a homozygous polymorphic site based on an inserted guanine, which the mapping program wrongly aligned between loci 346 750 and 346 751. Furthermore, although the flow intensity of 5 bp homopolymers has a considerably wider variance according to Figure 3A, it seldom happens that a 5 bp homopolymer is undercalled as a 2 bp homopolymer, according to the error model. Therefore, PyroHMMsnp calls this polymorphic site by a high probability. However, Samtools considers it within a long homopolymer in which the sequencing accuracy is low, predicting it as a sequencing error. Figure 5B–D illustrates other cases where PyroHMMsnp is able to predict polymorphic sites that are surrounded by homopolymers. In summary, PyroHMMsnp performs better than other programs in distinguishing SNPs that occur either within or around the homopolymer stretches.
Figure 5.

Representative SNPs called by PyroHMMsnp, but not by Samtools. (A) A homozygous SNP at locus 346 751. (B) A homozygous SNP at locus 389 456. (C) A heterozygous SNP at locus 38 248 603. (D) A heterozygous SNP at locus 59 275 582.
Figure 6 shows some representative cases in which the false SNPs induced by the misalignments are avoided by PyroHMMsnp, but called by Samtools. For the example shown in Figure 6A, the guanine homopolymer stretches at locus 75 319 are overcalled, and the cytosine homopolymer stretches at locus 75 324 are undercalled, thus shifting adenines at locus 75 323 one base pair away from the reference position and, in turn, causing the false mismatches. Figure 6B shows the misalignments, which resulted from incorporation asynchronization. That is, the adenines at locus 18 408 293 of both the top second read and the bottom read should be aligned with the adenine homopolymer stretches at locus 18 408 295. Thus, for situations where the mapping program inaccurately aligns the reads with sequencing errors, PyroHMMsnp is able to adjust the alignments according to the sequencing error model.
Figure 6.

Representative false discoveries called by Samtools, but not by PyroHMMsnp. (A) False mismatches at loci 75 323 and 75 324. (B) False mismatches at loci 18 408 293, 18 408 294 and 18 408 295. (C) False mismatches at loci 33 321 762 and 33 321 763. (D) False mismatches at loci 38 875 381, 38 875 382 and 38 875 383.
Compared with the results of Samtools, we found some interesting SNPs that were annotated in dbSNP, but not called by our method (Supplementary Figure S9). In the first example, PyroHMMsnp assumes, at most, two haplotypes for an individual genome and thus missed the SNP. In the second example, PyroHMMsnp did not call the SNP because the observation can be interpreted in two ways: the underlying haplotype having two mutations (rs544597 ‘A/T’ at site 17 814 145 and rs658674 ‘C/T’ at site 17 814 146) or the underlying haplotype having two indels (rs111593622 ‘-/A’ at site 17 814 144 and rs201082568 ‘-/C’ at site 17 814 146). PyroHMMsnp prefers not to call mutations at this confounding situation.
Application to 1000 genome sequencing data
To evaluate the performance in detecting SNPs in population genome sequencing data, we ran PyroHMMsnp and other tools on the 454 sequencing data of 15 CEU individuals for whom alignments are available from the 1000 Genome Project Phase I. The average coverage across chromosome 20 is ∼35×, combining data sets from all 15 individuals. The tandem repeats around the centromere are masked. The following results were achieved: (i) PyroHMMsnp called 105 482 SNPs, 104 332 (98.9%) of which were found in dbSNP. (ii) Samtools called 88 466 SNPs, 87 803 (99.3%) of which were found in dbSNP. (iii) VarScan called 74 977 SNPs, 73 713 (98.3%) of which were found in dbSNP. (iv) Atlas-SNP2 called 101 840 SNPs, 100 157 (98.3%) of which were found in dbSNP. Overall, PyroHMMsnp called many more SNPs than the other programs, and at the same time had the second best accuracy.
DISCUSSION
In this article, we have proposed an HMM-based SNP calling program, termed PyroHMMsnp, to model homopolymer sequencing errors in both 454 and Ion Torrent sequencing data. Through a set of simulation experiments based on the E. coli whole-genome sequencing data, as well as performance on the real human genome resequencing data and 1000 Genome sequencing data, we show that PyroHMMsnp significantly improves the accuracy of SNP detection, compared with other state-of-the-art programs.
Extension to detect short indels
It has been shown that the haplotype-based strategy can also improve the accuracy of the detection of insertions and deletions (indels) (19,36,37). To accomplish this in the next stage of our studies, we will efficiently enumerate the candidate haplotypes that contain the susceptible indels and SNPs. We will extend the proposed HMM model to construct the multiple sequence alignment to more efficiently enumerate the candidate haplotypes (38). The idea is similar to the partial order graph (39) or the variant graph (40). Finally, we will use the Bayesian framework to infer the most likely haplotypes that contain short indels or mutations.
Extension to account for incorporation asynchronization
Our proposed HMM could be extended to account for incorporation asynchronization, as well as CAFIE, which are also called phasing leading and phasing lagging, respectively, in the Ion Torrent community. This can be done by adding the auxiliary hidden states corresponding to these two asynchronization phenomena and changing the first order Markov chain to the second-order Markov chain. The proposed parameter estimation procedure described in this article could be used to train the second-order Markov model with a slight modification, and the Viterbi algorithm can be modified to account for the second-order Markov chain.
Computational complexity
The computational complexity of PyroHMMsnp is affected by four factors: (i) the size of the window  , in which the
  -Viterbi algorithm is used to align reads with the reference, (ii) the number of candidate variant sites within the sliding window,
  , in which we enumerate
  candidate haplotypes, (iii) the number of reads within the sliding window,
  , which is proportional to the sequencing coverage and (iv) the length of the genome
  . The total complexity is
  , where
  is the number of windows in the genome. Clearly, the exhaustive enumeration of 2z candidate haplotypes is the dominant factor controlling the actual running time. As such, the running time can be reduced if we can filter out non-polymorphic sites, or, in the alternative, design an algorithm to generate candidate haplotypes more efficiently. We will explore the multiple sequence alignment graph (38–40) or the assembly technique (37,41) to avoid exhaustive enumeration.
Extension to the detection of rare variants
Detecting rare variants is important for disease association studies (42). As the frequencies of rare variants can be much lower than the sequencing error rate, the major challenge is to distinguish real variants from sequencing errors. Because our HMM model has been shown to better capture the error patterns in pyrosequencing data, we believe that applying it to the population sequencing data can improve the detection of rare variants. Modifications to the Bayesian model are needed to consider low-frequency variants (43–45).
SUPPLEMENTARY DATA
Supplementary Data are available at NAR Online: Supplementary Figures 1–11, Supplementary Methods and Supplementary Experiments.
FUNDING
National Basic Research Program of China [2012CB316504]; the National High Technology Research and Development Program of China [2012AA020401]; the National Natural Science Foundation of China [61175002 and 60805010]; Tsinghua University Initiative Scientific Research Program, NIH Center of Excellence in Genomic Sciences [NIH/HG 2 P50 HG002790-06]; NIH/NHGRI 1U01 HG006531-01 and NSF/DMS ATD 7031026 (in part). Funding for open access charge: the National High Technology Research and Development Program of China.
Conflict of interest statement. None declared.
Supplementary Material
ACKNOWLEDGEMENTS
The authors thank Professor Xuegong Zhang for his support and helpful suggestions. They also thank the two anonymous reviewers for their insightful comments.
REFERENCES
- 1.Margulies M, Egholm M, Altman WE, Attiya S, Bader JS, Bemben LA, Berka J, Braverman MS, Chen YJ, Chen Z, et al. Genome sequencing in microfabricated high-density picolitre reactors. Nature. 2005;437:376–380. doi: 10.1038/nature03959. [DOI] [PMC free article] [PubMed] [Google Scholar]
- 2.Rothberg JM, Hinz W, Rearick TM, Schultz J, Mileski W, Davey M, Leamon JH, Johnson K, Milgrew MJ, Edwards M, et al. An integrated semiconductor device enabling non-optical genome sequencing. Nature. 2011;475:348–352. doi: 10.1038/nature10242. [DOI] [PubMed] [Google Scholar]
- 3.Sims PA, Greenleaf WJ, Duan H, Xie XS. Fluorogenic DNA sequencing in PDMS microreactors. Nat. Methods. 2011;8:575–580. doi: 10.1038/nmeth.1629. [DOI] [PMC free article] [PubMed] [Google Scholar]
- 4.Ronaghi M, Uhlen M, Nyren P. A sequencing method based on real-time pyrophosphate. Science. 1998;281:363–365. doi: 10.1126/science.281.5375.363. [DOI] [PubMed] [Google Scholar]
- 5.Ronaghi M. Pyrosequencing sheds light on DNA sequencing. Genome Res. 2001;11:3–11. doi: 10.1101/gr.11.1.3. [DOI] [PubMed] [Google Scholar]
- 6.Metzker ML. Sequencing technologies - the next generation. Nat. Revi. Genet. 2010;11:31–46. doi: 10.1038/nrg2626. [DOI] [PubMed] [Google Scholar]
- 7.Turcatti G, Romieu A, Fedurco M, Tairi AP. A new class of cleavable fluorescent nucleotides: synthesis and optimization as reversible terminators for DNA sequencing by synthesis. Nucleic Acids Res. 2008;36:e25. doi: 10.1093/nar/gkn021. [DOI] [PMC free article] [PubMed] [Google Scholar]
- 8.Shendure J, Ji H. Next-generation DNA sequencing. Nat. Biotechnol. 2008;26:1135–1145. doi: 10.1038/nbt1486. [DOI] [PubMed] [Google Scholar]
- 9.Balzer S, Malde K, Lanzen A, Sharma A, Jonassen I. Characteristics of 454 pyrosequencing data–enabling realistic simulation with flowsim. Bioinformatics. 2010;26:i420–i425. doi: 10.1093/bioinformatics/btq365. [DOI] [PMC free article] [PubMed] [Google Scholar]
- 10.Huse SM, Huber JA, Morrison HG, Sogin ML, Welch DM. Accuracy and quality of massively parallel DNA pyrosequencing. Genome Biol. 2007;8:R143. doi: 10.1186/gb-2007-8-7-r143. [DOI] [PMC free article] [PubMed] [Google Scholar]
- 11.Wheeler DA. The complete genome of an individual by massively parallel DNA sequencing. Nature. 2008;452:872–876. doi: 10.1038/nature06884. [DOI] [PubMed] [Google Scholar]
- 12.Brockman W, Alvarez P, Young S, Garber M, Giannoukos G, Lee WL, Russ C, Lander ES, Nusbaum C, Jaffe DB. Quality scores and SNP detection in sequencing-by-synthesis systems. Genome Res. 2008;18:763–770. doi: 10.1101/gr.070227.107. [DOI] [PMC free article] [PubMed] [Google Scholar]
- 13.Quinlan AR, Stewart DA, Stromberg MP, Marth GT. Pyrobayes: an improved base caller for SNP discovery in pyrosequences. Nat. Methods. 2008;5:179–181. doi: 10.1038/nmeth.1172. [DOI] [PubMed] [Google Scholar]
- 14.Shen Y, Wan Z, Coarfa C, Drabek R, Chen L, Ostrowski EA, Liu Y, Weinstock GM, Wheeler DA, Gibbs RA, et al. A SNP discovery method to assess variant allele probability from next-generation resequencing data. Genome Res. 2010;20:273–280. doi: 10.1101/gr.096388.109. [DOI] [PMC free article] [PubMed] [Google Scholar]
- 15.Hoberman R, Dias J, Ge B, Harmsen E, Mayhew M, Verlaan DJ, Kwan T, Dewar K, Blanchette M, Pastinen T. A probabilistic approach for SNP discovery in high-throughput human resequencing data. Genome Res. 2009;19:1542–1552. doi: 10.1101/gr.092072.109. [DOI] [PMC free article] [PubMed] [Google Scholar]
- 16.Marth GT, Korf I, Yandell MD, Yeh RT, Gu Z, Zakeri H, Stitziel NO, Hillier L, Kwok PY, Gish WR. A general approach to single-nucleotide polymorphism discovery. Nat. Genet. 1999;23:452–456. doi: 10.1038/70570. [DOI] [PubMed] [Google Scholar]
- 17.Li H. Improving SNP discovery by base alignment quality. Bioinformatics. 2011;27:1157–1158. doi: 10.1093/bioinformatics/btr076. [DOI] [PMC free article] [PubMed] [Google Scholar]
- 18.DePristo MA, Banks E, Poplin R, Garimella KV, Maguire JR, Hartl C, Philippakis AA, del Angel G, Rivas MA, Hanna M, et al. A framework for variation discovery and genotyping using next-generation DNA sequencing data. Nat. Genet. 2011;43:491–498. doi: 10.1038/ng.806. [DOI] [PMC free article] [PubMed] [Google Scholar]
- 19.Albers CA, Lunter G, MacArthur DG, McVean G, Ouwehand WH, Durbin R. Dindel: accurate indel calls from short-read data. Genome Res. 2011;21:961–973. doi: 10.1101/gr.112326.110. [DOI] [PMC free article] [PubMed] [Google Scholar]
- 20.Souaiaia T, Frazier Z, Chen T. ComB: SNP calling and mapping analysis for color and nucleotide space platforms. J. Comput. Biol. 2011;18:795–807. doi: 10.1089/cmb.2011.0027. [DOI] [PMC free article] [PubMed] [Google Scholar]
- 21.Kofler R, Teixeira Torres T, Lelley T, Schlotterer C. PanGEA: Identification of allele specific gene expression using the 454 technology. BMC Bioinformatics. 2009;10:143. doi: 10.1186/1471-2105-10-143. [DOI] [PMC free article] [PubMed] [Google Scholar]
- 22.Lysholm F. Highly improved homopolymer aware nucleotide-protein alignments with 454 data. BMC Bioinformatics. 2012;13:230. doi: 10.1186/1471-2105-13-230. [DOI] [PMC free article] [PubMed] [Google Scholar]
- 23.Churchill GA, Waterman MS. The accuracy of DNA sequences: estimating sequence quality. Genomics. 1992;14:89–98. doi: 10.1016/s0888-7543(05)80288-5. [DOI] [PubMed] [Google Scholar]
- 24.Li H, Handsaker B, Wysoker A, Fennell T, Ruan J, Homer N, Marth G, Abecasis G, Durbin R. The Sequence Alignment/Map format and SAMtools. Bioinformatics. 2009;25:2078–2079. doi: 10.1093/bioinformatics/btp352. [DOI] [PMC free article] [PubMed] [Google Scholar]
- 25.Vacic V, Jin H, Zhu JK, Lonardi S. A probabilistic method for small RNA flowgram matching. Pac. Symp. Biocomput. 2008:75–86. [PMC free article] [PubMed] [Google Scholar]
- 26.Zhang Z, Schwartz S, Wagner L, Miller W. A greedy algorithm for aligning DNA sequences. J. Comput. Biol. 2000;7:203–214. doi: 10.1089/10665270050081478. [DOI] [PubMed] [Google Scholar]
- 27.Ning Z, Cox AJ, Mullikin JC. SSAHA: a fast search method for large DNA databases. Genome Res. 2001;11:1725–1729. doi: 10.1101/gr.194201. [DOI] [PMC free article] [PubMed] [Google Scholar]
- 28.Li H, Durbin R. Fast and accurate long-read alignment with Burrows-Wheeler transform. Bioinformatics. 2010;26:589–595. doi: 10.1093/bioinformatics/btp698. [DOI] [PMC free article] [PubMed] [Google Scholar]
- 29.Durbin R, Eddy S, Krogh A, Mitchison G. Biological Sequence Analysis: Probabilistic Models of Proteins and Nucleic Acids. Cambridge: Cambridge University Press; 1999. [Google Scholar]
- 30.Dempster AP, Laird NM, Rubin DB. Maximum Likelihood from Incomplete Data via the EM Algorithm. J. R. Stat. Soc. Ser. B. 1977;39:1–38. [Google Scholar]
- 31.Julicher F, Bruinsma R. Motion of RNA polymerase along DNA: a stochastic model. Biophys. J. 1998;74:1169–1185. doi: 10.1016/S0006-3495(98)77833-6. [DOI] [PMC free article] [PubMed] [Google Scholar]
- 32.Tadigotla VR, Maoiléidigh DO, Sengupta AM, Epshtein V, Ebright RH, Nudler E, Ruckenstein AE. Thermodynamic and kinetic modeling of transcriptional pausing. Proc. Natl Acad. Sci. USA. 2006;103:4439–4444. doi: 10.1073/pnas.0600508103. [DOI] [PMC free article] [PubMed] [Google Scholar]
- 33.Elahi E, Ronaghi M. Pyrosequencing: a tool for DNA sequencing analysis. Methods Mol. Biol. 2004;255:211–219. doi: 10.1385/1-59259-752-1:211. [DOI] [PubMed] [Google Scholar]
- 34.Steen JA, Cooper MA. Fluorogenic pyrosequencing in microreactors. Nat. Methods. 2011;8:548–549. doi: 10.1038/nmeth.1634. [DOI] [PubMed] [Google Scholar]
- 35.Huang W, Li L, Myers JR, Marth GT. ART: a next-generation sequencing read simulator. Bioinformatics. 2012;28:593–594. doi: 10.1093/bioinformatics/btr708. [DOI] [PMC free article] [PubMed] [Google Scholar]
- 36.Li S, Li R, Li H, Lu J, Li Y, Bolund L, Schierup MH, Wang J. SOAPindel: Efficient identification of indels from short paired reads. Genome Res. 2013;23:195–200. doi: 10.1101/gr.132480.111. [DOI] [PMC free article] [PubMed] [Google Scholar]
- 37.Iqbal Z, Caccamo M, Turner I, Flicek P, McVean G. De novo assembly and genotyping of variants using colored de Bruijn graphs. Nat. Genet. 2012;44:226–232. doi: 10.1038/ng.1028. [DOI] [PMC free article] [PubMed] [Google Scholar]
- 38.Zeng F, Jiang R, Chen T. 2013 pyroHMMvar: a sensitive and accurate method to call short INDELS and SNPs for Ion Torrent and 454 data. Submitted. [Google Scholar]
- 39.Lee C, Grasso C, Sharlow MF. Multiple sequence alignment using partial order graphs. Bioinformatics. 2002;18:452–464. doi: 10.1093/bioinformatics/18.3.452. [DOI] [PubMed] [Google Scholar]
- 40.Homer N, Nelson S. Improved variant discovery through local re-alignment of short-read next-generation sequencing data using SRMA. Genome Biol. 2010;11:R99. doi: 10.1186/gb-2010-11-10-r99. [DOI] [PMC free article] [PubMed] [Google Scholar]
- 41.Li H. Exploring single-sample SNP and INDEL calling with whole-genome de novo assembly. Bioinformatics. 2012;28:1838–1844. doi: 10.1093/bioinformatics/bts280. [DOI] [PMC free article] [PubMed] [Google Scholar]
- 42.Abecasis GR, Auton A, Brooks LD, DePristo MA, Durbin RM, Handsaker RE, Kang HM, Marth GT, McVean GA. An integrated map of genetic variation from 1,092 human genomes. Nature. 2012;491:56–65. doi: 10.1038/nature11632. [DOI] [PMC free article] [PubMed] [Google Scholar]
- 43.Le SQ, Durbin R. SNP detection and genotyping from low-coverage sequencing data on multiple diploid samples. Genome Res. 2011;21:952–960. doi: 10.1101/gr.113084.110. [DOI] [PMC free article] [PubMed] [Google Scholar]
- 44.Bansal V, Harismendy O, Tewhey R, Murray SS, Schork NJ, Topol EJ, Frazer KA. Accurate detection and genotyping of SNPs utilizing population sequencing data. Genome Res. 2010;20:537–545. doi: 10.1101/gr.100040.109. [DOI] [PMC free article] [PubMed] [Google Scholar]
- 45.Garrison E, Marth G. Haplotype-based variant detection from short-read sequencing. eprint. 2012 arXiv:1207.3907v2. [Google Scholar]
Associated Data
This section collects any data citations, data availability statements, or supplementary materials included in this article.