

Abstract
The R6/2 mouse is a popular model of Huntington’s disease (HD) because of its rapid progression and measurable behavioral phenotype. Yet current behavioral phenotyping methods are usually univariate (e.g., latency to fall from a rotarod) and labor intensive. We used a force-plate actometer and specialized computer algorithms to partition the data into topographically specific behavioral categories that were sensitive to HD-like abnormalities. Seven R6/2 male mice and 7 wild type (WT) controls were placed in a 42 cm X 42 cm force-plate actometer for 20-min recording sessions at 6–7, 8–9, 10–11 and 12–13 weeks of age. Distance traveled, number of wall rears, and number of straight runs (traveling 175 mm or more in 1.5 s) were reduced in R6/2 relative to WT mice at all ages tested. Low mobility bouts (each defined as remaining continuously in a virtual circle of 15 mm radius for 5 s) were increased in R6/2 mice at 6–7 wk and beyond. Independent of body weight, force off-load during wall rears was reduced in R6/2 mice except at 6–7 wk. Power spectra of force variation during straight runs indicated an age-related progressive loss of rhythmicity in R6/2 compared to WT, suggesting gait dysrhythmia and dysmetria. Collectively, these data, which extend results obtained with other widely different behavioral phenotyping methods, document a multifaceted syndrome of motor abnormalities in R6/2 mice. We suggest, moreover, that the force-plate actometer offers a high-throughput tool for screening drugs that may affect symptom expression in R6/2 or other HD model mice.
1. Introduction
Huntington’s disease (HD) is a genetic, autosomal dominant, neurodegenerative disease that typically strikes in middle age with cognitive, motor and psychiatric symptoms [29]. Although the genetic mutation on chromosome 4 that is responsible for the progesssive emergence of symptoms was discovered in 1993, treatments remain palliative, and the mechanisms of neurodegeneration have been refractory to much research effort [29]. Promising areas of preclinical research in HD involve a variety of genetically defined models including mouse [12,16,22,26,27] and rat models [28]. Among the more popular of these models is the R6/2 mouse [13] which exhibits a rapidly progressing motor phenotype with death occurring at about 14 wk. In order to build a framework for translational use of this R6/2 model in preclinical studies of experimental therapeutic approaches with potential benefits for HD patients, investigators have used a range of behavioral assessment procedures to characterize the progression of symptoms. Rotarod [3,9,10,11,24], beam walking [3], swimming [3], open-field locomotion and rearing [20,9], open-field climbing [17, floor-level plus maze running [17], grip strength [9, 10,11,24], pre-pulse inhibition of acoustic startle [3], light-dark box (related to fear and anxiety; [9]), inked-foot print gait analysis [3], and running wheel engagement [9] have all been used informatively to show rapidly declining behavioral performance from about 4 weeks of age (depending on the test) onward in R6/2 mice compared to wild type (WT) controls. Within this context, the purpose of the current work was to assess the motor/behavioral phenotype of the R6/2 mouse by using a force-plate actometer [6,7], a single instrument that can currently measure, depending on the algorithms applied to the data, a variety of behavioral attributes, including distance traveled, number of straight runs, number and attributes of wall rears, number of episodes of “staying in one place”, and force-based gait parameters. Unlike other behavioral assessment procedures, moreover, the force plate does not require strict inter-rater reliability measures (e.g., Cohen’s kappa coefficient) and avoids laborious training and testing by users. Thus, the force plate is robust to human error and is an efficient and cost effective tool that can be used for behavioral assessments in preclinical drug screens. Accordingly, R6/2 and WT mice were studied in 20-min recording sessions at 2-wk intervals commencing at 6–7 wk of age and finishing at 12–13 wk of age.
2. Materials and Methods
2.1. Animals and care
Male transgenic R6/2 mice (B6CBA-TgN[HDexon1]62Gpb), which express an expanded CAG repeat in exon 1 of the human HD gene, and WT littermate controls are based on the C57BL/6J*CBA/J background strains with each strain contributing 50% of the genes. A WT F1 hybrid is crossed with a hemizygote hybrid. If the WT is a female, then a hemizygous male is used. If the WT is a male, then a hemizygote female is used. In the latter case, however, the ovaries are transplanted into a surrogate female because the hemizygote females are not fertile. R6/2 mice and their corresponding WTs were obtained from The Jackson Laboratories (Bar Harbor, ME) in two cohorts. The first cohort, consisting of four R6/2 and four WT mice, arrived at 5 weeks of age and were assessed beginning at 6 weeks of age. The second cohort (three R6/2 and three WT mice) arrived at 6 weeks of age and were assessed beginning at 7 weeks of age. When the data for the two cohorts were combined for analysis the age variable was stated as the average for the combined cohorts (i.e., 6 weeks and 7 weeks when combined was taken to be 6–7 weeks). The mice were housed individually in the departmental animal colony under standard conditions (12 hr light/dark cycle with lights on at 07:30) with access to food and water ad libitum. Behavioral assessments were conducted during the light phase of the diurnal cycle between 08:00 and 14:00. Both the housing and experimental use of animals followed the National Institutes of Health guidelines and were approved by the Institutional Animal Care and Use Committee. These procedures were designed to minimize the number of animals and their suffering.
2.2. Genotype and CAG Repeat Length
Genomic DNA was extracted from ~3 mm tail tissue samples in 150 μL cell lysis buffer (50 mM Tris, pH 8.0; 10 mM EDTA; 2% SDS) with proteinase K (10 mg/mL; 50 μg/reaction) at 55°C for 16 hr. Samples were then incubated at 37°C for 1 hr with both RNase T1 (5 units/reaction) and RNase A (10 units/reaction). Protein was removed from samples by mixing with 150 μL phenol:chloroform:isoamyl alchol (PCI, 25:24:1) and centrifugation at 13,000rpm for 10 min at 4°C. The upper aqueous layer was removed, treated again with 150 μL PCI, centifuged, and the aqueous layer was transferred to a new microcentrifuge tube. Samples were then mixed with 75 μL 7.5M ammonium acetate to concentrate DNA, after which 400 μL cold 95% ethanol were layered onto the solution to precipitate DNA. DNA was pelleted at 18,000 rpm for 10 min, and the supernatant was decanted. DNA pellets were washed twice with 700 μL 70% cold ethanol, air-dried for 10 min, re-suspended in 35 μL distilled water, and stored at 4°C.
PCR and analytical agarose gel electrophoresis were used to determine CAG repeat length. The upstream primer was 5′-GCGACCCTGGAAAAGCTGATG -3′ and downstream primer was 5′-GGCGGCTGAGGAAGCTGAGGA-3′. Each reaction consisted of 2.0 μL DNA template (20 to 80 ng/μL), 0.4 μl each primer (20 μM stock solution), 7.2 μL filter-sterilized HPLC water, and 10.0 μL 2x Biomix™ Red (Bioline USA Inc., Taunton, MA) for 20 μL total volume. Cycling conditions were 94°C for 90 s followed by 30 cycles of 94°C for 30 s, 62°C for 45 s, 72°C for 90 s with a final elongation at 72°C for 10 min. Electrophoresis of samples was performed in 4.0% NuSieve® 3:1 analytical agarose (Lonza Rockland, Inc., Rockland, ME) with 0.2 μg/mL ethidium bromide at 5V/cm for 180 min using a 100 bp ladder as DNA standard. Gels were evaluated with Kodak Image Station 4000R and Kodak Molecular Imaging software (Carestream Molecular Imaging, New Haven, CT) to confirm genotype and determine CAG repeat length. Using Clone Manager software (Sci-Ed Software, Cary, NC), we aligned primers to the huntingtin gene sequence acquired from the National Center for Biotechnology Information (www.ncbi.nlm.nih.gov). Alignment of primers to template indicated that the DNA fragment amplified by PCR is 104 bp longer than the CAG repeat region. Computer analysis of fragment migration against the 100 bp standard showed that our experimental R6/2 mice had 119.4 ± 1.2 (mean ± SEM) repeated CAG codons.
2.3. Behavioral Apparatus and Procedure
The apparatus was a force-plate actometer [6] with a square sensing surface measuring 42 cm on each side. Force samples from each of the four force transducers that supported the load plate were taken at a rate of 100 samples/s via a LabMaster interface controlled by a computer running custom-written Free Pascal software. Force measurement resolution was 0.33 gram equivalent weights, and temporal resolution was the force sampling rate. The apparatus used in the current study was constructed in the Fowler laboratory at the University of Kansas. A nearly identical version of the apparatus (“Force Plate Actimeter”) is being supplied by Bioanalytical Systems Inc. (BASi, West Lafayette, IN; http://www.basinc.com/products/iv/FPA/).
After being weighed, mice were placed individually in the actometer for 20 min recording sessions. Sessions were conducted two weeks apart for each mouse, thereby providing behavioral assessments at 6–7, 8–9, 10–11 and 12–13 weeks of age.
2.4. Dependent variables and quantitative methods
2.4.1. Clasping
Mice were suspended from the tail for 1 min to elicit clasping. It was scored on a scale from 0 to 3, where 0 represented no clasping, 1 = forepaws clasping, 2 = forepaws and one hind paw clasping, and 3 = all paws clasping (i.e., a full clasp). WT mice did not clasp and were not included in the analysis.
2.4.2. Distance traveled
This measure was the sum of the distances between coordinates of the location of center of force recorded every 0.50 s over the 20-min recording session. This measure of distance traveled emphasizes larger distances and reduces the contribution to distance estimation of very small movements occurring in rapid succession that are detected when 0.01 s is the time between points.
2.4.3. Number of straight runs
For each 20-min recording session, a computer algorithm identified all episodes of lateral movement on the actometer load plate that constituted ambulations or “runs” that covered a distance of 17.5 cm or more in a period of 1.5 s. In addition to providing information on the R6/2 and WT mice’s capacities to sustain locomotion over a multi-body-length distance, these runs were subjected to Fourier analysis as described below. In order for a run to qualify for inclusion in the analysis it had to have a nearly straight-line trajectory between its starting and ending point. Approximation to straightness was assessed by dividing each candidate run into two segments, one extending from the start point to the time midpoint and the second segment extending from the time midpoint to the end. These two segments plus the line from start point to end point comprised a triangle. If the obtuse angle of this triangle was greater than 160 degrees then the run was included in the analysis (180 degrees is a straight line). The grand mean of all angles of qualifying runs was 169 degrees (based on equal weighting of recording sessions).
2.4.4. Number of low mobility bouts
A bout of low mobility was defined as a mouse’s center of force remaining within a 15 mm radius circle for 5 s. The term low mobility is used to indicate that many types of normal mice regularly dwell “in one place” for several consecutive seconds, but while in that “place” they exhibit many small non-locomotor movements with an occasional half stride in any direction. The force plate’s high spatial resolution records these movements showing that, although the mouse would be described by most observers as staying “in one place”, the actuality is that the mouse is not immobile.
2.4.5. Latency to the first LMB of a session
This is the time from the beginning of the session to the occurrence of the first cessation of ambulation that lasts for 5.00 s. For statistical analysis these values were converted to Log10 values in order to make the data approximately normally distributed.
2.4.6. Number of Wall rears
During a wall rear, a mouse first supports all of its body weight on its two hind feet and then rests one or both fore feet on the wall of the chamber that confines the mouse to the load plate [5]; this paper includes validation data based on scoring of video recordings of behavior). By placing the fore feet on the wall, the mouse off-loads some of its body weight onto the wall. This force of off-load is recorded by the data acquisition software and an algorithm was written to detect and quantify these wall-rear events. Specifically, a wall rear was defined as an off-load of force greater than 5% and less than 40% of the body weight that endured for 0.25 s or more. The upper limit of 40 % was included so that jumping (completely leaving the load plate) would not be counted as a wall rear. The vertical force data were subjected a moving average smooth of 0.09 s and then converted to percent of body weight before the wall rear algorithm was applied to the data.
2.4.7. Wall rear off-load force and duration
In addition to detecting the occurrence of wall rears, the algorithm for wall rears also afforded measures of peak amount of force off-loaded as well as the duration of each wall-rear event.
2.4.8. Fourier analysis of vertical force variation during runs
The purpose of this analysis was to compare the R6/2 and WT mice in terms of the rhythmicity of force variation while ambulating. Each straight run, consisting of 150 samples of vertical force collected at 100 samples/s, was weighted by a Hanning data window and processed by MatLab’s Signal Processing Toolbox (The Math Works, Natick, MA) to yield a power spectrum. With these parameters, frequency resolution was 0.67 Hz. The 0–25 Hz segments of these power spectra for each run were then averaged for each mouse. Then, group mean power spectra (+/− 1 SEM) were plotted for inspection. In addition, the average spectra for each mouse were separated into low (0–4.9 Hz), medium (5.0–14.9 Hz) and high (15.0–25.0 Hz) frequency bands by integrating power across the frequency limits of each band.
2.5. Statistics
Repeated-measures analysis of variance (ANOVA, 2 types of mice as the between-group factor and 4 levels of age as the repeated measures factor) was used to assess experimental effects. In addition, planned comparisons between the two types of mice at each age point were carried out. Planned, instead of post hoc, comparison was the method selected to compare R6/2 and WT mice at each age because ample data have documented age-related deterioration of behavioral capabilities in the R6/2 mouse.
3. Results
3.1. Body weight and clasping
Table 1 lists the group mean body weights of the R6/2 and WT mice across the ages of behavioral assessment. The overall ANOVA statistics are provided in the last row of Table 2. These data show that the difference in body weight between R6/2 and WT mice was not significant until 12–13 wk of age. Self clasping did not occur in the WT mice. The group mean clasping scores for the R6/2 mice were 2.0, 2.4, 3.0 and 2.9, for weeks 6–7, 8–9, 10–11 and 12–13, respectively.
Table 1.
Group mean body weights (standard error of the mean, SEM) in grams as a function of age.
| Mouse type | Age in weeks | |||||||
|---|---|---|---|---|---|---|---|---|
| 6–7 | 8–9 | 10–11 | 12–13 | |||||
| Mean | SEM | Mean | SEM | Mean | Sem | Mean | SEM | |
| R6/2, n=7 | 24.3 | 1.1 | 27.0 | 1.0 | 27.3 | 1.0 | 24.0 | 1.1 |
| WT, n=7 | 23.9 | 0.8 | 27.7 | 0.9 | 29.7 | 1.2 | 32.1a | 1.6 |
p<.01 comparing R6/2 with WT mice
Table 2.
Summary of analysis of variance results for the ten indicated behavioral measures used to compare R6/2 (n=7) and WT mice (n=7).
| MEASURE | Analysis of variance effecta | ||||||||
|---|---|---|---|---|---|---|---|---|---|
| Type (R6/2 vs WT) | Age | Type by Age | |||||||
| df1,1 | F | p | df1,2 | F | p | df1,2 | F | p | |
| Distance traveled | 1, 12 | 24.88 | <.001 | 3, 36 | 2.79 | ns | 3, 36 | 2.26 | ns |
| Number of runs | 1, 12 | 11.99 | =.005 | 3, 36 | 2.95 | =.046 | 3, 36 | 0.66 | ns |
| Number of LMBb | 1, 12 | 32.56 | <.001 | 3, 36 | 0.48 | ns | 3, 36 | 0.29 | ns |
| Latency to 1st LMB | 1, 12 | 7.31 | =.019 | 3, 36 | 3.33 | =.03 | 3, 36 | 2.53 | ns |
| Number of wall rears | 1, 12 | 32.85 | <.001 | 3, 36 | 3.52 | =.025 | 3, 36 | 0.56 | ns |
| WRc off-load force | 1, 12 | 11.88 | =.005 | 3, 36 | 0.46 | ns | 3, 36 | 1.17 | ns |
| Run spectrum (low band) | 1, 12 | 10.27 | =.008 | 3, 36 | 1.64 | ns | 3, 36 | 4.59 | =.008 |
| Run spectrum (med band) | 1, 12 | 10.31 | =.007 | 3, 36 | 6.18 | =.002 | 3, 36 | 1.85 | ns |
| Run spectrum (high band) | 1, 12 | 9.27 | =.01 | 3, 36 | 21.61 | <.001 | 3, 36 | 32.43 | <.001 |
| Body weight | 1, 12 | 3.44 | ns | 3, 36 | 22.92 | <.001 | 3, 36 | 19.17 | <.001 |
significant probabilities are in bold font,
LMB indicates low mobility bout,
WR means wall rear
3.2. Distance traveled and number of runs
As shown in Fig. 1, with supporting ANOVA statistics in Table 2, both distance traveled and number of runs were significantly lower in R6/2 mice compared to controls. Differences between the R6/2 and WT mice on both measures were significant at the earliest age of behavioral assessment. The length of individual runs (data not shown) did not differ by genetic status nor by age.
Figure 1.

Group mean distance traveled (top set of axes) and mean number of straight runs exhibited by R6/2 (n=7) and WT (n=7) mice during 20-min recordings sessions a four different ages. Brackets indicate ± 1 SEM; * and ** denote p<.05 and p<.01, respectively. See methods for details on how straight runs were defined.
3.3. Low mobility bouts and latency to the first bout
Fig. 2 shows that R6/2 mice had 3.5 to 4 times as many bouts of low mobility as the WT mice (see Table 2), and this difference was evident at 6–7 weeks of age. R6/2 mice engaged in their first bout of low mobility earlier in the 20-min session than the WT mice at 10–11 and 12–13 weeks of age.
Figure 2.

Group mean number of low mobility bouts (LMB) and mean log10 latency (bottom panel) to the occurrence of the first LMB in the recording session. Latency was recorded in 0.01 s units; thus, 4.0 on the ordinate of log10 latencies reprsents 10,000 units or 100 s. See Fig. 1 caption for labeling conventions.
3.4. Wall rears
Data presented in Fig. 3 show that the number of wall rears in R6/2 mice was significantly lower than in WT mice, and this effect was prominent at all four ages of testing. In regard to force off-load during wall rears, Fig. 3 shows that during wall rears by the R6/2 mice less force was transferred to the wall of the chamber compared to what was observed for the WT mice. This effect cannot be an artifact of differences in body weight per se because R6/2 and WT mice did not differ from one another until 12–13 wk of age. Moreover, the force data for the wall-rear analysis were expressed as a percent of each mouse’s body weight. The median wall rear duration (data not shown) was calculated for each mouse for each session, and there was a non significant trend toward longer wall rears in the R6/2 mice compared to the WT mice.
Figure 3.

Group mean number of wall rears and the corresponding mean off-load force during wall rears at the indicated ages of testing. % bw indicates that force was expressed as percent of each mouse’s body weight. See Fig. 1 caption for labeling conventions.
3.5. Power spectra of force variation during runs
In Fig. 4 are plotted illustrative time series of force variations of single runs, one for an R6/2 mouse (top) and another for a WT mouse (bottom) at 12–13 weeks of age. The corresponding power spectra of the time series are shown on the right side of Fig. 4. The distance traveled in the 1.5 s shown for the R6/2 mouse in Fig. 4 was 231 mm, and for the WT mouse the distance covered in 1.5 s was 228 mm. For the WT mouse, force underwent a series of prominent oscillations from about 0.2 s to 1.0 s, and the corresponding power spectrum displays a distinctive, narrow-band peak in power near 10 Hz. In contrast, although the R6/2 mouse covered the same distance (within 3 mm), it produced a less rhythmic, higher frequency, lower power, and broader-band spectrum than the WT mouse.
Figure 4.
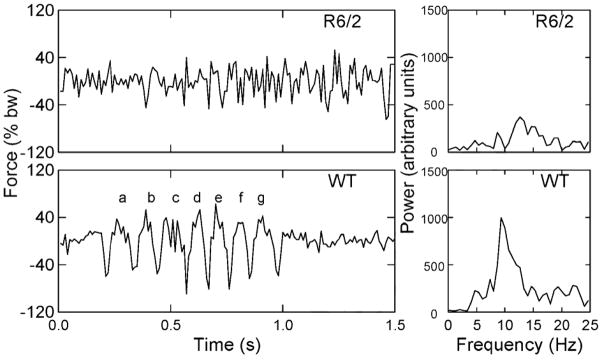
Time series of vertical force and corresponding power spectra of two approximately equal-distance straight runs executed in 1.5 s. by an R6/2 and a WT mouse at 12–13 weeks of age. The force data were expressed as a percent of body weight (% bw), thereby making the amplitude of force variation independent of body weight. The lower case letters on the face of the WT time series graph label consecutive half strides during this run. At “a” two diagonally opposite feet (e.g., left front, right rear) strike the load plate simultaneously and also push off together; at “b”, the other two diagonally opposite feet (right front, left rear) strike and push off together. Force variations at “a” and “b” thus represent one stride.
Group average power spectra for all runs (equally weighted by mouse and test session) in the data set are plotted in Fig. 5. These data show that the power spectra for the WT mice had substantially more power concentrated near 10 Hz than the R6/2 mice, and this separation between the two types of mice was consistent across all four ages of behavioral assessment. In the high frequency band (15 to 25 Hz), there was a progressive growth in power as a function of age for the R6/2 mice but not for the WT mice. This age related change can be appreciated by noting how the thick line in the 15–25 Hz region at week 6–7 is below the thin line, but by week 12–13 the thick line is substantially above the thin line. A three-way ANOVA (2 mouse types by 4 ages at testing by 3 frequency bands) was applied to the data shown in Fig. 5 after the data had been collapsed into 3 separate frequency bands (low, medium, and high) as described in methods. This analysis showed that all main effects, except mouse type, and all interaction effects (both two and three way) were significant with p<.001. The fact that mouse type interacted significantly with age and frequency band and inspection of Fig. 5 together suggested that the most informative analysis would be post hoc two-way ANOVA’s for each of the three frequency bands separately. These statistical results are shown in Table 2 (see “Run spectrum (low band)” etc.). The ANOVA’s show significant differences between R6/2 and WT mice for each frequency band. The largest F’s and p values were obtained for the high-frequency (15–25 Hz) portion of the power spectrum (see Table 2). The cell means of the two-way ANOVA for the high-frequency band, plotted in Fig. 6, show that high band power in the R6/2 mice increased progressively and nearly linearly as a function of advancing age, whereas the WT mice remained nearly constant across age on this variable.
Figure 5.
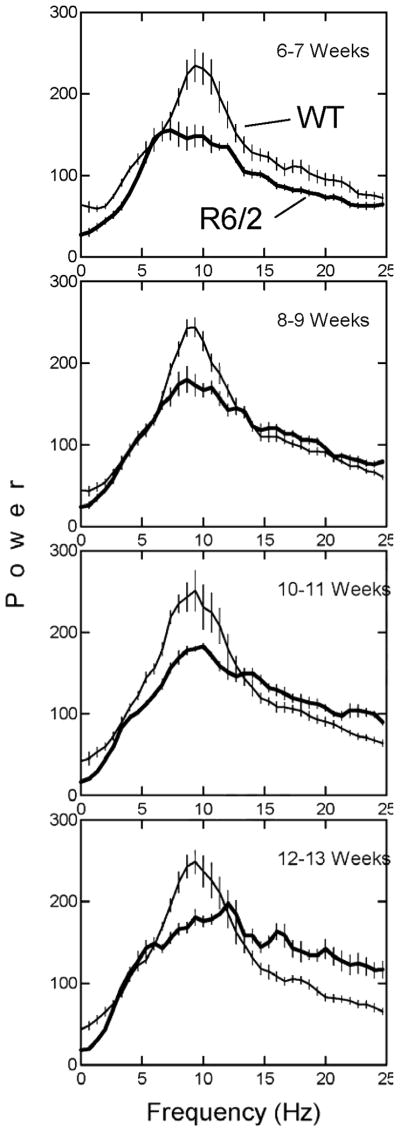
Group mean power spectra for vertical force variation during runs for R6/2 (thick lines) and WT mice (thin lines). Thin vertical lines indicate ± 1 SEM for each elementary frequency band in the spectrum.
Figure 6.

Integrated power in the 15–25 Hz band of the power spectrum of force variations of runs (bouts of brief but relatively fast, straight ambulations) for R6/2 mice and WT controls tested in a force plate actometer at the indicated ages. Brackets indicate ± 1 SEM, and ** denote p<.01.
4. Discussion
Based on number of CAG repeats, timing of body weight loss, and clasping scores, the R6/2 and WT mice used in this study appeared to be typical of these kinds of mice as reported in several prior studies [3,9,17,20,21] and were not an aberrant sample.
The distance traveled variable (Fig. 1) revealed that the R6/2 mice accumulated less horizontal distance in 20 min than the WT mice. Out of a sampling of seven biobehavioral studies that used R6/2 mice [3,9,13,17,20,21,24], two used total distance moved [9, 21]. In the one report [21] that used “number of square crossings” in an open field (10-min test), WT mice exhibited more locomotion than R6/2 mice, but the difference was not statistically significant. In another report [9], distance moved was recorded with infrared photo beam breaks (25.4 X 25.2 cm; sensors 0.76 cm apart) in 15-min sessions, and R6/2 mice moved significantly less than WT mice at 4 and 8 wk of age. In the current report, which used a longer session (20 min) and higher spatial resolution (2 mm) than the two cited examples, R6/2 mice traveled significantly less than WT mice across all four ages tested. Together, these locomotor activity data suggest that not only do R6/2 mice move less than WT mice beginning at relatively early ages, but also spatial resolution of measurement and duration of recording session can influence the results.
With regard to number of low mobility bouts, a measure reflecting the degree to which the mice remain in a circumscribed area for 5 s, the R6/2 exhibited approximately a 3-fold greater tendency to remain in one place compared to the WT mice (see Fig. 2). This result was foreshadowed by a previous study [20] showing that R6/2 mice spend a considerable amount of time at “quiet rest” in a 15-min open field test, while WT mice do not engage in quiet rest in a test of this duration. It is conceivable, though speculative, that the often observed rotarod performance deficits in R6/2 mice [e.g., 3,9,24] is related to their proclivity to stop locomotor movements. For the R6/2 mice, the latency to the first episode of low mobility within a session (Fig. 2, bottom panel) was significantly shorter than for the WT mice at ages 10–11 and 12–13 wk, suggesting that this variable is related to progression. Expression of low mobility bouts early in a session may be a manifestation of fatigue-like effects in the context of progressively declining force-production capacity.
Wall rears were included in these analyses for three reasons. First, because wall rears are identifiable responses with distinct beginning and ending points, they hold the potential for revealing how, as the mouse spontaneously expresses this behavior, neurological dysfunction is manifest in the execution of “voluntary” motor behavior apart from ambulation per se and without prior training. Second, prior work [7] indicated that D2 knockout mice have significantly prolonged wall rears, a finding suggesting difficulty in response termination in D2 knockouts, which is consistent with the hypothesis that D2 knockouts express Parkinson disease-like symptoms [2,7]. Thus, because Parkinson’s disease is characterized by prominent striatal dysfunction, it was suspected that mice modeling HD, which is a disease of striatal dysfunction, may exhibit wall rear abnormalities. A third reason for analyzing wall rears is that previous reports [9,20] have provided evidence that the occurrence of rearing is diminished in R6/2 compared to WT mice. Data in Fig. 3 show that R6/2 mice displayed about half as many wall rears in 20 min as the WT mice. This difference between R6/2 and WT mice may partly be a byproduct of the lessened tendency of the R6/2 mice to express locomotor activity in the actometer because amount of locomotion is often, but not always [30], positively correlated with number of rears. However, this interpretation does not easily explain why the force off-load during rears by R6/2 mice was significantly lower than that of the WT’s (Fig. 3, lower set of axes). From a physical perspective, and in the absence of body weight differences, the lessened off-load force in the R6/2’s compared to the WT’s could be a result of diminished force production by the musculature used during the rear. Another possibility is that the R6/2 adopts a form of the rear response where the hind limbs in the R6/2 are positioned closer to the wall during the rear than the WT, thereby leading to less weight off-load onto the wall. Given the complexity of the muscle dynamics and changing response topography during a wall rear, more detailed study will be needed to gain a thorough understanding of the current results for wall rearing. Nevertheless, the wall rear measure distinguished between R6/2 and WT mice. Off-load force was not reported in the aforementioned paper on D2 knockout mice [7], but sufficient comparative data were given there to conclude that R6/2 and D2 knockout mice differ with respect to wall rears in two ways: 1) D2 knockouts had substantially prolonged wall rears, but R6/2 mice did not; and 2) D2 knockout mice had near control level numbers of wall rears, but R6/2 mice had a greatly diminished numbers of wall rears compared to WT controls.
Although gross measures of locomotion (e.g., Fig. 1, upper axes) indicated less activity in R6/2 than WT mice, aggregated measures of distance traveled do not provide information about how the details of locomotion may be different in R6/2 and WT mice. The inked-foot gait analysis method has revealed a type of gait dysmetria in R6/2 mice [e.g., 3]. In addition, gait disturbance is a prominent feature of the human symptoms of HD [19]. Thus, the analysis of gait measures during locomotion in mouse models of HD may provide an important homology with human HD. By restricting our Fourier analysis to force variations during runs, we showed that ground-reaction forces were significantly less rhythmic in R6/2 than those of WT mice. Our data taken together with prior results on the dynamics of rodent gait [4,8,18,31] enable the interpretation that the R6/2’s gait dysfunction involves a lack of capacity for diagonal limb pairs to strike the support floor in unison. As shown in Fig. 4 for the WT mouse, the expected pattern for normal gait at these speeds (~0.15 m/s) is a regular waxing and waning of force as the right forelimb and left hindlimb strike together followed by a the left forelimb and right hindlimb hitting the floor at the same time, and so on. The pronounced rapid force decreases and increases between the stance phases represent the swing phases in which the mouse’s body is propelled upward (recorded force decreases) and forward before the next pair of foot strikes occur together. The current results in the R6/2 mouse suggest that the precision of temporal control of limb placement is insufficient to support the same number and regularity of simultaneous foot strikes as produced by WT mice, despite the fact that locomotor speeds of about ~0.15 m/s are achieved (compare with [18] analysis of running in hemiparkinson rats). Impairment in force production by the limbs could also be involved in the R6/2 mouse’s gait irregularities as suggested by reports that R6/2 mice have reduced grip strength in forelimbs [9,24] and hindlimbs [24]. Irregularly timed muscle contraction in the limbs and their lack of force production could account for reported rotarod deficits [3,9,24] and beam-walking difficulties [3].
In regard to the power spectra shown in Fig. 5, it should be noted that these data were computed separately at each age and were corrected for body weight such that the variations in force were expressed as a percent of the body weight. Therefore, the diminished peak height for the R6/2 mice in the middle frequency band (centered at 10 Hz) compared to the same band for the WT mice cannot be the result of body weight differences. In addition, it should be recalled that body weight differences were significant only at 12–13 wk (see Table 1) but spectral differences between R6/2 and WT mice are apparent at all 4 ages. The plot for 8–9 wk in Fig. 5 shows that the power spectra are similar except in the region from about 7 to 12 Hz, where the R6/2 mice have a diminished peak relative to the WT mice. Data for the 8–9 wk time point in Fig. 5 illustrate the fact that a degree of stride rhythmicity is present in the R6/2 mice but their force production is diminished compared to the WT mice of the same age.
Comparing ages of symptom onset and rates of symptom progressions across published reports on HD model mice is complicated by several influential variables, including length of CAG repeats, background strain (usually inbred strain), housing/enrichment/exercise conditions, and differences in behavioral assessment methods.
In regard to CAG repeat length in R6/2 mice, over a range of 165–175 repeats, it has been reported that from 9 wk of age onward body weight loss increased as a function of repeat length [1]. However in another report on R6/2 mice with CAG repeats ranging from 175 to beyond 200, an increase in length was correlated with increased life span [23]. In a more recent paper [5], repeat lengths ≥ 335 in R6/2 mice resulted an abrupt increase in life span compared to R6/2 mice with 150 CAG repeats. Together these data suggest that the association between CAG repeat length and severity of HD-like pathology in R6/2 mice is non linear. A potential explanation for the nonlinearity offered by [5] is that repeat lengths longer that 175 produce a form of the mutant huntingtin protein that is too large to enter the nucleus to contribute to the burden of neuronal intranuclear inclusions that are one sign of the HD-like neuropathology in R6/2 mice with CAG repeat lengths in the 120 to 175 range.
The background strain of mouse in which the HD-inducing genetic construct is expressed can affect both the degree of intergenerational stability of the construct and the strain-specific traits that affect estimates of behavioral performance when the HD model mice are probed for disability. In the context of the R6/2 model, transmission of the CAG repeat to the next generation is associated with repeat expansion in males [14]. A breeding scheme to overcome this instability has been devised [11] for the R6/2 model. Instability of CAG transmission has also been observed for HdhQ111 knock-in mice [12], and the degree of stability depended on whether the background strain was C57BL/6, FVB/N or 129 (assumed to be the SvJ substrain, but not stated in [12]). These data highlight the importance of genotyping the HD-model mice used in biobehavioral research as well as carefully considering what background strain to use. The effect of background strain in the YAC128 transgenic HD model mouse has been clearly documented [27] in a study that compared FVB/N, C57BL/6, and 129 mice harboring the transgene. For 1-yr-old WT mice, the 129 strain exhibited the lowest rotarod score, the lowest rotarod learning score and the least amount of locomotor activity in the open field assessment. At the same age, the FVB-YAC128 mice displayed the greatest deterioration in performance measures on these three tests expressed as a percent of FVB-WT behaviors. Unlike most of the HD transgenic mouse models, the FVB–YAC128 mice had a large (27%) increase in body weight compared to FVB-WT controls at 1 yr. Not discussed was the possibility that poor performance by the FVB/N-YAC128 mice on the three motor tasks was a by-product of biomechanical factors associated with a larger body mass (e.g., constriction of limb movement by adipose tissue, increased body mass to muscle ratio, etc.).
Several reports show that housing conditions in the form of an enriched environment and/or access to a running wheel can have a substantial ameliorative effect on the expression of behavioral disability in HD transgenic mice (R6/2 mice [10], N171-82Q mice [22], and R6/1 mice [25, 26]). Furthermore, running wheel access from a juvenile age in R6/1 mice was shown to have a symptom-reducing effect even when the housing conditions were not highly enriched [25]. However, these enrichment/exercise effects did not increase life span or reduce neuropathological markers in the HD model mice [22, 25]. The beneficial effects of enriched housing and/or exercise (together conceptualized as motor experience) on HD-related behavioral deficits suggest that extensive behavioral testing itself could change expression of disability in longitudinal designs.
Differences in behavioral assessment methods can cause problems in making direct comparisons across HD mouse models. Although nine of the reports cited here used transgenic HD models and rotarod-based behavioral assays [3, 9, 10, 11, 22, 23, 24, 25, 27], neither the rotarod hardware nor the assessment procedures were uniform. For example, three of the papers [22, 23, 24] used instruments supplied by Columbus Instruments (CI) and six [3, 9, 10, 11, 25, 27] reported using instruments made by Ugo Basile (UB). Some CI rotarods come equipped with an electric shocker to punish falling. One report used this CI feature [23], while the other two CI-based reports were silent on the use of shock [22, 24]. Of the six papers that used the UB instrument, three [9, 10, 11] covered the mouse-support cylinder with smooth rubber to prevent clinging; one [25] did not make this modification, and one [27] was silent on the issue. The duration of trials and intertrial intervals also varied widely in this relatively small sample of reports. For example, trial durations were as brief as 60 s [24] or as long as 10 min [9, 10, 11], while intertrial intervals were not reported [3, 10, 11, 24, 25] or, when reported, they ranged from 10 min [9, 22, 23] to 2 h [27].
The results reported here complement and extend prior efforts to characterize the behavioral deficits of R6/2 HD model mice and are generally consistent with this work [3,9,10,11,13,17,20,21,24]. However, whereas most prior work has relied on a battery of assessment procedures involving multiple types of apparatus (e.g., rotarod, beam walk, inked-foot print gait analysis, open field, grip strength dynamometer, running wheels, climbing cage, etc.), the current approach used a single apparatus from which multiple types of functional descriptors were extracted from a data stream rich in information about the mouse’s spontaneous behavior. Aside from the fact that the force-plate actometer method requires only one instrument, the labor cost of administering the procedure is also quite low compared to assessments requiring continuous investigator attention (e.g., rotarod, beam walk, etc.). Thus, the behavioral phenotyping approach taken here is suitable for use in settings that evaluate experimental therapies where high-throughput and low labor cost would be especially important considerations.
Acknowledgments
This work was supported by NIH grants MH043429, HD002528, NS035663, and the Indiana (METACyt) Initiative of Indiana University, funded in part through a major grant from the Eli Lilly Foundation, Inc.
Footnotes
Publisher's Disclaimer: This is a PDF file of an unedited manuscript that has been accepted for publication. As a service to our customers we are providing this early version of the manuscript. The manuscript will undergo copyediting, typesetting, and review of the resulting proof before it is published in its final form. Please note that during the production process errors may be discovered which could affect the content, and all legal disclaimers that apply to the journal pertain.
References
- 1.Aziz NA, van der Burg JM, Landwehrmeyer GB, Brundin P, Stijnen T, Roos RA EHDI StudyGroup. Weight loss in Huntington disease increases with higher CAG repeat number. Neurology. 2008;71:1506–13. doi: 10.1212/01.wnl.0000334276.09729.0e. [DOI] [PubMed] [Google Scholar]
- 2.Baik JH, Picetti R, Saiardi A, Thiriet G, Dierich A, Depaulis A, Le Meur M, Borrelli E. Parkinsonian-like locomotor impairment in mice lacking dopamine D2 receptors. Nature. 1995;377:424–428. doi: 10.1038/377424a0. [DOI] [PubMed] [Google Scholar]
- 3.Carter RJ, Lione LA, Humby T, Mangiarini L, Mahal A, Bates GP, Dunnett SB, Morton AJ. Characterization of progressive motor deficits in mice transgenic for the human Huntington’s disease mutation. J Neurosci. 1999;19:3248–3257. doi: 10.1523/JNEUROSCI.19-08-03248.1999. [DOI] [PMC free article] [PubMed] [Google Scholar]
- 4.Clarke KA, Smart L, Still J. Ground reaction force and spatiotemporal measurements of the gait of the mouse. Behav Res Methods Instrum Comput. 2001;33:422–426. doi: 10.3758/bf03195396. [DOI] [PubMed] [Google Scholar]
- 5.Dragatsis I, Goldowitz D, Del Mar N, Deng YP, Meade CA, Liu L, Sun Z, Dietrich P, Yue J, Reiner A. CAG repeat lengths >/=335 attenuate the phenotype in the R6/2 Huntington’s disease transgenic mouse. Neurobiol Dis. 2008 Nov 6; doi: 10.1016/j.nbd.2008.10.009. Epub ahead of print. [DOI] [PMC free article] [PubMed] [Google Scholar]
- 6.Fowler SC, Birkestrand BR, Chen R, Moss SJ, Vorontsova E, Wang G, Zarcone TJ. A force-plate actometer for quantitating rodent behaviors: illustrative data on locomotion, rotation, spatial patterning, stereotypies, and tremor. J Neurosci Methods. 2001;107:107–124. doi: 10.1016/s0165-0270(01)00359-4. [DOI] [PubMed] [Google Scholar]
- 7.Fowler SC, Zarcone TJ, Vorontsova E, Chen R. Motor and associative deficits in D2 dopamine receptor knockout mice. Int J Dev Neurosci. 2002;20:309–321. doi: 10.1016/s0736-5748(02)00009-6. [DOI] [PubMed] [Google Scholar]
- 8.Herbin M, Gasc JP, Renous S. Symmetrical and asymmetrical gaits in the mouse: patterns to increase velocity. Comp Physiol A Neuroethol Sens Neural Behav Physiol. 2004;190:895–906. doi: 10.1007/s00359-004-0545-0. [DOI] [PubMed] [Google Scholar]
- 9.Hickey MA, Gallant K, Gross GG, Levine MS, Chesselet MF. Early behavioral deficits in R6/2 mice suitable for use in preclinical drug testing. Neurobiol Dis. 2005;20:1–11. doi: 10.1016/j.nbd.2005.01.024. [DOI] [PubMed] [Google Scholar]
- 10.Hockly E, Cordery PM, Woodman B, Mahal A, van Dellen A, Blakemore C, Lewis CM, Hannan AJ, Bates GP. Environmental enrichment slows disease progression in R6/2 Huntington’s disease mice. Ann Neurol. 2002;51:235–42. doi: 10.1002/ana.10094. [DOI] [PubMed] [Google Scholar]
- 11.Hockly E, Woodman B, Mahal A, Lewis CM, Bates G. Standardization and statistical approaches to therapeutic trials in the R6/2 mouse. Brain Res Bull. 2003;61:469–79. doi: 10.1016/s0361-9230(03)00185-0. [DOI] [PubMed] [Google Scholar]
- 12.Lloret A, Dragileva E, Teed A, Espinola J, Fossale E, Gillis T, Lopez E, Myers RH, MacDonald ME, Wheeler VC. Genetic background modifies nuclear mutant huntingtin accumulation and HD CAG repeat instability in Huntington’s disease knock-in mice. Hum Mol Genet. 2006;15:2015–24. doi: 10.1093/hmg/ddl125. [DOI] [PubMed] [Google Scholar]
- 13.Mangiarini L, Sathasivam K, Seller M, Cozens B, Harper A, Hetherington C, Lawton M, Trottier Y, Lehrach H, Davies SW, Bates GP. Exon 1 of the HD gene with an expanded CAG repeat is sufficient to cause a progressive neurological phenotype in transgenic mice. Cell. 1996;87:493–506. doi: 10.1016/s0092-8674(00)81369-0. [DOI] [PubMed] [Google Scholar]
- 14.Mangiarini L, Sathasivam K, Mahal A, Mott R, Seller M, Bates GP. Instability of highly expanded CAG repeats in mice transgenic for the Huntington’s disease mutation. Nat Genet. 1997;15:197–200. doi: 10.1038/ng0297-197. [DOI] [PubMed] [Google Scholar]
- 15.Menalled LB, Sison JD, Dragatsis I, Zeitlin S, Chesselet MF. Time course of early motor and neuropathological anomalies in a knock-in mouse model of Huntington’s disease with 140 CAG repeats. J Comp Neurol. 2003;465:11–26. doi: 10.1002/cne.10776. [DOI] [PubMed] [Google Scholar]
- 16.Menalled LB. Knock-in mouse models of Huntington’s disease. NeuroRx. 2005;2:465–70. doi: 10.1602/neurorx.2.3.465. [DOI] [PMC free article] [PubMed] [Google Scholar]
- 17.Miller BR, Dorner JL, Shou M, Sari Y, Barton SJ, Sengelaub DR, Kennedy RT, Rebec GV. Up-regulation of GLT1 expression increases glutamate uptake and attenuates the Huntington’s disease phenotype in the R6/2 mouse. Neuroscience. 2008;153:329–337. doi: 10.1016/j.neuroscience.2008.02.004. [DOI] [PMC free article] [PubMed] [Google Scholar]
- 18.Muir GD, Whishaw IQ. Ground reaction forces in locomoting hemi-parkinsonian rats: a definitive test for impairments and compensations. Exp Brain Res. 1999;126:307–314. doi: 10.1007/s002210050739. [DOI] [PubMed] [Google Scholar]
- 19.Rao AK, Muratori L, Louis ED, Moskowitz CB, Marder KS. Spectrum of gait impairments in presymptomatic and symptomatic Huntington’s disease. Mov Disord. 2008;23:1100–1107. doi: 10.1002/mds.21987. [DOI] [PubMed] [Google Scholar]
- 20.Rebec GV, Barton SJ, Ennis MD. Dysregulation of ascorbate release in the striatum of behaving mice expressing the Huntington’s disease gene. J Neurosci. 2002;22:RC202. doi: 10.1523/JNEUROSCI.22-02-j0006.2002. [DOI] [PMC free article] [PubMed] [Google Scholar]
- 21.Rebec GV, Barton SJ, Marseilles AM, Collins K. Ascorbate treatment attenuates the Huntington behavioral phenotype in mice. Neuroreport. 2003;14:1263–1265. doi: 10.1097/00001756-200307010-00015. [DOI] [PubMed] [Google Scholar]
- 22.Schilling G, Savonenko AV, Coonfield ML, Morton JL, Vorovich E, Gale A, Neslon C, Chan N, Eaton M, Fromholt D, Ross CA, Borchelt DR. Environmental, pharmacological, and genetic modulation of the HD phenotype in transgenic mice. Exp Neurol. 2004;187:137–49. doi: 10.1016/j.expneurol.2004.01.003. [DOI] [PubMed] [Google Scholar]
- 23.Schilling G, Coonfield ML, Ross CA, Borchelt DR. Coenzyme Q10 and remacemide hydrochloride ameliorate motor deficits in a Huntington’s disease transgenic mouse model. Neurosci Lett. 2001;315:149–53. doi: 10.1016/s0304-3940(01)02326-6. [DOI] [PubMed] [Google Scholar]
- 24.Stack EC, Kubilus JK, Smith K, Cormier K, Del Signore SJ, Guelin E, Ryu H, Hersch SM, Ferrante RJ. Chronology of behavioral symptoms and neuropathological sequela in R6/2 Huntington’s disease transgenic mice. J Comp Neurol. 2005;490:354–370. doi: 10.1002/cne.20680. [DOI] [PubMed] [Google Scholar]
- 25.van Dellen A, Cordery PM, Spires TL, Blakemore C, Hannan AJ. Wheel running from a juvenile age delays onset of specific motor deficits but does not alter protein aggregate density in a mouse model of Huntington’s disease. BMC Neurosci. 2008;9:34. doi: 10.1186/1471-2202-9-34. [DOI] [PMC free article] [PubMed] [Google Scholar]
- 26.van Dellen A, Blakemore C, Deacon R, York D, Hannan AJ. Delaying the onset of Huntington’s in mice. Nature. 2000;404:721–2. doi: 10.1038/35008142. [DOI] [PubMed] [Google Scholar]
- 27.van Raamsdonk JM, Metzler M, Slow E, Pearson J, Schwab C, Carroll J, Graham RK, Leavitt BR, Hayden MR. Phenotypic abnormalities in the YAC128 mouse model of Huntington disease are penetrant on multiple genetic backgrounds and modulated by strain. Neurobiol Dis. 2007;26:189–200. doi: 10.1016/j.nbd.2006.12.010. [DOI] [PubMed] [Google Scholar]
- 28.von Hörsten S, Schmitt I, Nguyen HP, Holzmann C, Schmidt T, Walther T, Bader M, Pabst R, Kobbe P, Krotova J, Stiller D, Kask A, Vaarmann A, Rathke-Hartlieb S, Schulz JB, Grasshoff U, Bauer I, Vieira-Saecker AM, Paul M, Jones L, Lindenberg KS, Landwehrmeyer B, Bauer A, Li XJ, Riess O. Transgenic rat model of Huntington’s disease. Hum Mol Genet. 2003;12:617–24. doi: 10.1093/hmg/ddg075. [DOI] [PubMed] [Google Scholar]
- 29.Walker FO. Huntington’s disease. Lancet. 2007;369:218–28. doi: 10.1016/S0140-6736(07)60111-1. [DOI] [PubMed] [Google Scholar]
- 30.Wu J, Zou H, Strong JA, Yu J, Zhou X, Xie Q, Zhao G, Jin M, Yu L. Bimodal effects of MK-801 on locomotion and stereotypy in C57BL/6 mice. Psychopharmacology (Berl) 2005;177:256–263. doi: 10.1007/s00213-004-1944-1. [DOI] [PubMed] [Google Scholar]
- 31.Zumwalt AC, Hamrick M, Schmitt D. Force plate for measuring the ground reaction forces in small animal locomotion. J Biomech. 2006;39:2877–2881. doi: 10.1016/j.jbiomech.2005.10.006. [DOI] [PubMed] [Google Scholar]