

Abstract
The pathway that underlies exacerbation of migraine headache by light has not been elucidated in the human brain but has recently been reported in a rodent model. We employ diffusion weighted imaging and probabilistic tractography to map connectivity of direct pathways from the optic nerve to the pulvinar implicated with whole‐body allodynia during migraine. Nine healthy subjects were recruited to the study and underwent scanning on a 3T magnet. We were able to define well‐known image‐forming (optic nerve ‐> lateral geniculate ‐> visual cortex) as well as a less known nonimage forming visual pathway from the optic chiasm to the pulvinar, and from the pulvinar to several associative cortical brain regions. Such pathway may allow photic signals to converge on a thalamic region we described recently to be selectively activated during migraine headache. Consistent with physiological and anatomical studies in rats, the data provide an anatomical substrate for exacerbation of migraine headache by light in the human. Hum Brain Mapp, 2012. © 2011 Wiley Periodicals, Inc.
Keywords: tractography, nonimage forming pathway, visual pathway, thalamus, central sensitization, migraine, pain
INTRODUCTION
Photophobia is described by patients suffering from headaches of intracranial origin such as migraine, meningitis, and subdural hemorrhage. The type of photophobia, defined as exacerbation of headache by light, seems to involve direct retinal projections to a posterior region of the thalamus containing trigeminovascular neurons [Noseda et al.,2010]. In the human, these thalamic regions include the pulvinar and the centromedian nuclei, areas that receive inputs from dura‐sensitive spinal trigeminal nucleus neurons and believed to play a role in whole‐body allodyia during migraine [Burstein et al.,2010].
The projections of retinal ganglion cells to the posterior thalamic nuclei in the rat have led us to determine whether such connections exist in humans. The aim of the study was to differentiate classic visual from nonvisual pathways in humans using diffusion weighted imaging (DWI) and probabilistic tensor‐based tractography. The definition of a nonvisual forming pathway from the optic nerve to the posterior thalamus (pulvinar) in humans would correlate with the pathway defined in rats (see previous) and provide a basis for light induced pain in migraine. Probabilistic tensor‐based tractography is a well‐established technique to map anatomical pathways, [Basser and Pierpaoli,1996; Behrens et al.,2003a,b;2007] and we used it to map visual and direct optic nerve to thalamic regions pathways originating in the optic chiasm. Specifically, we evaluated specific inputs to the thalamus (pulvinar and centromedial nucleus) that were independent of the classic optic nerve ‐> lateral geniculate ‐> visual cortex connectivity. We also evaluated pulvinar‐cortical connectivity to a number of regions that may be affected by migraine, including the pulvinar‐olfactory cortex, pulvinar‐motor cortex and pulvinar‐visual cortex. The results of these studies support results that have been found in nonhuman models [Trojanowski and Jacobson,1976] and provide a basis to evaluate specific brain abnormalities that may correlate with altered structure and function in these regions in future studies.
MATERIAL AND METHODS
Subjects
A total of nine healthy subjects (3 females, 6 males; 31.1 ± 12.5 years old) with no history of migraine or any chronic headache were recruited for this study. All subjects gave informed consent prior to the scanning session. This study was approved by the McLean Hospital Institutional Review Board.
Data Acquisition
Imaging was carried out on a 3T Trio MR scanner (Siemens, Erlangen, Germany) using an eight‐channel phased array head coil. For DWI, a single shot‐twice refocused echo planar imaging (EPI) pulse sequence was used. The imaging parameters were as following: TR = 7900 msec, TE = 92 msec, 5/8 partial Fourier, three‐fold SENSE acceleration, Resolution = 1.75 × 1.75 × 2.5 mm3, and total of 50 axial slices to cover the entire cortex and cerebellum. A single nondiffusion weighted (b = 0 sec/mm2) volume was collected, while 72 distinct diffusion‐weighted volumes were collected at b = 1000 sec/mm2 (acquisition time ∼10 mins). Also T 1‐weighted structural images were acquired using a 3D magnetization‐prepared rapid gradient echo (MPRAGE) with the following imaging parameters: TR = 2100 msec, TE = 2.74 msec, TI = 1100 msec, FA = 12°, Resolution = 1 × 1 × 1 mm3, and 128 sagittal slices [Mugler and Brookeman,1990].
ROI Mask Definition
To define the masks that were used in the fiber tracking more precisely, the masks were created from the automatic segmentation of the cortical and subcortical structures of the brain using the volumetric T 1‐weighted MPRAGE images for each subject individually. Cortical parcellation and subcortical segmentation was performed using Freesurfer (http://surfer.nmr.mgh.harvard.edu/). The approach has the major advantage that each mask is defined according to the specific anatomical characteristics of each subject, which alleviates the problem of errors due to imperfect registration when a seed is defined in the standard space and then transformed to each subject's anatomical space.
Masks for Tracking Visual and Nonimage‐Forming Pathways
For each subject the following ROIs/masks were defined (Fig. 2): (1) Optic chiasm mask: which was created for each subject in its anatomical space using Freesurfer. The mask included the optic chiasm and some portion of the optic tract beyond the chiasm; (2) Thalamus mask: which was defined for each subject individually using the Freesurfer automatic segmentation tools; (3) Pulvinar mask: which was defined for each subject in the anatomical space by combining the following information: subcortical segmentation of the Thalamus using Freesurfer, the Talairach‐atlas‐derived pulvinar nucleus mask in the MNI space that was then nonlinearly registered to each subject's anatomical space, and also a digital atlas of the human brain, BrainNavigator (http://www.thehumanbrain.net/navigator, version 2.06); (4) Thalamus minus pulvinar mask which was easily created by subtracting the pulvinar from the thalamus. This mask was used in the validation step; (5) Primary visual cortex (V1) mask: The V1 mask for each subject was defined by registration of the subjects' cortices to a common spherical atlas on which the V1 area was defined (provided by Freesurfer), and the cortically defined masks where then transformed to volumetric masks in 2D; (6) LGN mask: The LGN mask was defined using Juelich Histological atlas. A probability of P > 5% was chosen to define the location of the LGN. Next, a nonlinear transformation was used to transform this map from the MNI space to each subject's anatomical space. For more accurate results the registration was initiated with the affine transform coefficients for this transformation.
Figure 2.
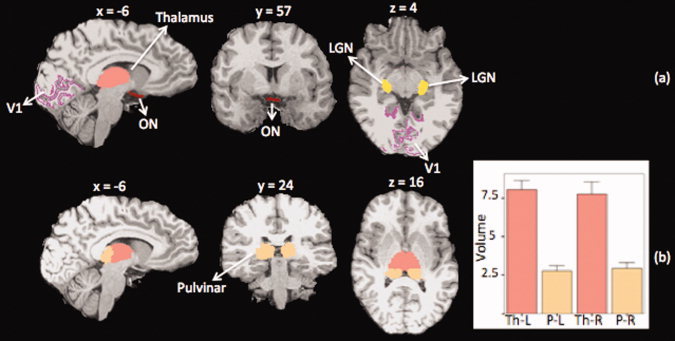
Masks for tracking visual and nonimage forming pathways. (a) For each subject the following masks were defined to be used in tracking the visual or the nonimage forming pathway: ON: optic nerve mask, V1: Primary visual cortex, LGN: Lateral geniculate nucleus, pulvinar and thalamus. ON mask was used as the seeding mask and the rest of the masks were used as target or exclusion masks. (b) thalamus and pulvinar segmentation results in one subject along with the group average results of the left and right thalamic and pulvinar volumes (graph). The average pulvinar volume was found to be approximately one‐third that of the thalamus. Th: Thalamus, P: Pulvinar, L: Left, and R: Right (example: P‐L: Left Pulvinar)
Masks for Tracking Pulvinar‐Cortical Pathways
In order to track the pulvinar‐cortical pathways, in addition to the V1 mask, the following masks were used: (1) Primary motor cortex (M1) mask: which consisted of anterior and posterior Brodmann area 4 and was defined following the same procedure as the V1 mask as described earlier; (2) Olfactory mask, which was defined for individual subjects using the Freesurfer automatic segmentation tools similar to Thalamus mask. Finally a trigeminal nucleus (SpV) mask was created to assess the pulvinar‐brainstem connectivity. The SpV mask was created by initially segmenting the spinal trigeminal (STr), anterolateral (AL), trigeminal lemniscus (TL), and medial lemniscus (ML) tracts for each subject [Upadhyay et al.,2008]. Once the location of these specific brainstem pathways were identified, the spinal trigeminal nucleus, which is just medial to the tracts was defined using an online brainstem atlas (https://www.msu.edu/~brains/brains/human/brainstem)
Tractography Analysis
Diffusion analysis was carried out using FMRIB Software Library (FSL) (http://www.fmrib.ax.ac.uk/fsl), version 4.1.3. Diffusion MR tractography in FSL is performed by modeling the distributions of fiber orientations or principal diffusion direction within each voxel, by using a Markov chain Monte Carlo sampling method [Behrens et al.,2007]. This model is then used to describe the measured diffusion weighted signal in each voxel, from which the probability density functions (PDFs) of each voxel for the model parameters are derived.
The prestatistical processing for each subject consisted of skull stripping, eddy current distortion correction and head motion correction [Jenkinson and Smith, 2001; Jenkinson et al., 2002]. For each individual subject, the DWI dataset was initially corrected for eddy current distortion and head motion. For both eddy current distortion and head motion corrections, an automated affine registration algorithm was employed using FMRIB's Linear Image Registration Tool (FLIRT, http://www.fmrib.ox.ac.uk/fsl/flirt) in which the skull‐stripped nondiffusion weighted volume was used as the reference volume [Jenkinson and Smith, 2001, Jenkinson et al., 2002, Smith, 2002]. A diffusion tensor for each voxel was calculated using a least squares fit of the tensor model to the diffusion data. From the diffusion tensors, the eigenvalues of each tensor, which represent the magnitude of the three main diffusion directions, and fractional anisotropy (FA) values, were calculated for each voxel. FA maps were created for each subject. To minimize the confounds such as partial volume effects present near gray matter‐white matter or ventricle‐white matter borders, a minimum FA threshold of 0.2 was used to threshold the data.
Diffusion modeling and probabilistic tractography were carried out using the FMRIB Diffusion Toolbox (http://www.fmrib.ox.ac.uk/fsl/fdt), which allows estimating the most probable pathways from a seed mask to anywhere in the brain or a particular defined location (waypoint mask) using a Bayesian estimation technique.
Tracking the Image‐forming Visual Pathways
The human visual system consists of the eye (especially the retina), optic nerve, optic chiasm, lateral geniculate nucleus (LGN), superior colliculus, optic radiation, visual cortex (V1) and visual association cortex (V2). The visual system is schematically depicted in Figure 1. In order to test the accuracy of the defined seeding masks and the quality of the diffusion weighted images for tracking the desired pathways, we aimed to first track the known visual pathway. In Figure 1, three known components of the visual pathway are also depicted schematically. These components include: optic nerve to LGN pathway which connects the optic nerve to the LGN, optic radiation (LGN to V1) which connects the LGN to the visual cortex (V1) and finally LGN‐Colliculi pathway which connects the LGN to the superior colliculi. Fiber tracking was initiated from all voxels within the optic chiasm seed mask to generate 25,000 streamline samples, with a step length of 0.5 mm, maximum number of steps of 2,000 and a curvature threshold of 0.2. Tracking was constrained by the fractional anisotropy that was measured in each pixel. Tracking was performed in two steps: first, the optic chiasm mask was used as the seeding mask and the LGN as the waypoint mask, and the first portion of the pathway was reconstructed. In the second step the LGN mask was used as a seeding mask and the V1 mask as the waypoint mask in order to track the optic radiation.
Figure 1.
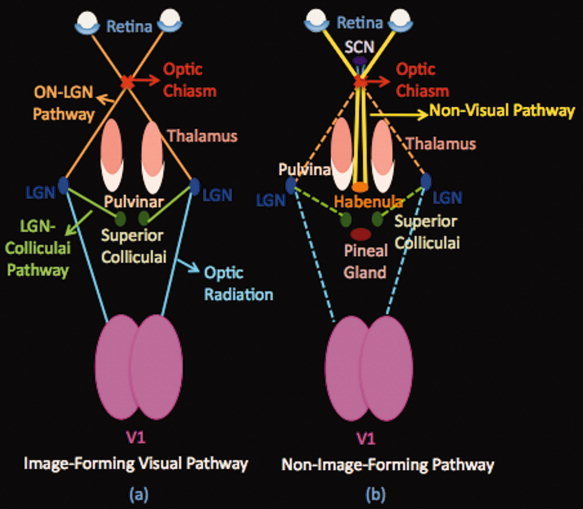
Schematic Pathways. (a) Image‐forming visual pathway. This system includes the eye, optic nerve, optic chiasm, lateral geniculate body (LGN), optic radiation, and visual cortex (V1). The pathway starts from the retina of both eyes. The optic nerves of both eyes travel through the optic chiasm to the lateral geniculate nucleus (LGN) of the thalamus (optic tract). From the LGN, a few fibers pass on to the superior colliculus and the rest, optic radiations, continue their way to the occipital lobe terminating in the visual cortex.(b) Nonimage forming Pathway. A specialized pathway involved in nonimage forming functions (entrainment of the biological clock, adaptation of the pupil size to light). This pathway starts from the retina of both eyes as well. The optic nerve fibers project via the retinohypothalamic tract to the suprachiasmatic nucleus (SCN) of the hypothalamus and then project to the habenula and the pineal gland (see text). SCN: Supra‐Chiasmatic Nucleus, LGN: Lateral Geniculate Nucleus.
Tracking the Non–image forming Visual Pathways
Non–image forming system in humans is a specialized system that originates from intrinsically photosensitive ganglion cells (ipRCGs) and is involved in the control of circadian rhythms and sleep, Figure 1. Some pathways send information via the retinohypothalamic tract to structures including the habenula [Qu et al.,1996], pineal [Falcon et al.,2009] and suprachiasmatic nucleus [Mai et al.,1981]. The pathway has also more recently been shown to have projections to the posterior thalamus (pulvinar) [Nakagawa and Tanaka,1984; Burstein et al.,2010]. Based on this latter finding, in order to track the non–image forming pathway, first the optic chiasm mask was defined as the seed mask and the pulvinar as the waypoint mask. Fiber tracking was initiated from all voxels within the optic chiasm seed mask to generate 25,000 streamline samples, with a step length of 0.5 mm, maximum number of steps of 2,000 and a curvature threshold of 0.2. Tracking was constrained by the fractional anisotropy that was measured in each pixel. Then, to classify and also validate different components of the tracked pathways from optic chiasm to the pulvinar, LGN mask and V1 mask were used as exclusion masks separately to determine if there is a direct pathway from the optic chiasm to the pulvinar nucleus that does not go through the LGN or project to the visual cortex. Also a second mask was created for determining the specificity of our results for the nonvisual pathway that consisted of thalamus minus pulvinar. For this analysis pulvinar and LGN were used as exclusion masks to determine the specificity of the tracked pathway to see if the tracked pathway goes exclusively to the pulvinar or to the other nuclei of the thalamus as well.
Pulvinar‐Cortical Pathways
In the next level, the connectivity of the pulvinar nucleus to the M1 cortical area, primary visual cortex and the olfactory cortex were assessed. The tracking was performed from the pulvinar mask to each of these targets separately for each subject. Fiber tracking was initiated from all voxels within the pulvinar seed mask to generate 5,000 streamline samples, with a step length of 0.5 mm, maximum number of steps as 2,000 and a curvature threshold of 0.2. Tracking was constrained by the fractional anisotropy that was measured in each pixel. The probabilistic tractography results were then thresholded equivalently in all subjects based on the total streamlines sent out from the seed mask in each subject: In each subject, we thresholded each of the probablistic tracts to include only those voxels that received at least 5 × 10⁻⁶ percent of the total streamlines sent out from the ROI masks used to trace that tract (5 × 10−6 times 25,000 times the number of voxels in the mask) [Rilling et al.,2008]. The subjects' thresholded pathways were then normalized to the total number of estimated pathways in each subject so that values are comparable across subjects.
To determine the common/average pathway among all of the subjects in this analysis, the following procedure was employed: a nonlinear registration was performed in order to coregister or align all FA images from all subjects to a predefined FA template image. The FSL‐based FA template or target image was derived from an averaged dataset of 58 FA maps from healthy male and female subjects. The FA template was also in the standard 1 × 1 × 1 mm3 MNI152 space. Using the tract‐based spatial statistics (TBSS) tool (http://www.fmrib.ox.ac.uk/fsl/TBSS), the calculated nonlinear transformation was applied to the estimated pathways for each individual subject to coregister all of the subjects to the standard 1 × 1 × 1 mm3 MNI152 space and perform group level analysis. These maps were then binarized. The thresholded, normalized and nonlinearly warped and binarized maps were then summed across the subjects to produce a group average probability map.
A second set of analysis was performed with the aim of further assessing the connectivity of the pulvinar to the cortical ROIs that were mentioned. The probability maps were calculated for each subject and similar to the previous analysis. Moreover, the pulvinar voxels were classified according to the probability of connection to a corresponding cortical ROI. These probability maps were then thresholded and averaged across subjects.
Brain Stem‐Pulvinar Pathways
Given that nociceptive inputs from the trigeminovascular system to the pulvinar have been described [Burstein et al.,2010] we wished to assess connectivity between regions of the brainstem that included the trigeminal nucleus (the region that peripheral trigeminal nerve fibers synapse with second order fibers). To assess the connectivity of the pulvinar nucleus to the SpV nucleus in the brain stem, the pulvinar mask was used as the seed mask and the SpV mask (based on our earlier work; see Upadhyay et al.,2008), as the waypoint mask. Fiber tracking was performed following the same procedure that was used for tracking the pulvinar‐cortical pathways.
RESULTS
Segmentation
The thalamus and pulvinar segmentation results for one subject in three views are presented in Figure 2b. The group average results of the thalamic and pulvinar volumes are also presented. The average volume of the pulvinar was found to be approximately one‐third that of the thalamus, which is consistent with figures reported in the literature [Sherman and Guillery,2002; Sherman,2007]. There were no significant differences in the volumes of the thalamus or pulvinar in both hemispheres as determined by univariate analysis of variance controlling for the effect of age and cranium size (estimated using Freesurfer) of the subjects.
Image‐forming Visual Pathway
The visual pathways connecting the optic chiasm to the LGN and projecting from LGN to the primary visual cortex and the colliculi were found consistently in both hemispheres bilaterally in all subjects. The reconstructed pathways are shown for one subject in Figure 3a.The three distinct components of the visual pathways are labeled within this figure. To obtain the results seen in Figure 3a, the tracking was done in two steps: first ON‐LGN pathway and LGN‐Colliculi pathways were reconstructed by using the optic chiasm mask as the seeding mask and the LGN as the target. The LGN mask was next defined as the seed and V1 as the target for reconstructing the optic radiation. In Figure 3b, the visual pathway of another subject is shown in axial, sagittal and coronal views with ON‐LGN, LGN‐Colliculi and LGN‐V1 pathway components.
Figure 3.
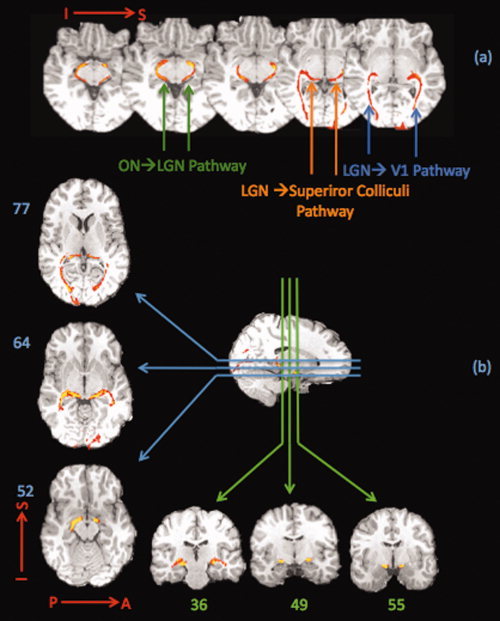
Image forming visual pathway. The tracking results for the visual system are shown. (a) The pathways connecting the optic nerve to the LGN, optic radiation to the primary visual cortex and those projecting from LGN to the superior colliculi are shown in a single subject. (b) Visual pathway is shown in another subject in axial, sagittal and coronal views. The course of the visual pathway can be followed in these slices from where the optic tract connects the optic nerve to the LGN and then travels to the superior colliculus or the LGN, and next continues to the occipital lobe where it terminates in the visual cortex. The results are consistent with the known visual pathway system.
Nonimage‐forming Visual Pathway
The results for tracking the non–image forming visual pathway are presented in Figure 4a,b. The pathway in Figure 4a is a pathway connecting optic chiasm to the pulvinar where any pathway from the optic chiasm to the pulvinar that passes through the LGN has been excluded. These exclusions therefore qualify the shown pathway as nonvisual.
Figure 4.

Nonimage forming visual pathway. (a) A direct pathway that connects the optic nerve to the thalamus. This pathway reaches the posterior thalamic nucleus that includes the pulvinar nucleus. For this analysis, optic chiasm was used as the seeding mask, pulvinar as the target and LGN as an exclusion mask to exclude any visual pathway that goes through the LGN. The pathway shown in this figure is thus nonvisual. Also seen in this figure is the optic chiasm‐hypothalamic connectivity, which presumably represents the suprachiasmatic nucleus projections. (b) (I) Delineation of the non–image forming and visual pathways in an axial slice. The visual and non–image forming pathways are delineated as follows: (i) the LGN‐Colliculi pathway, ON‐Pulvinar pathway and optic radiation are all shown. (ii) Optic‐radiation is excluded by using the V1 mask as an exclusion mask. (iii) The optic radiation and the LGN‐Colliculi pathway are excluded by using the LGN mask and V1 mask as exclusion masks. The green is the LGN‐Colliculi pathway, the blue is the optic radiation and the red is the pathway that connects ON and pulvinar directly. (II) Specificity analysis results. Pathways were tracked from the optic chiasm with pulvinar as the waypoint mask (red‐yellow) or thalamus minus pulvinar as the waypoint mask and pulvinar and LGN as exclusion masks. No pathway was tracked from optic chiasm to any other nuclei of the thalamus. (III) Diffusion tensor color map of an independent DTI study (Wakana et al.,2004 and http://cmrm.med.jhmi.edu/). Arrows refer to fibers passing through the same area as the nonvisual pathway. Red, green, and blue represent fibers running along right‐left, anterior‐posterior, and superior‐inferior axes, respectively.
In Figure 4b results of our validation approach for determining the nonvisual nature of the detected pathway (4b‐i) and its specificity (4b‐ii) are reported. In Figure 4b‐I a single axial slice in one subject is shown and the delineation of the pathways are color‐coded. Three pathways are shown in Figure 4b‐I: The green is the LGN‐Colliculi Pathway, the blue is the optic radiation and the red is the pathway that connects ON and Pulvinar directly, which was also shown in Figure 4a. Optic radiation, ON‐Pulvinar pathways and LGN‐Colliculi are all shown in one slice. By excluding the LGN‐V1 projections (optic radiation) the ON‐Pulvinar pathway and LGN‐Colliculi pathway remain (ii).By excluding the LGN‐Colliculi pathway (as described earlier) the sole pathway that remains is the ON‐Pulvinar (iii), which directly connects the ON and Pulvinar and is shown in red‐yellow in both figures.
Figure 4b‐II shows the specificity analysis results. Two tracked pathways are shown in this figure. For both pathways optic chiasm was used as the seed mask. Red‐yellow is the pathway tracked from optic chiasm to the pulvinar excluding the LGN. Blue represents the pathway tracked from the optic chiasm to the thalamus minus pulvinar where pulvinar and LGN were used as exclusion masks. As it can be seen in the results when pulvinar and LGN are excluded neither any pathway reaches the pulvinar nor there is any pathway reaching any other nuclei of the thalamus. Diffusion tensor color map of an independent DTI study (Wakana et al,2004 and http://cmrm.med.jhmi.edu/) is shown in 4b‐III.It shows white matter fibers passing through the same area as the nonvisual pathway that was tracked in our study. On color map, red, green, and blue represent fibers running along right‐left, anterior‐posterior, and superior‐inferior axes, respectively.
Brainstem—Pulvinar Connections
The results of tracking the pulvinar‐brainstem connecting pathway are shown in Figure 5. The pathways were found in both hemispheres bilaterally in all subjects. The data are shown both in a set of consecutive coronal slices and also sagittal slices at the level of the pathway on the left and right side. For this analysis the pulvinar was used as seeding mask and the SpV as the target mask.
Figure 5.

Pulvinar to brainstem pathway. Pulvinar‐brainstem connecting pathway. This pathway connects the trigeminal nuclei to the pulvinar. This pathway may send nociceptive information originating in trigeminal afferents during migraine via the trigeminal nuclei to the pulvinar.
Pulvinar—Cortical Connections
After the direct connection between the optic nerve and the pulvinar was determined, the next step was to assess the connectivity of the pulvinar to the cortex. We focused on olfactory cortex, V1, and M1 areas. The ROIs that were used for this analysis are shown in Figure 6a. The group probability maps of reconstructed pathways connecting the pulvinar to the other cortical areas are shown in Figure 6b–c. These results are based on tractography in 9 subjects. The average tract map is thresholded to show the tracts that are present in at least 50% of the subjects. Yellow represents higher probability that a pathway is present in more subjects, and red depicts the lower probability (minimum 50%). The pathways connecting the pulvinar to the M1 cortical area are shown in Figure 6b. The probabilistic tractography method enabled a segmentation of the Superior Thalamic Radiation/Superior Corona Radiata. Pathways connecting the pulvinar to the olfactory cortex are shown in Figures 6c, where the Anterior Thalamic Radiation/Anterior Corona Radiata was segmented.
Figure 6.

Cortical‐Pulvinar Pathways. (a) Cortical masks were defined for each subject individually including: Primary motor cortex (M1), olfactory and V1 mask (shown in figure 2a). In Figures 4b–c, group probability maps of reconstructed pathways connecting the pulvinar to (b) M1, and (c) Olfactory cortex are presented. These results are based on tractography in nine subjects. The average tract map is thresholded to show the tracts that are present in at least 50% of the subjects. Yellow represents higher probability of a pathway's presence in more subjects and red is for lower probability (minimum 50%).
In addition connectivity of pulvinar with some other cortical areas including the primary and secondary auditory cortex, gustatory cortex, and insular cortex were assessed in this study. However no significant connectivity was found between the pulvinar and these areas after thresholding.
DISCUSSION
In this study we identified optic nerve connections to the pulvinar in humans using a probabilistic tractography approach. We propose that this pathway is suited to carry photic signals to a thalamic area that is activated during migraine [Burstein et al.,2010] and thus, may provide the anatomical substrate for migraine‐type photophobia. In agreement with this notion, we described recently a novel pathway through which photic signals that travel along the optic nerve enhance the firing rate of trigeminovascular neurons in the lateral posterior and posterior thalamic nuclei in the rat and proposed that this pathway mediates the exacerbation of headache by light during migraine [Noseda et al.,2010]. In a related study we have reported imaging data of increased activation in the pulvinar in patients with central sensitization (during their migraine) compared with their interictal period [Burstein et al.,2010]. This data correlated with central sensitization of posterior thalamic neurons in a rat model of migraine. Taken together, these data implicate the pulvinar as a central site for modulating sensory inputs.
The Pulvinar
The pulvinar is usually grouped as one of the lateral thalamic nuclei, which forms a cushion like prominence overlying the geniculate bodies. Cytoarchitecture and dendroarchitecture of the pulvinar is similar to that of Lateral Posterior (LP) nucleus [Percheron,2004]. Thus LP is frequently linked to pulvinar as “pulvinar‐LP‐Complex.” Lower mammals such as rats do not have a prominent pulvinar or LP. The pulvinar is presumed to have evolved from the LP of lower mammals [Percheron,2004]. In primates including humans, pulvinar comprises approximately 30–40% of the thalamus [Danos et al.,2003; Sherman,2007]. The pulvinar complex have been divided into oral (somatosensory), superior and inferior (visual), and medial (visual, multisensory) [Grieve et al.,2000].Various studies have found extensive projections of the pulvinar to several cortical regions including the cingulate gyrus, visual association areas, somatosensory, posterior parietal and prefrontal cortex [Burstein et al.,2010; Glendenning et al.,1975; Grieve et al.,2000; Raczkowski and Diamond,1980]. There are also reports of pulvinar projections to subcortical regions including superior colliculus and pretectal area [Tekian and Afifi,1981].Finally, retino‐pulvinar pathways have been described in the cat [Fedorova,1983], tree shrew [Somogyi et al.,1981], in the rat [Burstein et al.,2010] and in primates [O'Brien et al.,2001].No such pathways have been reported in humans.
Visual Image and Nonimage‐Forming Pathways
Classic visual pathways include projections from the retina to the LGN and then to the visual cortices. Non–image forming pathways include those to the habenula [Qu et al.,1996], pineal [Falcon et al.,2009] and the suprachiasmatic nucleus [Mai et al.,1981] and have projections to the posterior thalamus (pulvinar) [Burstein et al.,2010; Nakagawa and Tanaka,1984]. There are also projections to the intergeniculate leaflet(which plays a role in pineal melatonin suppression) and the olivary pretectal nucleus, which plays a role in pupillary light response through its connections to Edinger‐Westfal nucleus and the ciliary ganglion [Hattar et al.,2002; Panda et al.,2002]. In order to demonstrate the known image‐forming visual pathway using DWI and tractography, we presented data that is consistent with prior studies on visual pathway [Iwasawa et al.,1997; Sherbondy et al.,2008; Staempfli et al.,2007; Trip et al.,2006]. In our study both the visual and non–image forming pathways were tracked reproducibly in all subjects and the reconstructed fiber pathways were in agreement with the known visual anatomy. Our main finding was a direct non–image forming tract from the optic nerve to the pulvinar in the posterior thalamus. In addition, the specificity of our analysis results shows optic chiasm hypothalamic (presumably suprachiasmatic nucleus) projections (Fig. 4a).Our analysis also indicates connections from trigeminal nuclei to the pulvinar, providing evidence for this pathway in humans as a means by which nociceptive signals that arise in the meninges during migraine may reach the pulvinar. In addition, connections between the pulvinar and various cortical areas, including the motor cortex (M1), visual cortex (V1) and olfactory cortex were indicated. These projections may contribute to other manifestations of the migraine state (e.g., osmophobia). Each of these pathways (optic nerve‐pulvinar; trigemino‐pulvinar and pulvinar‐cortical) is discussed below. Our mapping of a non–image forming visual pathway that connects the optic nerve to the pulvinar, to the best of our knowledge, is the first systematic approach to study a non–image forming visual pathway with regards to its connections to pain processing areas in the human brain using a diffusion tensor‐based tractography approach.
Optic Nerve‐Thalamic (Pulvinar) Pathway
Diffusion tensor imaging can quantify the degree and direction of water diffusion anisotropy in white matter fibers noninvasively in vivo. Water diffuses predominantly along the long axis of the white matter fibers. Therefore, axonal connectivity of different brain areas can then be derived from tracking the properties of the local diffusion profiles on a voxel‐by‐voxel basis. In prior MRI studies of visual pathways the focus has been on tractography of the visual pathways [Iwasawa et al.,1997; Sherbondy et al.,2008; Staempfli et al.,2007; Trip et al.,2006].
In some of these studies, an optic nerve‐thalamic pathway is shown in the included figures, but this pathway is not directly evaluated in their reports. While these studies lend support to our findings, the focus has been on image‐forming visual pathways rather than the non–image forming pathways. Therefore, none of the groups have focused on tracking the non–image forming visual pathway in terms of its terminal fields or clear delineation of this pathway from the visual pathway. We, on the other hand, focused on the non–image forming visual pathway where it was clearly defined and delineated from the visual pathway by creating various target masks as described in the methods section to label different components of the pathways originating from the optic chiasm.
Non–image forming pathways originate in intrinsically photosensitive Retinal Ganglion Cells (ipRGC) and project via the optic nerve to the suprachiasmatic nucleus (SCN), intergeniculate leaflet (IGL), habenula, pineal and olivary pretectal nucleus (OPT).In the rat, most retinal projections to the posterior and lateral posterior thalamic nuclei that converge on dura‐sensitive neurons originate in ipRGCs [Burstein et al.,2010]. Thus, our results parallel data reported in rats. As noted in the methods, by defining a seed region in the optic chiasm and a specific target region in the pulvinar in addition to excluding specific known visual pathways, the DWI measure of the tract would seem specific for an optic nerve‐ pulvinar projection in humans.
Trigeminal–Pulvinar Projection
Pain produced by migraine involves activation of meningheal nociceptors that project via the trigeminal nerve to the spinal trigeminal nucleus, and second order trigeminovascular neurons that project to more rostral brain regions including the thalamus. Neurons in the human pulvinar may become sensitized with the progression of an attack [Burstein et al.,2010].Direct trigeminovascular projections to posterior thalamic nuclei including PO and LP have been reported in rats [Burstein et al.,1998;2010]. We believe that this pathway conveys sensory signals from the spinal trigeminal nucleus to the pulvinar since there are no known projections from the pulvinar to the spinal trigeminal nucleus. While, brainstem‐pulvinar connections, including trigemino nuclear complex (TNC) ‐> pulvinar [Burstein et al.,1998] and periaqueductal gray ‐> pulvinar [Spreafico et al.,1980] have been described our analysis only included seeding from the TNC based on our prior human studies [Borsook et al.,2004; DaSilva et al.,2002; Upadhyay et al.,2008].
Pulvinar‐Cortical Projections
Reciprocal Pulvinar‐cortical connections have been described in a number of species including nonhuman primates [Raczkowski and Diamond,1980; Shipp,2001].As such the pulvinar is an associative nucleus [Shipp,2003] that has connections with a number of cortical regions. In the rat study, projections from neurons that were both light and dural sensitive projected to a number of cortical regions including motor and olfactory areas [Noseda et al.,2010].Tractography studies of pulvinar connections have been reported in humans [Leh et al.,2008] with a number of regions including primary visual areas (Brodmann area 17), secondary visual areas (Brodmann areas 18 and 19), visual inferotemporal areas (Brodmann area 20), posterior parietal association areas (Brodmann area 7), and frontal eye fields and prefrontal areas. The authors did not comment on connectivity with specific regions; we focus instead on the motor cortex, the olfactory cortex and the visual cortex. These regions could be easily identified using standard brain atlases and reports in the literature [Mai et al.,2008]. The data shown in Figure 6b–c show this connectivity in our subjects. The “direction” of connectivity cannot be ascertained using diffusion tensor‐based tractography and it does not permit differentiation of thalamocortical from reciprocal corticothalamic connections. Moreover reciprocal connections have been reported between the pulvinar and for these regions [Grieve et al.,2000; Rouiller et al.,1998]. The specific function of connectivity for each of these regions as related to pain processing in migraine may be different. For example, the olfactory cortex may be involved in either precipitating a migraine from strong olfactory stimulants such as perfumes [Kelman,2007] in osmophobia. In addition, even during the interictal period changes in olfactory acuity [Amery et al.,1988] have been evaluated using PET scanning [Demarquay et al.,2008]. Animal studies show that thalamic projections to the orbitofrontal cortex arise from midline and intralaminar nuclei, from the anteromedial nucleus, the medial dorsal nucleus, and the pulvinar nucleus [Morecraft et al.,1992]. Motor cortical involvement in migraine may be related to hyperexcitability of this region in the interictal state of migraine patients [Antal et al.,2008; Curra et al.,2007; Siniatchkin et al.,2009].During migraine the hyperexcitable state in this cortical region is reversed to an inhibitory state that may contribute to motor abnormalities such as slowed speech or hand clumsiness [Brighina et al.,2009; Ebinger, 2006]. Animal studies also confirm pulvinar projections to the M1 area [Huffman and Krubitzer,2001; Kultas‐Ilinsky et al.,2003]. Both anterograde and retrograde labeling in medial pulvinar nucleus of the rhesus monkey has also been reported following injections of biotinylated dextran amine (BDA) in different locations of the primary motor cortex [Kultas‐Ilinsky et al.,2003].
Caveats
There are a couple of limitations associated with diffusion tensor‐based tractography. The most important limitation stems from the partial volume averaging of complex fiber structures (such as sharp curves) or fiber combinations/interaction (such as crossing fibers, merging fibers) into single voxels where the principal eigenvector of a voxel (which describes the principal diffusion direction in that voxel) may not correspond to the main fiber direction. Also because of the limitations in feasible resolutions with MR only major fiber tracts can be resolved since the voxel size of the MR data is typically many orders of magnitude larger than the size of a single axon (2–4 mm vs. a few microns). As noted previously, diffusion tensor‐based tractography does not have the ability to distinguish between afferent and efferent pathways. Therefore the directionality of the observed connections cannot be inferred from our results. For this reason, the results of our connectivity analyses needed to be validated against known anatomical directionality analyses in tracer studies of animal models. Other limitations relate to the differences in the quality of the diffusion data (which depends on issues such as scan quality or head motion) and anatomical variations among a group of subjects, which makes generating a group average for thinner fiber bundles especially difficult. Another aspect of this issue also relates to choosing the appropriate threshold for the tracked probabilistic pathways to distinguish between the real connections and spurious/artifactual connections. In this study we followed an approach [Rilling et al.,2008] for thresholding the pathways that takes into account the anatomical differences among subjects.
Our study parallels known visual pathways mapped in nonhuman primates and humans [Iwasawa et al.,1997; Sherbondy et al.,2008; Staempfli et al.,2007; Trip et al.,2006]. With respect to defining the retino‐pulvinar pathway our findings are in agreement with the results shown for these pathways using electrophysiology and tracing methods [Burstein et al.,2010]. However, we were not able to determine ipRGC inputs to the intergeniculate leaflet or to specifically separate the ON‐IGL projections from the ON‐LGN projections due to proximity of IGL and LGN, the size of IGL and our probabilistic approach in deriving the LGN masks in this study. However, the direct pathway that we find also connects to the posterior region of the thalamus. Given that this pathway projects to the SCN, pineal and habenula and ends in the posterior thalamus and since there is no known direct visual pathway in that direction, it suggests that this direct pathway is part of the ipRGC axon projections that project to the SCN and continue to the posterior thalamus. The pathway is also of the same nature and function as the ipRGC axon projections that were found in the rat study by Burstein et al. (2010).
Photophobia and Pulvinar Inputs
In migraine, photophobia results from light acting on an otherwise normal eye/visual system. In other forms of the photophobia there is an associated alteration in the cornea or other parts of the anterior eye, which may involve the trigeminal nerve, and activation of its nociceptors in conditions such as corneal lesions, dry eye or uveitis. There are projections from the eye (e.g., cornea) through the trigeminal ganglion that are well described in the rat [Marfurt and Del Toro,1987; Okamoto et al.,2009] and in the monkey [Marfurt and Echtenkamp,1988], and recently in single case human imaging study of photophobia related to corneal injury [Moulton et al.,2009]. Based on clinical and preclinical studies, in these nonmigraine conditions nocicieptor activation travels along trigeminal fibers to the brainstem. Subsequent changes in higher brain areas including the thalamus may take place as a secondary phenomenon. In addition, photophobia has been associated with chiasmal compression in patients [Kawasaki and Purvin,2002].This may result from pressure on the dura (dura mater and arachnoid mater) that sheaths the optic nerve/chiasm and is contiguous with the sclera of the eyeball [Hayreh,1984]. We are unaware of reports of nociceptor presence within the arterial supply of the optic nerve although the dura that surrounds the optic nerve is innervated by C fibers, yet the dura resembles the epineurium of normal peripheral nerves [Raspanti et al.,1992].If this is the case, information would travel via the supraorbital subdivision of the trigeminal nerve to reach the trigeminal nuclear complex. Photophobia has also been associated with blepharospasm and the pulvinar may also mediate the type of photophobia that is commonly associated with essential blepharospasm. In a study in which photophobia was not defined clearly (i.e., light‐induced ocular pain, abnormal sensitivity to light) and the thalamus was not parcellated, Emoto et al., (2009) observed activation in the posterior thalamus of patient diagnosed with blepharospasm. At this time it is unclear whether there is any overlap in these conditions.
CONCLUSION
In conclusion, we were able to define well‐known image‐forming pathway as well as a direct pathway from the optic nerve to the pulvinar, and from the pulvinar to several associative cortical brain regions. The importance of finding this direct pathway is that the direct pathway from optic nerve to the posterior thalamus shows what may be a possible mechanism for exacerbation of pain by light alone (photophobia) in migraine patients where there is no corneal/ocular damage (photoallodynia).
Acknowledgements
The aurhors thank Lauren Nutile's assistance in preparation of the manuscript.
REFERENCES
- Amery WK, Waelkens J, Vandenbergh V ( 1988): The sensorium of the migraineur. Ital J Neurol Sci 9: 539–545. [DOI] [PubMed] [Google Scholar]
- Antal A, Lang N, Boros K, Nitsche M, Siebner HR, Paulus W ( 2008): Homeostatic metaplasticity of the motor cortex is altered during headache‐free intervals in migraine with aura. Cereb Cortex 18: 2701–2705. [DOI] [PubMed] [Google Scholar]
- Basser PJ, Pierpaoli C ( 1996): Microstructural and physiological features of tissues elucidated by quantitative‐diffusion‐tensor MRI. J Magn Reson B 111: 209–219. [DOI] [PubMed] [Google Scholar]
- Behrens TE, Berg HJ, Jbabdi S, Rushworth MF, Woolrich MW ( 2007): Probabilistic diffusion tractography with multiple fibre orientations: What can we gain? Neuroimage 34: 144–155. [DOI] [PMC free article] [PubMed] [Google Scholar]
- Behrens TE, Woolrich MW, Jenkinson M, Johansen‐Berg H, Nunes RG, Clare S, Matthews PM, Brady JM, Smith SM ( 2003a): Characterization and propagation of uncertainty in diffusion‐weighted MR imaging. Magn Reson Med 50: 1077–1088. [DOI] [PubMed] [Google Scholar]
- Behrens TE, Johansen‐Berg H, Woolrich MW, Smith SM, Wheeler‐Kingshott CA, Boulby PA, Barker GJ, Sillery EL, Sheehan K, Ciccarelli O, Thompson AJ, Brady JM, Matthews PM ( 2003b): Non‐invasive mapping of connections between human thalamus and cortex using diffusion imaging. Nat Neurosci 6: 750–757. [DOI] [PubMed] [Google Scholar]
- Borsook D, Burstein R, Becerra L ( 2004): Functional imaging of the human trigeminal system: Opportunities for new insights into pain processing in health and disease. J Neurobiol 61: 107–125. [DOI] [PubMed] [Google Scholar]
- Brighina F, Palermo A, Panetta ML, Daniele O, Aloisio A, Cosentino G, Fierro B ( 2009): Reduced cerebellar inhibition in migraine with aura: A TMS study. Cerebellum 8: 260–266. [DOI] [PubMed] [Google Scholar]
- Burstein R, Yamamura H, Malick A, Strassman AM ( 1998): Chemical stimulation of the intracranial dura induces enhanced responses to facial stimulation in brain stem trigeminal neurons. J Neurophysiol 79: 964–982. [DOI] [PubMed] [Google Scholar]
- Burstein R, Jakubowski M, Garcia‐Nicas E, Kainz V, Bajwa Z, Hargreaves R, Becerra L, Borsook D ( 2010): Thalamic sensitization transforms localized pain into widespread allodynia. Ann Neurol 68: 81–91. [DOI] [PMC free article] [PubMed] [Google Scholar]
- Curra A, Pierelli F, Coppola G, Barbanti P, Buzzi MG, Galeotti F, Serrao M, Truini A, Casali C, Pauri F, Cruccu G ( 2007): Shortened cortical silent period in facial muscles of patients with migraine. Pain 132: 124–131. [DOI] [PubMed] [Google Scholar]
- Danos P, Baumann B, Kramer A, Bernstein HG, Stauch R, Krell D, Falkai P, Bogerts B ( 2003): Volumes of association thalamic nuclei in schizophrenia: A postmortem study. Schizophr Res 60: 141–155. [DOI] [PubMed] [Google Scholar]
- DaSilva AF, Becerra L, Makris N, Strassman AM, Gonzalez RG, Geatrakis N, Borsook D ( 2002): Somatotopic activation in the human trigeminal pain pathway. J Neurosci 22: 8183–8192. [DOI] [PMC free article] [PubMed] [Google Scholar]
- Demarquay G, Royet JP, Mick G, Ryvlin P ( 2008): Olfactory hypersensitivity in migraineurs: A H(2)(15)O‐PET study. Cephalalgia 28: 1069–1080. [DOI] [PubMed] [Google Scholar]
- Descoteaux M, Deriche R, Knosche TR, Anwander A ( 2009): Deterministic and probabilistic tractography based on complex fibre orientation distributions. IEEE Trans Med Imaging 28: 269–286. [DOI] [PubMed] [Google Scholar]
- Emoto H, Suzuki Y, Wakakura M, Horie C, Kiyosawa M, Mochizuki M, Kawasaki K, Oda K, Ishiwata K, Ishii K ( 2009): Photophobia in essential blepharospasm‐A positron emission tomographic study. Mov Disord. [DOI] [PubMed] [Google Scholar]
- Falcon J, Besseau L, Fuentes M, Sauzet S, Magnanou E, Boeuf G ( 2009): Structural and functional evolution of the pineal melatonin system in vertebrates. Ann N Y Acad Sci 1163: 101–111. [DOI] [PubMed] [Google Scholar]
- Fedorova KP ( 1983): [Retino‐pulvinar pathway of the cat brain]. Arkh Anat Gistol Embriol 85: 27–32. [PubMed] [Google Scholar]
- Glendenning KK, Hall JA, Diamond IT, Hall WC ( 1975): The pulvinar nucleus of Galago senegalensis . J Comp Neurol 161: 419–458. [DOI] [PubMed] [Google Scholar]
- Grieve KL, Acuna C, Cudeiro J ( 2000): The primate pulvinar nuclei: Vision and action. Trends Neurosci 23: 35–39. [DOI] [PubMed] [Google Scholar]
- Hattar S, Liao HW, Takao M, Berson DM, Yau KW ( 2002): Melanopsin‐containing retinal ganglion cells: Architecture, projections, and intrinsic photosensitivity. Science 295: 1065–1070. [DOI] [PMC free article] [PubMed] [Google Scholar]
- Hayreh SS ( 1984): The sheath of the optic nerve. Ophthalmologica 189: 54–63. [DOI] [PubMed] [Google Scholar]
- Huffman KJ, Krubitzer L ( 2001): Thalamo‐cortical connections of areas 3a and M1 in marmoset monkeys. J Comp Neurol 435: 291–310. [DOI] [PubMed] [Google Scholar]
- Iwasawa T, Matoba H, Ogi A, Kurihara H, Saito K, Yoshida T, Matsubara S, Nozaki A ( 1997): Diffusion‐weighted imaging of the human optic nerve: A new approach to evaluate optic neuritis in multiple sclerosis. Magn Reson Med 38: 484–491. [DOI] [PubMed] [Google Scholar]
- Kawasaki A, Purvin VA ( 2002): Photophobia as the presenting visual symptom of chiasmal compression. J Neuroophthalmol 22: 3–8. [DOI] [PubMed] [Google Scholar]
- Kelman L ( 2007): The triggers or precipitants of the acute migraine attack. Cephalalgia 27: 394–402. [DOI] [PubMed] [Google Scholar]
- Kultas‐Ilinsky K, Sivan‐Loukianova E, Ilinsky IA ( 2003): Reevaluation of the primary motor cortex connections with the thalamus in primates. J Comp Neurol 457: 133–158. [DOI] [PubMed] [Google Scholar]
- Leh SE, Chakravarty MM, Ptito A ( 2008): The connectivity of the human pulvinar: A diffusion tensor imaging tractography study. Int J Biomed Imaging 2008: 789539. [DOI] [PMC free article] [PubMed] [Google Scholar]
- Mai J, Paxinos G, Assheuer J ( 2008): Atlas of the Human Brain. Amsterdam: Elsevier/Academic Press. [Google Scholar]
- Mai JK, Bartholomaeus I, Jennissen JJ ( 1981): Evaluation of distribution of retinal afferents within the suprachiasmatic area (ASC): A quantitative approach. Folia Morphol (Praha) 29: 95–99. [PubMed] [Google Scholar]
- Marfurt CF, Del Toro DR ( 1987): Corneal sensory pathway in the rat: A horseradish peroxidase tracing study. J Comp Neurol 261: 450–459. [DOI] [PubMed] [Google Scholar]
- Marfurt CF, Echtenkamp SF ( 1988): Central projections and trigeminal ganglion location of corneal afferent neurons in the monkey, Macaca fascicularis . J Comp Neurol 272: 370–382. [DOI] [PubMed] [Google Scholar]
- Morecraft RJ, Geula C, Mesulam MM ( 1992): Cytoarchitecture and neural afferents of orbitofrontal cortex in the brain of the monkey. J Comp Neurol 323: 341–358. [DOI] [PubMed] [Google Scholar]
- Moulton EA, Becerra L, Borsook D ( 2009): An fMRI case report of photophobia: Activation of the trigeminal nociceptive pathway. Pain 145: 358–363. [DOI] [PMC free article] [PubMed] [Google Scholar]
- Mugler JP III, Brookeman JR ( 1990): Three‐dimensional magnetization‐prepared rapid gradient‐echo imaging (3D MP RAGE). Magn Reson Med 15: 152–157. [DOI] [PubMed] [Google Scholar]
- Nakagawa S, Tanaka S ( 1984): Retinal projections to the pulvinar nucleus of the macaque monkey: A re‐investigation using autoradiography. Exp Brain Res 57: 151–157. [DOI] [PubMed] [Google Scholar]
- Noseda R, Kainz V, Jakubowski M, Gooley JJ, Saper CB, Digre K, Burstein R ( 2010): A neural mechanism for exacerbation of headache by light. Nat Neurosci 13: 239–245. [DOI] [PMC free article] [PubMed] [Google Scholar]
- O'Brien BJ, Abel PL, Olavarria JF ( 2001): The retinal input to calbindin‐D28k‐defined subdivisions in macaque inferior pulvinar. Neurosci Lett 312: 145–148. [DOI] [PubMed] [Google Scholar]
- Okamoto K, Thompson R, Tashiro A, Chang Z, Bereiter DA ( 2009): Bright light produces Fos‐positive neurons in caudal trigeminal brainstem. Neuroscience 160: 858–864. [DOI] [PubMed] [Google Scholar]
- Panda S, Sato TK, Castrucci AM, Rollag MD, DeGrip WJ, Hogenesch JB, Provencio I, Kay SA ( 2002): Melanopsin (Opn4) requirement for normal light‐induced circadian phase shifting. Science 298: 2213–2216. [DOI] [PubMed] [Google Scholar]
- Percheron G ( 2004): Thalamus In: Paxinos G, Mai JK, editors. The Human Nervous System, San Diego: Elsevier Academic Press; pp 592–675. [Google Scholar]
- Qu T, Dong K, Sugioka K, Yamadori T ( 1996): Demonstration of direct input from the retina to the lateral habenular nucleus in the albino rat. Brain Res 709: 251–258. [DOI] [PubMed] [Google Scholar]
- Raczkowski D, Diamond IT ( 1980): Cortical connections of the pulvinar nucleus in Galago . J Comp Neurol 193: 1–40. [DOI] [PubMed] [Google Scholar]
- Raspanti M, Marchini M, Della Pasqua V, Strocchi R, Ruggeri A ( 1992): Ultrastructure of the extracellular matrix of bovine dura mater, optic nerve sheath and sclera. J Anat 181 ( Part 2): 181–187. [PMC free article] [PubMed] [Google Scholar]
- Rilling JK, Glasser MF, Preuss TM, Ma X, Zhao T, Hu X, Behrens TE ( 2008): The evolution of the arcuate fasciculus revealed with comparative DTI. Nat Neurosci 11: 426–428. [DOI] [PubMed] [Google Scholar]
- Rouiller EM, Tanne J, Moret V, Kermadi I, Boussaoud D, Welker E ( 1998): Dual morphology and topography of the corticothalamic terminals originating from the primary, supplementary motor, and dorsal premotor cortical areas in macaque monkeys. J Comp Neurol 396: 169–185. [DOI] [PubMed] [Google Scholar]
- Sherbondy AJ, Dougherty RF, Napel S, Wandell BA ( 2008): Identifying the human optic radiation using diffusion imaging and fiber tractography. J Vis 8: 12 11‐11. [DOI] [PMC free article] [PubMed] [Google Scholar]
- Sherman SM ( 2007): The thalamus is more than just a relay. Curr Opin Neurobiol 17: 417–422. [DOI] [PMC free article] [PubMed] [Google Scholar]
- Sherman SM, Guillery RW ( 2002): The role of the thalamus in the flow of information to the cortex. Philos Trans R Soc Lond B Biol Sci 357: 1695–1708. [DOI] [PMC free article] [PubMed] [Google Scholar]
- Shipp S ( 2001): Corticopulvinar connections of areas V5, V4, and V3 in the macaque monkey: A dual model of retinal and cortical topographies. J Comp Neurol 439: 469–490. [DOI] [PubMed] [Google Scholar]
- Shipp S ( 2003): The functional logic of cortico‐pulvinar connections. Philos Trans R Soc Lond B Biol Sci 358: 1605–1624. [DOI] [PMC free article] [PubMed] [Google Scholar]
- Siniatchkin M, Reich AL, Shepherd AJ, van Baalen A, Siebner HR, Stephani U ( 2009): Peri‐ictal changes of cortical excitability in children suffering from migraine without aura. Pain 147: 132–140. [DOI] [PubMed] [Google Scholar]
- Somogyi G, Hajdu F, Hassler R, Wagner A ( 1981): An experimental electron microscopical study of a direct retino‐pulvinar pathway in the tree shrew. Exp Brain Res 43: 447–450. [DOI] [PubMed] [Google Scholar]
- Spreafico R, Kirk C, Franceschetti S, Avanzini G ( 1980): Brain stem projections in the pulvinar‐lateralis posterior complex of the cat. Exp Brain Res 40: 209–220. [DOI] [PubMed] [Google Scholar]
- Staempfli P, Rienmueller A, Reischauer C, Valavanis A, Boesiger P, Kollias S ( 2007): Reconstruction of the human visual system based on DTI fiber tracking. J Magn Reson Imaging 26: 886–893. [DOI] [PubMed] [Google Scholar]
- Tekian A, Afifi AK ( 1981): Efferent connections of the pulvinar nucleus in the cat. J Anat 132: 249–265. [PMC free article] [PubMed] [Google Scholar]
- Trip SA, Wheeler‐Kingshott C, Jones SJ, Li WY, Barker GJ, Thompson AJ, Plant GT, Miller DH ( 2006): Optic nerve diffusion tensor imaging in optic neuritis. Neuroimage 30: 498–505. [DOI] [PubMed] [Google Scholar]
- Trojanowski JQ, Jacobson S ( 1976): Areal and laminar distribution of some pulvinar cortical efferents in rhesus monkey. J Comp Neurol 169: 371–392. [DOI] [PubMed] [Google Scholar]
- Upadhyay J, Knudsen J, Anderson J, Becerra L, Borsook D ( 2008): Noninvasive mapping of human trigeminal brainstem pathways. Magn Reson Med 60: 1037–1046. [DOI] [PMC free article] [PubMed] [Google Scholar]
- Wakana S, Jiang H, Nagae‐Poetscher LM, van Zijl PC, Mori S. ( 2004): Fiber tract‐based atlas of human white matter anatomy. Radiology 230: 77–87. [DOI] [PubMed] [Google Scholar]