

Abstract
Cholinergic inputs from the basal forebrain regulate multiple olfactory bulb (OB) functions, including odor discrimination, perceptual learning, and short-term memory. Previous studies have shown that nicotinic cholinergic receptor activation sharpens mitral cell chemoreceptive fields, likely via intraglomerular circuitry. Muscarinic cholinergic activation is less well understood, though muscarinic receptors are implicated in olfactory learning and in the regulation of synchronized oscillatory dynamics in hippocampus and cortex. To understand the mechanisms underlying cholinergic neuromodulation in OB, we developed a biophysical model of the OB neuronal network including both glomerular layer and external plexiform layer (EPL) computations and incorporating both nicotinic and muscarinic neuromodulatory effects. Our simulations show how nicotinic activation within glomerular circuits sharpens mitral cell chemoreceptive fields, even in the absence of EPL circuitry, but does not facilitate intrinsic oscillations or spike synchronization. In contrast, muscarinic receptor activation increases mitral cell spike synchronization and field oscillatory power by potentiating granule cell excitability and lateral inhibitory interactions within the EPL, but it has little effect on mitral cell firing rates and hence does not sharpen olfactory representations under a rate metric. These results are consistent with the theory that EPL interactions regulate the timing, rather than the existence, of mitral cell action potentials and perform their computations with respect to a spike timing-based metric. This general model suggests that the roles of nicotinic and muscarinic receptors in olfactory bulb are both distinct and complementary to one another, together regulating the effects of ascending cholinergic inputs on olfactory bulb transformations.
Introduction
The olfactory bulb (OB) is innervated by cholinergic fibers arising from the basal forebrain (Macrides et al., 1981; Záborszky et al., 1986) that strongly regulate odor representations and olfactory plasticity (Wilson et al., 2004). Disruption of cholinergic activity within the olfactory system reduces rodents' discrimination of perceptually similar odorants and impairs short-term odor memory (Roman et al., 1993; Linster et al., 2001; Mandairon et al., 2006), whereas enhancing cholinergic function sharpens mitral cell (MC) tuning curves (Ma and Luo, 2012) and improves discrimination among similar odorants (Doty et al., 1999; Mandairon et al., 2006; Chaudhury et al., 2009). Aging and neurodegenerative disorders both have been associated with the degeneration of olfactory cholinergic regulation (Durand et al., 1998; Mandairon et al., 2011), suggesting that understanding the circuit mechanisms of cholinergic neuromodulation in the OB could provide valuable insights into these processes.
The effects of acetylcholine (ACh) in the OB are mediated by both nicotinic and muscarinic cholinergic receptor subtypes (Castillo et al., 1999). Nicotinic activation sharpens the chemoreceptive fields of MCs, the principal output neurons of the OB, as well as animals' behavioral discrimination of similar odors (Chaudhury et al., 2009), likely via an intraglomerular circuit that is independent of OB topography (Mandairon et al., 2006). However, the concerted effects of muscarinic neuromodulation have not yet been computationally elucidated in OB models.
In slice preparations from rodent OB and accessory olfactory bulb, muscarinic agonists potentiate excitatory synaptic inputs from MCs to granule cells (GCs) and also enhance GC inhibition of MCs by increasing GC intrinsic excitability (Pressler et al., 2007; Ghatpande and Gelperin, 2009; Smith and Araneda, 2010; Takahashi and Kaba, 2010). These dense reciprocal synaptic interactions between the MC and GC populations comprise the external plexiform layer (EPL) of the OB (Fig. 1A) and are the primary source of gamma-band local field potential (LFP) oscillations within the OB (Neville and Haberly, 2003; Lagier et al., 2004). As gamma oscillations are indicative of the dynamical synchronization of neuronal populations (Kashiwadani et al., 1999; Rojas-Líbano and Kay, 2008), and the regulation of spike timing is thought to be an important feature of OB output (Linster and Cleland, 2010; Gschwend et al., 2012), muscarinic effects on this circuit are likely to regulate afferent information exported from the OB even if mitral cell spike rates are not affected. Moreover, as muscarinic activation in vivo presumably coincides with nicotinic activation, it is important to understand how these two mechanisms interact.
Figure 1.
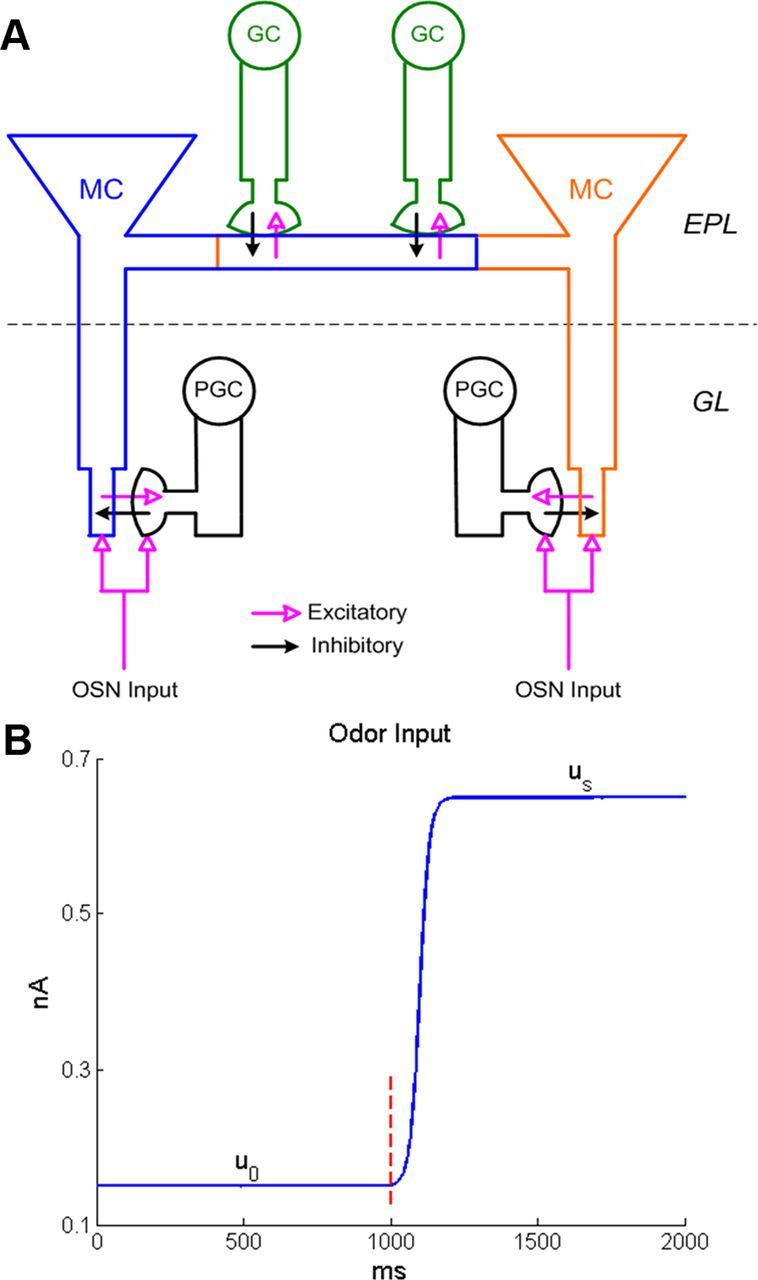
A, Schematic representation of dendrodendritic synaptic connectivity among MCs, PGCs, and GCs. The first computational layer of the olfactory bulb is the glomerular layer (GL), in which each glomerulus comprises a single input from a convergent olfactory sensory neuron population (OSN input) along with dendrodendritic interactions between an MC and a PGC. Two glomeruli are depicted. Mitral cells innervating different glomeruli interact with one another (indirectly) in the second computational layer, the EPL. Here, MC lateral dendrites excite GC dendrites and GCs inhibit MCs, producing a functionally lateral inhibitory network among MCs. See Materials and Methods for details. B, Example of the sigmoidal, noninstantaneous time course of OSN input as delivered to MCs and PGCs in the network model. The dotted vertical line indicates the nominal time of odor onset.
We developed a biophysically constrained network model of the OB including both glomerular-layer and EPL computations and incorporating both nicotinic and muscarinic neuromodulatory effects on model neurons. Simulation results show that nicotinic activation sharpens olfactory representations by suppressing mitral cell spiking, whereas muscarinic activation enhances mitral cell spike synchronization by modulating the dynamics of gamma-band intrinsic oscillation in OB. Interestingly, the model also shows how the effects of these two mechanisms are distinct and yet complementary, together achieving transformations in odor representations that neither neuromodulator alone can produce.
Materials and Methods
The model network.
The rodent olfactory bulb contains ∼1000–1200 independently tuned glomeruli, 5 × 10⁴ MCs, a comparable number of periglomerular cells (PGCs), and 5 × 10⁶ GCs (Panhuber et al., 1985; Shepherd et al., 2004). Both MC–PGC synapses (within glomeruli) and MC–GC synapses (in the EPL) are mediated by dendrodendritic interactions (Rall et al., 1966; Jahr and Nicoll, 1980; Aungst et al., 2003). The model network described herein (Fig. 1A) was scaled down substantially, containing 25 independently tuned glomeruli: 25 MCs, 25 PGCs, and 100 GCs, for a total of 150 model cells. Each glomerulus in the model contained one MC and one PGC that were coactivated by afferent (odor) input[i.e., the PGC was modeled as a PGo cell (Shao et al., 2009)]. Each MC was reciprocally synaptically connected to its coglomerular PGC; specifically, the MC excited the PGC dendritic spine, whereas the latter inhibited the MC tuft compartment via graded inhibition (Fig. 1A; Cleland and Sethupathy, 2006). In the EPL, deep to the glomerular layer, the lateral dendrites of mitral cells also make a large number of reciprocal synaptic contacts with granule cell spines (Isaacson and Strowbridge, 1998). As these lateral dendrites of mitral cells extend broadly across the olfactory bulb, and support action potential propagation, the MC–GC connectivity matrix is not likely to depend strongly on distance [see Cleland (2010) for discussion of this point]. In the model, each MC connected to GCs with a uniform probability (p = 0.3). Hence, for a network with 25 MCs and 100 GCs, one MC received an average of 30 GC inputs and one GC received an average of 7.5 MC inputs. The location of each dendrodendritic contact along the MC lateral dendrite was determined by drawing randomly from a uniform distribution. Because of the explicit modeling of synaptic locations along the length of the dendritic cable, the network dynamics of the model thereby incorporated a realistic distribution of lateral propagation delays.
Mitral cell model.
All model neurons in the network were conductance-based compartmental models. The MC model consisted of a soma (single compartment; diameter, 20 μm; length, 25 μm), a primary (apical) dendrite (five compartments; diameter, 3.5 μm; length, 370 μm), a secondary (lateral) dendrite (seven compartments; diameter, 3.4 μm; length, 500 μm), and a glomerular tuft at the distal end of the primary dendrite (one compartment; diameter, 0.5 μm; length, 20 μm). The values for the specific membrane resistance, membrane capacitance, and cytoplasmic (axial) resistivity were, respectively, Rm = 30 KΩ-cm2, Cm = 1.2 μF/cm2, and Ra = 70 Ω-cm. Cellular dimensions and passive electrotonic parameters were based on experimental measurements (Shen et al., 1999). The leak current reversal potential (EL) was set to −60 mV, and the resulting resting potential was −68.8 mV.
The MC model cell contained the following active ionic currents, consistent with previous modeling studies (Bhalla and Bower, 1993; Davison et al., 2000; Bathellier et al., 2006; Rubin and Cleland, 2006): fast, spike-generating (INa) and persistent (INaP) sodium currents; a potassium delayed rectifier (IDR); two transient potassium currents (fast-inactivating IA and slow-inactivating IKS); an L-type calcium current (ICaL); and a Ca2+-dependent potassium current (IKCa). The kinetics of INa, IDR, ICaL, and IKCa were based on those of a previous MC model by Bhalla and Bower (1993), whereas the kinetics of INaP and IKS were derived from Wang (1993), who modeled layer V cortical pyramidal neurons. The mathematical description of IA was taken from a previous model by Migliore et al. (2005) based on mitral cell data (Wang et al., 1996). To adjust the spike threshold, the activation and inactivation functions of INa were shifted by −3 mV. The distribution and conductance densities of ionic currents (Table 1) were based on previous mitral cell models (Bhalla and Bower, 1993; Rubin and Cleland, 2006) and adjusted to reproduce MC properties reported experimentally (Chen and Shepherd, 1997; Desmaisons et al., 1999; Balu et al., 2004).
Table 1.
Maximal conductances (mS/cm2) of different ionic currents in MC, GC, and PGC model cells
| INa | INaP | IDR | IM | IA | IKS | IH | ICaL | ICaP/N | ICaT | ICAN | IKCa | |
|---|---|---|---|---|---|---|---|---|---|---|---|---|
| MC | ||||||||||||
| Soma | 50 | 0.2 | 30 | 10 | 40 | 0.4 | 5 | |||||
| Apical dendrite | 20 | 0.1 | 10 | 18 | 0.2 | |||||||
| Glomerular tuft | 20 | 0.1 | 10 | 18 | 0.2 | |||||||
| Lateral dendrite | 30 | 0.02 | 20 | 8.0 | 0.05 | |||||||
| GC | ||||||||||||
| Soma | 50 | 20 | 0.5 | 20 | ||||||||
| Dendrite and spine | 20 | 5.0 | 60 | 0.2 | 0.1 | 1.0 | 0.5 | |||||
| PGC | ||||||||||||
| Soma | 50 | 20 | 1.0 | 10 | ||||||||
| Dendrite and spine | 20 | 5 | 30 | 0.2 | 1.0 | 3.0 | — | 2.0 |
Granule cell model.
The GC model consisted of a soma (single compartment; diameter, 8 μm; length, 8 μm) and a radial dendrite (one compartment; diameter, 1 μm; length, 150 μm) connected to a spine shaft and body (1 μm diameter and length each). The membrane resistance was Rm = 30 KΩ-cm2, membrane capacitance was Cm = 2.0 μF/cm2, and axial resistivity was Ra = 70 Ω-cm. Cellular dimensions and passive electrotonic parameters were taken from Migliore and Shepherd (2008). The leak current reversal potential (EL) was set to −60 mV, and the resting potential was −75 mV.
Based on experimental findings (Wellis and Kauer, 1994; Schoppa and Westbrook, 1999; Hall and Delaney, 2002; Pinato and Midtgaard, 2003) and previous modeling studies (Bhalla and Bower, 1993; Davison et al., 2003; Inoue and Strowbridge, 2008; Migliore and Shepherd, 2008), the GC model cell contained the following eight active ionic currents: a fast, spike-generating sodium current (INa); a potassium delayed rectifier (IDR); a transient A-type potassium current (IA); a noninactivating muscarinic potassium current (IM); a low-threshold inactivating (ICaT) and a high-threshold (ICaP/N) calcium current; a Ca2+-activated nonspecific cation current (ICAN); and a Ca2+-dependent potassium current (IKCa). The kinetics of INa, IDR, and IA were taken from a previous GC model by Migliore and Shepherd (2008). The mathematical description of ICaT, ICaP/N, and ICAN was adapted from Inoue and Strowbridge (2008) and those for IM and IKCa from Bhalla and Bower (1993). To obtain the high spiking threshold seen in GCs, the activation and inactivation functions of the INa current were shifted by 5 mV. The distribution and densities of ionic currents were based on previous modeling studies (Bhalla and Bower, 1993; Inoue and Strowbridge, 2008; Migliore and Shepherd, 2008) and adjusted to reproduce the GC characteristics from experimental reports (Wellis and Kauer, 1994; Schoppa and Westbrook, 1999; Hall and Delaney, 2002; Pressler et al., 2007). In particular, all the Ca2+ and Ca2+- dependent currents were placed into the dendrite and spine compartments (Inoue and Strowbridge, 2008).
Periglomerular cell model.
Periglomerular cells are heterogeneous in morphology, physiology, and connectivity and in the expression of cellular markers, and as a rule these different bases for classification do not correspond with one another (Kosaka and Kosaka, 2005). In terms of connectivity, one subclass of PGCs receives primary excitation from olfactory receptor neurons (PGo type) whereas another is excited primarily by external tufted cells [PGe type (Shao et al., 2009; for review, see Cleland, 2010)]. The PGCs described here represent the PGo type. In terms of intrinsic electrophysiological properties (in slice preparations), PGCs have been categorized into four loose classes according to their firing properties: one that exhibits calcium-dependent, low-threshold spikes (LTSs) and three non-LTS classes exhibiting accommodating, nonaccommodating, and irregular spiking properties (McQuiston and Katz, 2001). The PGCs modeled here exhibit LTS bursts. PG model cells included a soma (single compartment; diameter, 8 μm; length, 8 μm) and a main radial dendrite (one compartment; diameter, 1 μm; length, 100 μm) connected to a spine shaft and body (1 μm diameter and length each). Values for the membrane resistance, membrane capacitance, and axial resistivity were, respectively, Rm = 20 KΩ-cm2, Cm = 1.2 μF/cm2, and Ra = 80 Ω-cm. The leak current reversal potential (EL) was set to −65 mV, resulting in a resting membrane potential of −75.8 mV.
Based on a previous modeling study (Cleland and Sethupathy, 2006), the PG model cell contained all the ionic currents possessed by the GC model cell except the ICAN current and additionally contained a hyperpolarization-activated current (IH). Notably, this list includes a muscarinic M-current, which contributes to PGC excitability; studies of receptor expression in OB have shown that whereas muscarinic receptors are primarily expressed in the EPL and deeper layers, they also are weakly expressed in the glomerular layer (Le Jeune et al., 1995). The kinetics of the current IH were taken from Cadetti and Belluzzi (2001); other current kinetics were the same as those of GC cell currents, with the activation curve of the ICaT current shifted by −15 mV to replicate the LTS cell firing pattern (McQuiston and Katz, 2001). The distribution and densities of ionic currents are shown in Table 1.
Kinetics of membrane mechanisms.
All ionic conductance kinetics were modeled using the Hodgkin-Huxley formalism (Hodgkin and Huxley, 1952). Specifically, the ionic current for channel i, Ii, was modeled as Ii = gimphq(V − Ei), where gi is the maximal conductance density, m is the activation variable (with exponent p), h is the inactivation variable (with exponent q), and Ei is the reversal potential. The ICAN current used a slightly modified equation (Inoue and Strowbridge, 2008): ICAN = gCAN M([Ca]i)m(V − Ecation), where M([Ca]i) = [Ca]i/(200 + [Ca]i) is a Michaelis-Menten function and [Ca]i indicates the intracellular calcium concentration. Except for the INaP current, for which m = m∞(V), the kinetic equation for the gating variable x (m or h) satisfied the following first-order kinetic model:
 |
where φx is a temperature-dependent factor (defined at 35°C), x∞ is the voltage-dependent steady state, and τx is the voltage-dependent time constant in milliseconds. Equivalently, Equation 1 can be written as follows:
 |
where αx and βx are the voltage-dependent rate constants with dimensions of ms−1. The exponents p and q, temperature factor φx, rate constants αx and βx, steady-state x∞, and time constant τx of the gating variables are shown in Table 2 for MCs and in Table 3 for GCs and PGCs. The sodium reversal potential was set to ENa = +45 mV and the potassium to EK = −80 mV. The reversal potentials for the IH and ICAN currents were EH = 0 mV and Ecation = +10 mV, respectively (Cadetti and Belluzzi, 2001; Inoue and Strowbridge, 2008). The calcium reversal potential (ECa) was dynamically determined by the Nernst equation in all cell types in the model.
Table 2.
Gating variable kinetics in the MC model

Table 3.
Gating variable kinetics in the GC and PGC models

Calcium dynamics.
Intracellular calcium was regulated by a simple first-order differential equation of the following form (Bhalla and Bower, 1993):
 |
where w is the thickness of the perimembrane “shell” in which calcium is able to affect membrane properties (MC, 1 μm; GC and PGC, 0.2 μm), z = 2 is the valence of the Ca2+ ion, F is the Faraday constant, and τCa is the Ca2+ removal rate [MC, 10 ms (Bhalla and Bower, 1993); GC and PGC, 800 ms (Inoue and Strowbridge, 2008)]. The resting Ca2+ concentration was set to [Ca2+]rest = 0.05 μmol/l.
Synaptic currents.
The MC→GC and MC→PGC projections were mediated by both AMPA and NMDA receptors, whereas the GC→MC and PGC→MC connections were mediated by GABAA receptors. Postsynaptic currents were modeled by the following equation (Wang and Buzsáki, 1996; Brea et al., 2009):
where w is the synaptic weight, gsyn is the maximal synaptic conductance, and Esyn is the reversal potential. The default maximum conductances are as follows: gAMPA = 2 nS and gNMDA = 1 nS for both the MC→PGC and MC→GC synapses, gGABA = 2 nS for the PGC→MC synapses, and gGABA = 1.5 nS for the GC→MC synapses. All synaptic weights were set to 1 except for the PGC→MC synapse, which was set to 8 because each MC only received one PGC input, in contrast to an average of 30 inputs from GCs. The total peak conductance received by an MC from GCs was higher than that received from PGCs: 45 nS from GCs compared with 16 nS from PGCs. For AMPA and NMDA currents, Esyn = 0 mV and for GABAA currents, Esyn = −80 mV (Migliore and Shepherd, 2008). The function B(V), which implemented the Mg2+ block for NMDA currents, was defined as follows (Zador et al., 1990):
 |
where the extracellular magnesium concentration was set to [Mg2+] = 1.0 mmol/l. For AMPA and GABAA currents, B(V) = 1. The gating variable s represented the fraction of open synaptic ion channels and obeyed first-order kinetics (Wang and Buzsáki, 1996):
 |
where the function F(Vpre) was the normalized concentration of the postsynaptic transmitter receptor complex and was assumed to be an instantaneous sigmoidal function of the presynaptic membrane potential, F(Vpre) = 1/(1 + exp(−(Vpre − θsyn)/σ)), where θsyn is the half-activation potential of the synapse. θsyn was set to 0 mV for AMPA/NMDA receptor synapses and to −40 mV for GABAA synapses. The parameter σ determines the gradedness of the synaptic release, and a smaller σ results in steeper activation curve. We set σ to be 0.2 for AMPA/NMDA currents and 2 for GABAA currents. Thus, synaptic excitation was triggered mostly by spikes (high threshold), whereas synaptic inhibition occurred below spiking threshold and was dependent on presynaptic voltage in a graded manner. The channel opening rate constants (α and β) were expressed as α = 1/τα and β = 1/τβ, where τα and τβ were the synaptic rise and decay time constants, respectively. For AMPA receptor currents, τα = 1 ms, τβ = 5.5 ms; for NMDA receptor currents, τα = 52 ms, τβ = 343 ms; and for GABAA receptor currents, τα = 1.25 ms, τβ = 18 ms. These values were based on previous modeling studies (Davison et al., 2003; Inoue and Strowbridge, 2008).
Specific and background inputs.
Odor stimulation was modeled by slow current waveforms injected into all MCs and PGCs that represented the instantaneous combined frequencies of convergent olfactory receptor neuron (ORN) spike inputs. This afferent input was delivered to the glomerular tuft compartments of MCs and the spine compartments of PGCs (Fig. 1A) and modeled using the following sigmoidal function (Brea et al., 2009):
 |
where u0 is the preodor value (simulated pure air input; in nanoamperes) and us is the steady-state odor-excitation value (in nanoamperes; Fig. 1B). The parameter r determined the increase rate from u0 to us (set to be 100) and tORN the time of odor onset. Different MC cells (representing different, independently tuned glomeruli) received different levels of odor activation: the corresponding values of u0 and us were drawn from a uniform distribution (Brea et al., 2009): u0ϵ (0.1,0.2) and usϵ (0.2,1.0). The corresponding values for each associated PGC was scaled down by a factor of 0.4 to compensate for the much higher input resistance in PGCs; i.e., u0PG = 0.4u0MC and usPG = 0.4usMC (separately for each glomerulus). For visual clarity and ease of comparison, the 25 individual inputs (together representing one odor) were arranged in ascending and then descending order on figures according to the stationary odor values (us), as in previous modeling studies (Cleland and Sethupathy, 2006; Mandairon et al., 2006); no computationally relevant organization among glomeruli is implied. The large number of glomeruli that are not activated by any given odorant were excluded from these simulations.
In addition to these afferent odor inputs (to MCs/PGCs), all cells in the network (including GCs) received random excitatory inputs representing intrinsic and extrinsic sources of background noise. These nonspecific inputs were modeled as uncorrelated Poisson spike trains delivered to each neuron at a mean rate of 100 Hz and mediated by AMPA receptors modeled as an instantaneous step followed by an exponential decay with τ = 10 ms for MC cells and τ = 5.5 ms for GC/PGCs (Davison et al., 2003). The maximal conductance values for this current noise were adjusted to achieve spontaneous firing rates of each cell type as reported experimentally (Wellis and Scott, 1990; Cang and Isaacson, 2003) along with membrane potential fluctuations comparable with those observed in experimental recordings (Luo and Katz, 2001; Cang and Isaacson, 2003). In most figures, the model network received this background activity stimulation alone for the first 2 s, followed by the addition of afferent odor input lasting for an additional 1 s. To quantify network performance, we used several measures of spike frequency that are defined as follows. The spontaneous firing rate was measured during the 1 s period before odor onset, whereas the firing rate during the 1 s odor presentation was termed the odor-evoked rate. The difference between the odor-evoked rate and the spontaneous firing rate, which can be negative, is referred to as the odor-coding rate.
Simulated nicotinic and muscarinic effects.
The activation of nicotinic ACh receptors (nAChRs) has been shown to excite MCs and bipolar PGCs, probably owing to the opening of a nicotine-gated cation current in these cells (Castillo et al., 1999; D'Souza and Vijayaraghavan, 2012). Following Mandairon et al. (2006), this current was modeled as a simple ohmic current [Inic = gnic (v − Enic)] inserted into the tuft compartments of MCs and the spine compartments of PGCs. Similar results were achieved when the nicotinic current was inserted into the MC primary dendrite and the PG dendrite instead. The conductance density gnic was set to 1 mS/cm2 for MCs and 15 mS/cm2 for PGCs (because of the much larger surface area of the MC tuft compartment compared with the PGC spine compartment), and the reversal potential was set to Enic = 3.2 mV (Castillo et al., 1999).
In contrast, the activation of muscarinic ACh receptors (mAChRs) potentiates the excitability of GCs and the efficacy of their output by transforming postspike afterhyperpolarizations (AHPs) into sustained afterdepolarizations (ADPs) (Pressler et al., 2007; Smith and Araneda, 2010). To simulate the effect of mAChR activation, we set the conductance densities of the muscarinic potassium current IM and the Ca2+-dependent potassium current IKCa to zero, since these two conductances underlie AHP responses and are blocked by muscarinic agonists (Madison et al., 1987; Barkai and Hasselmo, 1994; Wang, 1999; Pressler et al., 2007).
Simulated local field potential and spike phase.
A simulated local field potential (sLFP) was constructed by filtering the mean (somatic) membrane potentials across all MCs (Bathellier et al., 2006). Filtering was performed numerically using a bandpass filter (20–100 Hz) with the MATLAB functions FIR1 and FILTFILT (Brea et al., 2009). The frequency spectrum of the signal was obtained by a fast Fourier transform of the filtered sLFP. To analyze the degree of phase-locking between MC spikes and the sLFP, MC somatic spike times were converted to phases with respect to the sLFP. The positive peaks of the sLFP were assigned a phase of 0° (or 360°), and the phase of each spike (ϕ) was computed according to the following equation (Lagier et al., 2004):
 |
where tspike is the spike time, tlastLFPpeak is the time of the preceding positive sLFP peak, and tnextLFPpeak is the time of the following positive sLFP peak. To locate a sLFP peak, all the local maxima and minima were identified first and the average minimum-maximum (min-max) distance was then computed. To qualify as a positive sLFP peak, the local maximum needed to have the largest value from the beginning (for the first positive peak) or from the last negative sLFP peak to the current searching point and needed to be greater than the current point (on the right) by at least 30% of the average min-max distance. Similarly, to qualify as a negative sLFP peak, the local minimum had to have the smallest value within the range from the last positive sLFP peak to the current searching point and had to be smaller than the current point (on the right) by at least 30% of the mean min-max distance. This procedure helped to smooth the sLFP oscillation cycles by removing small fluctuations. For better visualization, phases are depicted from [−180°, 180°] in figures.
Oscillation and synchronization indices.
The oscillation index corresponded to the amplitude of the secondary peak of the normalized sLFP autocorrelation and ranged from 0 to 1 (Bathellier et al., 2006). We also used a direct measure of the oscillatory power: the peak of the frequency power spectrum of sLFP. The oscillation frequency was determined from the position of the spectral peak (Brunel and Wang, 2003).
To assess the synchronization of spikes across the network, two indices of synchrony were used: a spike train synchrony (STS) index (Brunel and Wang, 2003) and a phase-locking index (Bathellier et al., 2006). To calculate the STS index, the 1 s odor presentation period was divided into 5 ms bins, and the total network activity was obtained by summing up spike trains across all MCs. The autocovariance (mean-removed autocorrelation) of the total network activity was computed and normalized by the square of the average firing rate of cells in the network (i.e., it was not normalized to unity at zero lag). The STS index was defined as the autocorrelation at zero time, which is equal to the average cross-correlation among spike trains at zero time (Brunel and Wang, 2003). The phase-locking index was calculated as follows (Bathellier et al., 2006):
 |
where ϕi is the phase of each spike in the network relative to the sLFP peak. When all the spikes have identical phase, the index achieves its maximal value of unity. The difference between the STS index and the phase-locking index is that the former measures the absolute spike synchrony (in time) and is not bounded (e.g., it changes when the bin width changes), whereas the latter measures how tightly the spikes are coupled to the sLFP cycle and is bounded between 0 and 1. In the present simulations, both indices performed similarly in a qualitative sense.
Measures for contrast enhancement.
Contrast enhancement is a common property of sensory systems that narrows (sharpens) sensory representations by specifically inhibiting neurons on the periphery of the representation (Cleland and Linster, 2012). To quantify the degree of contrast enhancement, we defined a contrast enhancement (CE) index as the ratio of the average firing rate of MCs in the center of the representation to that of MCs in the periphery of the representation (i.e., the CE index reflects the traditional contrast enhancement metric; it is not sensitive to spike timing on a fine time scale). Since there were 25 MCs in this model, artificially organized by activation level such that MC13 (in the middle) received the strongest input, the “center” MCs were defined as MC8–MC18, and the remainder of the MCs constituted the “periphery” of the representation. As noted above, nonactivated MCs (i.e., those outside the periphery) were excluded from the present simulations.
Numerical methods.
The model was implemented in the neuronal simulator package NEURON, version 7.2 (Carnevale and Hines, 2006), using the Crank-Nicholson integration method and a time step of 1 μs (0.001 ms). Shorter time steps did not change the results. Cellular simulations were initially run on a workstation under Windows XP; final network simulations were run on a 960-core Linux cluster running Red Hat Enterprise Linux Server (version 5.1) and administered by the Cornell Center for Advanced Computing. The simulation output data were saved in files and analyzed off-line using custom Matlab scripts.
Results
Single-cell firing properties
Mitral cell
The firing properties of the model MC are shown in Figure 2. In response to depolarizing square current pulses injected into the soma, model MCs exhibited delays before generation of the first action potential (Fig. 2A) and then generated recurring bursts of action potentials interspersed with periods of subthreshold oscillations (STOs; Fig. 2B), consistent with experimental data (Chen and Shepherd, 1997; Desmaisons et al., 1999; Balu et al., 2004). As the injected current amplitude increased, the STO and intraburst spike frequencies increased (Fig. 2C; Desmaisons et al., 1999), as did the number of spikes per cluster (Fig. 2D; Balu et al., 2004). However, in the model, the STO frequency was about 3–5 Hz faster than the within-cluster spike frequency, as observed in previous modeling studies (Rubin and Cleland, 2006), whereas experimental firing frequencies were more similar to their STO frequencies (Desmaisons et al., 1999). Spontaneous IPSPs were able to reset the phase of the STOs and to generate rebound action potentials when the membrane potential was more depolarized than −65 mV, as has been observed experimentally (Desmaisons et al., 1999; also see Rubin and Cleland, 2006). Specifically, when the IPSP generated by an artificial (α) synapse was small (gI = 3 nS), the phase of STOs was reset (Fig. 2E), whereas a larger IPSP (gI = 10 nS) also elicited a rebound spike (Fig. 2F).
Figure 2.

Firing properties of the model MC. A, Voltage responses of the MC model to four different levels of current injection. B, Expanded time view of A to highlight STOs between spike clusters. C, STO and intraburst spike frequencies as a function of injected current. D, The number of spikes per cluster as a function of injected current. E, Transiently opening a shunting inhibitory conductance resets the STO phase. F, A larger IPSC resets the STO phase and also generates a rebound spike.
Granule cell
The responses of the model GC to different levels of depolarizing current injection from rest are shown in Figure 3A. In response to a weak current step (30 pA, 600 ms), three spikes were generated, and activation of the IA current introduced a delay to the first spike (Fig. 3A, bottom; Schoppa and Westbrook, 1999). With higher current injections (100 pA, 200 pA), the GC fired tonically without appreciable delay (Fig. 3A, middle and top). When the current injection increased further, to 220 pA, ramping depolarization was evoked, resulting in a progressive decline in spike amplitude and eventually a depolarizing rise to an inactivated plateau (Fig. 3B, top; Hall and Delaney, 2002; Pinato and Midtgaard, 2003). This ramping depolarization could be suppressed by blocking the Ca2+-dependent cation current ICAN (Fig. 3B, bottom), consistent with experimental observations (Hall and Delaney, 2002).
Figure 3.

Firing properties of the model GC. A, Voltage responses of the GC model to three different levels of current injection. B, Voltage responses of the GC model to a large (220 pA) current injection in the presence (top) and absence (bottom) of the ICAN current. The ramping depolarization evoked by this large injected current was suppressed by blockade of the ICAN current. C, The effect of muscarinic neuromodulation (carbachol, CCh) was simulated by blocking the IM and IKCa currents. This suppressed the AHP that was normally evoked by depolarizing steps and revealed a latent ADP. The prepulse resting membrane potential was −64 mV. D, The ADP produced under muscarinic neuromodulation depended on the prepulse resting membrane potential [−63 mV (top), −61 mV (bottom)] and could reach spike threshold.
One important characteristic of GCs is that they normally generate AHP responses after spiking but after activation of muscarinic receptors instead generate ADP responses, which can underlie persistent firing (Pressler et al., 2007; Inoue and Strowbridge, 2008). The model granule cell also produced an AHP response under default conditions (Fig. 3C, top). To simulate the application of muscarinic cholinergic agonists, we set both gM and gKCa to zero (see Materials and Methods). In agreement with experimental data (Pressler et al., 2007), this simulated muscarinic modulation reduced the AHP to reveal an underlying ADP response (Fig. 3C, bottom). Notably, the amplitude of this ADP was dependent on prepulse voltage and could reach spike threshold (Fig. 3D, top). Moreover, when the prepulse voltage was high enough, this ADP evoked persistent firing of the granule cell (Fig. 3D, bottom), as observed experimentally (Pressler et al., 2007).
Periglomerular cell
The model PGC evoked large-amplitude, Ca2+-dependent, low-threshold spikes in response to depolarizing current injections (Fig. 4, top and middle) or to the release of a hyperpolarizing input (anode break response; Fig. 4, bottom), as observed experimentally (McQuiston and Katz, 2001). Non-LTS firing patterns that also have been observed in PGCs were not modeled in this study.
Figure 4.

Firing properties of the model PGC. Two different levels of depolarizing current injection (top and middle) produce calcium T current-dependent LTSs. Release from a hyperpolarizing current injection (bottom) can produce an anode break LTS.
Nicotinic activation sharpens olfactory representations via glomerular-layer computations
Previous computational studies in simpler model neurons have indicated that PGCs alone can effect traditional olfactory contrast enhancement (i.e., MC receptive field sharpening based on ORN receptive fields and assessed by MC spike rates) and that they do so via a nontopographical circuit mechanism that is independent of specific connections among OB columns (Cleland and Sethupathy, 2006; Cleland, 2010; Cleland and Linster, 2012). To examine the efficacy of this mechanism in the present, more complex network model, we first simulated computations in the glomerular layer alone and assessed the effects of nicotinic neuromodulation therein (Figs. 5, 6). Membrane potential time series of seven representative MC cells (recorded from the soma) under noisy baseline conditions (see Materials and Methods) and in response to afferent (odor) input are illustrated under control conditions (Fig. 5A) and during nicotinic cholinergic activation (Fig. 5B). Before odor onset, MCs under control conditions fired randomly at a mean rate of 3.3 Hz, consistent with experimental observations (Luo and Katz, 2001; Cang and Isaacson, 2003). Odor presentation elicited either net excitatory or net inhibitory responses in different MCs (Fig. 5A), depending on the relative strengths of the afferent inputs that they received (Fig. 6A). MC13, which received the strongest excitatory afferent input (Fig. 6A, top), also displayed strong excitatory responses to odor presentation, as did other MCs receiving these strongest levels of input. MCs such as MC4 and MC21, in the “shoulder regions” of the odor representation, received moderate levels of afferent excitation and produced net inhibitory responses with lower odor-evoked activities (Fig. 6A, middle) and lower or negative odor-coding rates (Fig. 6A, bottom).
Figure 5.

Simulated MC and PGC responses in the glomerular-layer model. A, Current-clamp responses of seven representative MCs under control conditions. B, As in A, but with nAChR neuromodulation active. C, Current-clamp responses of seven PGCs associated with the same glomeruli as the MCs in A, under control conditions. D, As in B, but with nicotinic cholinergic neuromodulation active. E, PGC-mediated GABAA conductances measured from the same representative MCs under control conditions. F, As in E, but with nicotinic cholinergic neuromodulation active. Black horizontal bars indicate the duration of odor input (same for below), and the numbers on the top of the voltage traces in C and D indicate the baseline voltage levels during odor presentation (i.e., excluding spikes).
Figure 6.

Activation of nicotinic cholinergic receptors sharpens MC tuning curves in the glomerular-layer model. A, Histograms of activity in all 25 glomeruli under control conditions, artificially arranged according to their levels of afferent activation for ease of visualization. Top, Steady-state OSN input levels; middle, odor-evoked spike rates in MCs; bottom, odor-coding spike rates in MCs (see Materials and Methods). B, As in A, but with nicotinic cholinergic neuromodulation active. C, Raster plot of MC spiking activity immediately before and after the onset of odor presentation, under control conditions. D, As in B, but with nicotinic cholinergic neuromodulation active. E, Simulated LFP (top) during odor presentation, with autocorrelation (middle) and power spectrum (bottom), under control conditions. F, As in E, but with nicotinic cholinergic neuromodulation active.
Notably, this shoulder region constitutes the “inhibitory surround” in high-dimensional odor similarity space; that is, it reflects all of the possible ways in which an odorous ligand may differ from the optimal ligand for a given receptor so as to effect a lower ligand–receptor potency and, correspondingly, a reduced activation of olfactory sensory neurons (OSNs). Odorant-evoked excitation of MCs was determined by afferent input levels to model glomeruli, and these input levels correspond to the ligand–receptor potency of that odorant's interactions with the primary olfactory sensory neuron population converging to excite the MC and PGC of that glomerulus. After excitation by this afferent input, and incorporating the feedforward shunt inhibition delivered by PGCs, the MCs associated with high ligand–receptor potencies were strongly activated, the MCs associated with very weak potencies (mostly excluded from the model) were not systematically activated, and the MCs associated with moderate potencies (the surround) were inhibited. This result closely reflects previous computational results (Cleland and Sethupathy, 2006) and replicates previous experimental findings (Yokoi et al., 1995) as described in that computational work. Moreover, this framework makes clear how the established cellular effects of nicotinic neuromodulation can naturally give rise to the systematic effects on MC activation and olfactory discrimination that have been observed (Mandairon et al., 2006; Chaudhury et al., 2009).
Activation of nAChRs in the model increased the mean spontaneous firing rate of MCs from 3.3 ± 3.4 to 4.6 ± 0.8 Hz (mean ± SD; Table 4), consistent with observed nicotinic effects on MC spontaneous activity (Castillo et al., 1999). In contrast, the mean odor-evoked rate remained relatively constant (control, 9.0 ± 5.3 Hz; nAChR, 8.3 ± 7.8 Hz), although the odor-evoked firing rates of individual MCs were differentially modulated (Fig. 5, compare B, A). Overall, cholinergic activation enhanced the strongest MC responses and also increased the reliability and the range of surround suppression of MC spiking. Specifically, MCs receiving strong afferent input showed elevated firing activity in response to odor, whereas MCs receiving moderate or weak odor input responded more weakly or were inhibited below baseline (Fig. 6B). The net result was a sharper and more distinct odor representation in the population activity of MCs when under the influence of nicotinic neuromodulation (Fig. 5, compare B, A and Fig. 6, D, C). This sharpening effect also was reflected in the larger standard deviation of MC firing rates (control, 5.3 Hz; nicotinic neuromodulation, 7.8 Hz).
Table 4.
Average spontaneous and odor-evoked firing rates (mean ± SD, in hertz) of the three model cell types (MC, PGC, GC) across different networks and neuromodulatory states
| Control | nAChR | mAChR | nAChR + mAChR | |
|---|---|---|---|---|
| Glomerular model | ||||
| Spontaneous | ||||
| MC | 3.3 ± 3.4 | 4.6 ± 0.8 | ||
| PGC | 7.8 ± 2.9 | 0.04 ± 0.2 | ||
| Odor evoked | ||||
| MC | 9.0 ± 5.3 | 8.3 ± 7.8 | ||
| PGC | 21.5 ± 16.7 | 21.6 ± 16.2 | ||
| Full model with EPL | ||||
| Spontaneous | ||||
| MC | 2.5 ± 2.8 | 3.2 ± 0.8 | 2.0 ± 2.5 | 2.5 ± 0.9 |
| PGC | 8.0 ± 3.7 | 0.1 ± 0.3 | 8.2 ± 3.2 | 0.04 ± 0.2 |
| GC | 0.7 ± 0.6 | 1.1 ± 0.7 | 1.3 ± 1.1 | 1.7 ± 1.1 |
| Odor evoked | ||||
| MC | 6.7 ± 4.9 | 6.3 ± 6.7 | 5.5 ± 4.5 | 5.4 ± 6.2 |
| PGC | 21.4 ± 16.5 | 21.7 ± 16.4 | 21.3 ± 16.5 | 21.6 ± 16.2 |
| GC | 2.2 ± 1.2 | 1.7 ± 1.1 | 3.9 ± 1.9 | 4.0 ± 2.1 |
Membrane potential time series measured in the spine compartments of the corresponding PGCs are shown in Figure 5, C (control) and D (nicotinic neuromodulation). PGCs exhibited somewhat higher spontaneous activities than MCs (PGC, 7.8 ± 2.9 Hz; MC, 3.3 ± 3.4 Hz; Table 4), as has been observed experimentally (Wellis and Scott, 1990). After odor onset, the depolarization level of PGCs scaled with input intensity (Fig. 5C; note that PG13 is receiving the greatest level of afferent input, as shown in Fig. 6A, top). The number of elicited spikes also correspondingly increased within a certain range, but high input levels led to depolarization block and the persistent inactivation of spiking, though this did not impair graded neurotransmitter release. After nicotinic neuromodulation was induced, PGC spontaneous activity declined dramatically, primarily because the ICaT current was inactivated by nAChR-induced depolarization (Fig. 5D). In contrast, nicotinic activation strongly depolarized PGCs during odor presentation (baseline membrane potentials are indicated atop each voltage trace in Fig. 5C,D), although the average odor-evoked activity was unchanged (control, 21.5 ± 16.7 Hz; nAChR, 21.6 ± 16.2 Hz; mean ± SD).
To visualize the PGC-mediated inhibition of MCs, we measured the profile of MC GABAA conductances (Fig. 5E,F). In the control case, spontaneous PGC spikes could produce large conductance fluctuations (Fig. 5E). During odor presentation, the conductance level was proportional to the input intensity; for example, the GABAA-mediated conductances in MC1 and MC25 were very small because of weak depolarization of PGC1 and PGC25 by odor, those in MC9, MC13, and MC17 were saturated, and those in MC4 and MC21 were intermediate between these two extremes. The nonlinear responses of MCs to odor inputs can now be understood. At low afferent excitation levels, MCs received weak excitatory inputs, but the average inhibition level was also very low, resulting in weak or inconsistent responses (e.g., MC1 in Fig. 5A); at moderate input levels, the excitatory afferent input was overcome by feedforward inhibition, resulting in net inhibitory output (e.g., MC4); at the strongest input levels, PGC-mediated inhibition was saturated and overpowered by direct afferent excitation of MCs, leading to a strong excitatory response in MCs (e.g., MC13). When nAChRs were activated, the feedforward inhibitory conductances induced by weak and moderate odor inputs were substantially increased (Fig. 5, compare F, E), resulting in reduced overall odor-evoked activity in the corresponding MCs. In contrast, as the GABAA conductances on the most strongly activated MCs were already saturated, or closer to saturation, under control conditions, nicotinic activation contributed substantial additional excitation but little or no additional inhibition to these MCs. Importantly, PGC inhibition of MCs was not determined by the PGC firing frequency per se but by the graded, voltage-dependent release of GABA. For example, though the odor-evoked spike rate in PGC1 was reduced under nicotinic neuromodulation (Fig. 5, compare C, D), the shunting inhibitory conductance was stronger (Fig. 5, compare E, F).
The firing rate representations for the control and nAChR-activated cases are depicted in Figure 6, A and B, respectively. The odor-evoked firing rates of MCs on the periphery of the representation (MC1–MC5, MC21–MC25) were substantially reduced by nAChR activation, whereas the firing rates of strongly activated MCs (e.g., MC13) were enhanced, thereby sharpening the representation (Fig. 6A,B, middle). This sharpening effect was even more clearly manifest in the odor-coding rates (Fig. 6A,B, bottom). In controls, only a few cells (e.g., MC4) exhibited inhibitory responses below baseline, whereas in the presence of nicotinic neuromodulation, all of the MCs receiving less than a threshold level of input were inhibited (12 in all). Overall, nicotinic neuromodulation sharply increased the efficacy of olfactory contrast enhancement; the CE index under control conditions was 2.6, whereas in the presence of nicotinic neuromodulation the CE index was 7.5. These results concur with those of previous models of nAChR activation in the glomerular layer (Mandairon et al., 2006) and with recent optogenetic data describing cholinergic effects in the bulb (Ma and Luo, 2012).
The contrast enhancement effect induced by nAChR activation is clearly evident in the raster plots of MC spiking activity (Fig. 6C,D). However, MC spiking activity remained relatively poorly synchronized under both conditions. The STS index indicated that nicotinic neuromodulation slightly increased the synchrony of MC spikes (control, 2.70; nAChR, 3.51; Table 5), though this can primarily be attributed to the fact that nicotinic activation enhanced the firing activity of strongly activated MCs and suppressed that of weakly activated MCs. To measure field potential oscillations, we generated the sLFP time series evoked by odor presentation and computed their autocorrelograms and power spectra both under control conditions (Fig. 6E) and under nicotinic neuromodulation (Fig. 6F). Under control conditions, the sLFP was very irregular, as reflected in the autocorrelogram (Fig. 6E, top and middle), and the power spectrum was flat (Fig. 6E, bottom), indicating the absence of periodic oscillations. When nAChRs were activated, the power in the 20–40 Hz range was slightly increased (Fig. 6F, bottom); however, the increase was small and exhibited no dominant peak, and the sLFP and autocorrelation still indicated that MC activity was irregular (Fig. 6F, top and middle). The relative absence of periodicity was confirmed by the low oscillation indices under both conditions (control, 0.27; nAChR, 0.40; Table 5). This result was reasonably predictable given that, in this glomerular-layer model, there were no connections among different glomeruli and MCs did not receive any common inhibition.
Table 5.
CE, STS, phase-locking, and oscillation indices and power spectral peaks (of sLFP) across different networks and neuromodulatory states
| Control | nAChR | mAChR | nAChR + mAChR | |
|---|---|---|---|---|
| Glomerular model | ||||
| CE | 2.58 | 7.51 | ||
| STS | 2.70 | 3.51 | ||
| Phase-lockinga | 0.38 | 0.45 | ||
| Oscillationa | 0.27 | 0.40 | ||
| Spectrum peak | 0.29 | 0.53 | ||
| Full model with EPL | ||||
| CE | 2.55 | 12.13 | 2.78 | 16.04 |
| STS | 5.20 | 4.94 | 7.50 | 8.30 |
| Phase-lockinga | 0.62 | 0.60 | 0.73 | 0.74 |
| Oscillationa | 0.65 | 0.71 | 0.75 | 0.75 |
| Spectrum peak | 0.90 | 0.76 | 1.65 | 1.66 |
a The phase-locking and oscillation indices are bounded between 0 and 1.
Muscarinic activation enhances gamma oscillations via EPL computations
As demonstrated above, the glomerular-layer model was able to implement traditional contrast enhancement but failed to generate synchronized gamma oscillations. We next incorporated external plexiform layer computations into the model, adding GCs into the network to form a model that included both computational layers of the OB [glomerular-layer model parameters remained the same (Cleland, 2010]. Using this model, we first studied the effects of muscarinic modulation in isolation, followed by the nicotinic effects alone, and finally the concerted effects of activation of the two classes of cholinergic receptor together.
The membrane potential time series of two pairs of mitral cells are depicted in Figure 7, A (control conditions) and B (muscarinic cholinergic receptor activation). Under control conditions, the STOs and spike times of paired MCs synchronized only approximately with one another (Fig. 7A). In contrast, when mAChRs were activated, both the STOs and spikes of arbitrarily paired neurons synchronized more precisely (i.e., the STOs of one MC were in phase with the STOs and spikes of the other MC) (Fig. 7B). In GCs, membrane potentials exhibited large fluctuations under both conditions, and mAChR activation increased both spiking activity and synchrony (Fig. 7C,D). To visualize the aggregate inhibitory effect of GCs on MCs (each MC received inhibitory inputs from ∼30 GCs), we measured the total GABAA conductance received from all presynaptic GCs onto three representative MCs under both control and mAChR-activated conditions (Fig. 7E,F). Muscarinic activation increased the amplitude as well as the periodicity of the inhibitory inputs onto MCs. That is, the increase in GC excitability via muscarinic activation potentiated the periodic inhibition of MCs, generating more stringent phase constraints on MC STOs and spike timing.
Figure 7.
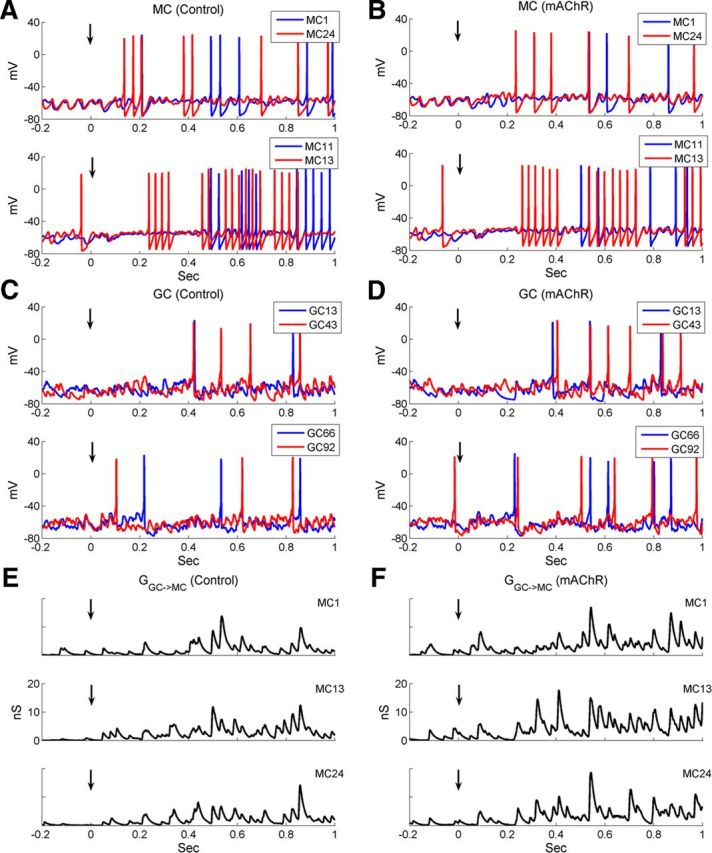
In the full model, including both GL and EPL circuitry, muscarinic activation improves MC spike synchronization. A, Current-clamp responses of two pairs of MCs under control conditions. B, As in A, but with mAChR neuromodulation active. C, Current-clamp responses of two pairs of GCs under control conditions. D, As in B, but with muscarinic cholinergic neuromodulation active. E, Time series of total GABAA-mediated synaptic chloride conductance received from all presynaptic GCs by three representative MCs under control conditions. F, As in E, but with muscarinic cholinergic neuromodulation active. Black vertical arrows indicate the onset of odor stimulation (same for Fig. 10).
Raster plots of MC spike times under control conditions and with mAChR activation are depicted in Figure 8, A and B, respectively. The activation of mAChRs reduced the odor-evoked spike frequency in MCs only slightly (control, 6.7 ± 4.9 Hz; mAChR, 5.5 ± 4.5 Hz; Table 4) but enhanced spike synchrony (STS index: control, 5.20; mAChR, 7.50; Table 5). The GCs fired at very low spontaneous rates in controls (0.7 ± 0.6 Hz; Fig. 8C), as observed experimentally (Cang and Isaacson, 2003; Pressler et al., 2007). In GCs, activation of mAChRs slightly increased the spontaneous spike rate (to 1.3 ± 1.1 Hz) but substantially increased the odor-evoked spike rate (from 2.2 ± 1.2 to 3.9 ± 1.9 Hz; Fig. 8C,D). The minimal effect of mAChR activation on MC firing rates (Fig. 8E,F; Table 4) sharply contrasts with the effect of nicotinic receptor activation, which strongly affected MC firing rates, particularly inhibiting MCs on the periphery (surround) of the odor representation (Fig. 6A,B). Indeed, the CE index after muscarinic neuromodulation (2.78) was similar to that under control conditions (2.55), indicating that mAChR activation had little effect on traditional contrast enhancement. Figures 9, A and B, depict sLFPs along with their autocorrelations and power spectra under control conditions and during mAChR activation, respectively. The relatively weak sLFP oscillation during the first few hundred milliseconds, just after odor stimulation, is consistent with the delay of initial MC spikes during the rising phase of odor delivery. Muscarinic neuromodulation clearly strengthened the oscillatory power of bulbar sLFPs, as demonstrated by the increased amplitude (Fig. 9A,B, top) and stability (Fig. 9A,B, middle) of their periodicity and by the sharp peak generated in the sLFP power spectrum (31 Hz; an appropriate “gamma” frequency in OB slice recordings; Fig. 9A,B, bottom). Moreover, the oscillation index in the presence of mAChR activation (0.75) was larger than under control conditions (0.65), and the power spectral peak was higher (control, 0.90; mAChR, 1.65).
Figure 8.

Activation of muscarinic cholinergic receptors in the full model potentiates GC excitability with little impact on MC firing rates. A, Raster plot of MC spiking activity immediately before and after the onset of odor presentation, under control conditions. B, As in A, but with mAChR neuromodulation active. C, Raster plot of GC spiking activity under control conditions. D, As in C, but with muscarinic cholinergic neuromodulation active. E, Histograms of activity in all 25 glomeruli under control conditions, arranged according to their levels of afferent activation for ease of visualization. Top, Steady-state OSN input levels; middle, odor-evoked spike rates in MCs; bottom, odor-coding spike rates in MCs (see Materials and Methods). F, As in E, but with muscarinic cholinergic neuromodulation active.
Figure 9.

Activation of muscarinic cholinergic receptors in the full model enhances sLFP oscillatory power and imposes more stringent phase-locking between MC spikes and sLFP oscillations. A, Simulated LFP (top) during odor presentation, with autocorrelation (middle) and power spectrum (bottom), under control conditions. B, As in A, but with mAChR neuromodulation active. C, Distribution of MC spike phases with respect to sLFP oscillations under control conditions. D, As in C, but with muscarinic cholinergic neuromodulation active. E, Raster plot of MC spike phases with respect to sLFP oscillations, under control conditions. F, As in E, but with muscarinic cholinergic neuromodulation active. Note that muscarinic activation narrows the distribution of spike phases.
To study the coupling between sLFP oscillations and MC spike timing, we plotted the MC spike phase distribution relative to the oscillation cycles under control and mAChR-activated conditions (Fig. 9C,D). Under both conditions, spike times were phase constrained with respect to the gamma cycle, as spikes were more likely to occur during the crest of the oscillation (i.e., the phase of reduced inhibition by GCs). Under muscarinic modulation, MC spikes were more tightly phase constrained than they were under control conditions. Specifically, the probability of spikes occurring within the two central bins (−30° to +30°) was 0.46 under control conditions and increased to 0.61 when mAChRs were activated. Muscarinic activation also generated a higher phase-locking index relative to controls (control, 0.62; mAChR, 0.73; Table 5).
To examine the relationship between the amplitude of afferent input and the MC spike phase, we plotted the spike phases of individual MCs for comparison with one another in Figure 9E,F. As summarized in Figure 9C,D, MC spike phases were more strongly phase constrained during mAChR activation than under control conditions. Notably, however, the phase constraint imposed by muscarinic activation was strongest on those MCs receiving the highest levels of afferent excitation [e.g., the late-phase spikes (>60°) of MC12–MC14 were constrained to within 60° by mAChR activation]. Moreover, MCs with stronger afferent (odor) inputs evoked spikes at earlier phases of gamma, a phenomenon associated with the sparse coding of analog levels of activation (Fries et al., 2007; Panzeri et al., 2010) and proposed in models of both insect and vertebrate olfaction (Cleland and Linster, 2002; Linster and Cleland, 2010). The effect is observable as a V shape descending into the negative (earlier) phases for the most strongly activated MCs (MC13 ± 3); notably, this phenomenon was not particularly enhanced by muscarinic neuromodulation alone (Fig. 9E,F) but only by concerted cholinergic activation (see below). Note that MCs with weak odor inputs also could exhibit early spike phases based primarily on background activity, owing to the low amplitude of PGC inhibition.
Coactivation of nAChRs and mAChRs regulates both contrast enhancement and spike timing
Muscarinic modulation alone clearly promoted OB gamma oscillations and sharpened the phase constraint of MC spike times in the model but did not strengthen traditional contrast enhancement. As a result, despite this improved phase restriction of the MC population in aggregate, the spike phase profile of the odor representation under muscarinic activation alone (Fig. 9F) did not clearly sharpen or otherwise become more distinctive compared with the representation under control conditions (Fig. 9E). In contrast, nicotinic modulation applied to the full OB model evoked effects similar to those that it produced in the glomerular-layer model. Specifically, simulated nAChR activation effectively inhibited weakly tuned MCs (Fig. 10A, C), increasing the contrast enhancement index substantially over simulations performed under control conditions or muscarinic modulation (control, 2.55; mAChR activation, 2.78; nAChR activation, 12.13; Table 5), while affecting the average firing rate of the MC population very little (Table 4).
Figure 10.
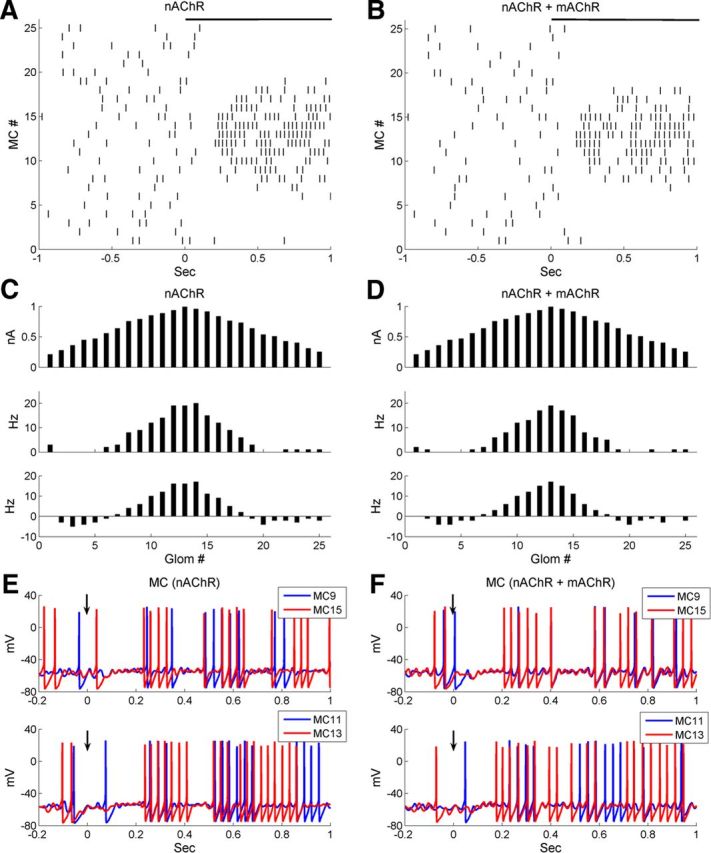
Coactivation of nicotinic and muscarinic cholinergic receptors in the full model both sharpens the MC representation and increases MC spike synchrony. A, Raster plot of MC spiking activity immediately before and after the onset of odor presentation, under nicotinic neuromodulation alone (nAChR). B, As in A, but with muscarinic neuromodulation active in addition to nicotinic neuromodulation (nAChR + mAChR). C, Histograms of activity in all 25 glomeruli under nicotinic neuromodulation alone, arranged according to their levels of afferent activation for ease of visualization. Top, Steady-state OSN input levels; middle, odor-evoked spike rates in MCs; bottom, odor-coding spike rates in MCs (see Materials and Methods). D, As in C, but with both nicotinic and muscarinic neuromodulation active. E, Current-clamp responses of two pairs of MCs under nicotinic neuromodulation alone. F, As in E, but with both nicotinic and muscarinic neuromodulation active.
In vivo, of course, the release of acetylcholine within olfactory bulb activates both nicotinic and muscarinic receptors in concert. Given their apparently complementary effects on neuronal circuit properties, we investigated their combined effects in the model. Full cholinergic activation (nAChR plus mAChR) synchronized MC spikes to a substantially greater extent than nicotinic activation alone (Fig. 10E,F), and indeed to a greater extent than under any other conditions including mAChR activation alone (STS index; Table 5). Full cholinergic activation also exerted a strong sharpening effect on the firing rate representation (Fig. 10B, D), exhibiting a substantially larger CE index than either nicotinic or muscarinic activation alone (Table 5). The average odor-evoked MC firing rate (5.4 ± 6.2 Hz) was similar to or slightly less than that under nicotinic modulation alone (6.3 ± 6.7 Hz), whereas the odor-evoked GC firing rate was somewhat higher (nAChR, 1.7 ± 1.1 Hz; nAChR plus mAChR, 4.0 ± 2.1 Hz). Overall, mAChR activation potentiated GC excitability with little impact on MC firing rates.
The sLFP oscillation under full cholinergic modulation was comparable with that under muscarinic modulation alone (Table 5) and substantially stronger and more robust than under nicotinic neuromodulation alone. This was demonstrated by the greater periodicity of the sLFP (Fig. 11, compare B, A, top and middle), a sharpening ∼30 Hz peak in the sLFP power spectrum (Fig. 11, compare B, A, bottom). Moreover, these enhanced oscillations were accompanied by more stringent phase-locking, as indicated by a heightened peak in the central bin (0–30°) of the spike phase distribution plot (Fig. 11, compare D, C). The effect of full cholinergic neuromodulation on the spike phases of individual MCs was similar to that under muscarinic modulation alone, with spikes increasingly phase restricted around 0°, the phase of minimum inhibition. MCs also clearly displayed a relationship between afferent activation level and spike phase; specifically, MCs receiving larger inputs (e.g., MC11–MC15) exhibited correspondingly phase-advanced spikes (Fig. 11F; note the clear V shape under the 0° phase line), to a stronger and clearer extent than under control conditions or nicotinic activation alone (compare to Figs. 9E, 11E). Compared with muscarinic activation alone, combined cholinergic neuromodulation exhibited improved spike synchronization as well as enormously improved contrast enhancement (Table 5). Overall, the effects of combined cholinergic neuromodulation were equal or superior to all other conditions (control, nicotinic alone, or muscarinic alone) in all of the measures studied herein, from contrast enhancement to oscillatory periodicity to spike phase regulation (Table 5). Combined cholinergic neuromodulation sharpens and clarifies noisy odorant representations and also helps transform the underlying mitral cell metric from spike rates into a phase precedence code that enables transmission of relative neuronal activation levels without the significant delays that are required to communicate aggregate spike rates.
Figure 11.

Coactivation of nicotinic and muscarinic receptors in the full model enhances coherent sLFP oscillations. A, Simulated LFP (top) during odor presentation, with autocorrelation (middle) and power spectrum (bottom), under nicotinic neuromodulation alone. B, As in A, but with both nicotinic and muscarinic neuromodulation active. C, Distribution of MC spike phases with respect to sLFP oscillations under nicotinic neuromodulation alone. D, As in C, but with both nicotinic and muscarinic neuromodulation active. E, Raster plot of MC spike phases with respect to sLFP oscillations, under nicotinic neuromodulation alone. F, As in E, but with both nicotinic and muscarinic neuromodulation active. Note that muscarinic activation narrows the distribution of spike phases. To compare responses to those under muscarinic neuromodulation alone, compare with Figure 9, B, D, and F.
Robustness of results
Simulations with different random seeds
As noted in Materials and Methods, all neurons in the model received randomly timed excitatory background inputs to ensure that simulation results were robust to noise. To ensure that timing-dependent simulation results did not depend on the spurious effects of these random inputs, we ran the simulation with 12 different random seeds (used to generate random background spike trains) and plotted each of our indices of network performance in Figure 12. Both the average MC firing rates and field oscillation frequencies remained consistent under cholinergic neuromodulation (Fig. 12A). The contrast enhancement index was significantly enhanced over baseline by nicotinic, but not muscarinic, activation (Fig. 12B), indicating that this traditional form of contrast enhancement was mediated primarily by glomerular-layer circuitry. Interestingly, muscarinic activation did generate (additional) contrast enhancement if nicotinic receptors also were activated. Specifically, the contrast enhancement indices generated with nicotinic modulation alone or with combined cholinergic modulation both were significantly higher than under control conditions (Welch's t test, two-tailed; p < 0.001 for both comparisons). Both indices also were higher than the index generated under muscarinic neuromodulation alone (p < 0.001 for both comparisons), which itself did not differ from control conditions (p > 0.05). Finally, the combined cholinergic modulation index was significantly higher than that of nicotinic modulation alone (p < 0.001; Fig. 12B). This pattern of muscarinic efficacy being dependent on simultaneous nicotinic activation directly reflects the interacting effects of these neuromodulators on the behavioral sharpening of nonassociative odor generalization gradients (Mandairon et al., 2006).
Figure 12.

Cholinergic effects averaged across 12 simulations with background inputs based on different randomization seeds. A, Mean MC firing rates and network oscillation frequencies. B, Mean CE index. C, Mean STS index. D, Mean spike phase-locking index. E, Mean amplitude of the power spectrum peak. F, Mean oscillation index. The phase-locking (D) and oscillation (F) indices are bounded between 0 and 1 (see Materials and Methods). Error bars denote the SD.
The average STS indices, phase-locking indices, power spectrum peak values, and oscillation indices are shown in Figure 12C–F, respectively. All four indices were significantly higher under combined cholinergic modulation or muscarinic modulation compared with control values (Welch's t test, two-tailed): combined cholinergic modulation, STS, p < 0.001; phase-locking index, p < 0.001; power spectrum peak, p < 0.02; oscillation index, p < 0.005; muscarinic modulation alone, STS, p < 0.001; phase-locking index, p < 0.001; power spectrum peak, p < 0.002; oscillation index, p < 0.005. In contrast, under nicotinic neuromodulation alone, the STS, phase-locking, and oscillation indices were statistically equal to those under control conditions (p > 0.05), whereas the power spectral peak was significantly lower than it was under control conditions (p < 0.01).
Effects of increased MC firing rates on cholinergic neuromodulatory efficacy
The odor-evoked firing rates of MCs differed greatly depending on the level of afferent OSN input received (Fig. 8E,F, Fig. 10C,D). On average, however, the model MC firing rates described above are consistent with those recorded in vivo in anesthetized rats [∼2–10 Hz (Cang and Isaacson, 2003)]. In waking states, however, MCs tend to fire at higher overall frequencies and exhibit faster gamma oscillation frequencies than in anesthetized or slice preparations [e.g., 10–20 Hz and still higher during brief epochs of odor stimulation (Rinberg et al., 2006)]. To test whether the model could adequately simulate awake/behaving OB dynamics, we altered model parameters to produce higher baseline average MC firing rates and sLFP oscillation frequencies and measured the effects of cholinergic neuromodulation under each of these conditions.
Since MC activities are tightly controlled by PGC inhibition, we first increased the average MC firing rate by reducing PGC→MC synaptic weights from 8 to 5 and also increased GC→MC synaptic weights from 1 to 2 to compensate for the disruptive effects on STO synchronization caused by the PGC→MC weight reduction (Brea et al., 2009). The resulting MC firing rate representations, sLFP oscillations, and raster plots of MC spike phases are depicted for each of the four neuromodulatory states investigated (control, nicotinic modulation alone, muscarinic modulation alone, and combined cholinergic modulation) in Figure 13A–D, respectively, whereas the average odor-evoked MC firing rates and sLFP oscillation frequencies are presented in Table 6. The reduction of PGC-mediated inhibition increased MC firing rates approximately twofold (compared with the default model) under all four neuromodulatory states, despite the increased GC-mediated inhibition (Table 6). These parameters also evoked higher oscillatory power in the sLFP compared with the default model (compare Figs. 13A2, 9A), because of higher MC firing rates and stronger GC inhibition.
Figure 13.

Cholinergic neuromodulation in the full model with lower PGC→MC synaptic weight and higher GC→MC synaptic weight. The PGC→MC synaptic weight was reduced from 8 to 5 and the GC→MC synaptic weight was increased from 1 to 2. A1, Histograms of activity in all 25 glomeruli under control conditions, arranged according to their levels of afferent activation for ease of visualization. Top, Steady-state OSN input levels; middle, odor-evoked spike rates in MCs; bottom, odor-coding spike rates in MCs (see Materials and Methods). A2, Simulated LFP (top) during odor presentation, with autocorrelation (middle) and power spectrum (bottom), under control conditions. A3, Raster plot of MC spike phases with respect to sLFP oscillations, under control conditions. B1–B3, As in A1–A3, but with nicotinic cholinergic neuromodulation active. C1–C3, As in A1–A3, but with muscarinic cholinergic neuromodulation active. D1–D3, As in A1–A3, but with both nicotinic and muscarinic cholinergic neuromodulation active.
Table 6.
Average odor-evoked MC firing rates (mean ± SD) and network oscillation frequencies in the default model, modified model 1, and modified model 2 under four different neuromodulatory states
| Control | nAChR | mAChR | nAChR + mAChR | |
|---|---|---|---|---|
| MC firing rate (Hz) | ||||
| Default model | 6.7 ± 4.9 | 6.3 ± 6.7 | 5.5 ± 4.5 | 5.4 ± 6.2 |
| Modified model 1 | 12.1 ± 9.4 | 11.8 ± 11.7 | 9.2 ± 8.9 | 9.4 ± 10.6 |
| Modified model 2 | 19.5 ± 10.7 | 17.8 ± 13.4 | 18.8 ± 10.5 | 16.5 ± 13.7 |
| Oscillation frequency (Hz) | ||||
| Default model | 33.0 | 30.0 | 30.5 | 31.1 |
| Modified model 1 | 33.0 | 31.7 | 32.4 | 33.0 |
| Modified model 2 | 37.9 | 40.9 | 41.5 | 40.9 |
In modified model 1, the PGC→MC synaptic weight was reduced from 8 to 5, and the GC→MC synaptic weight was increased from 1 to 2. Modified model 2 shares the parameters of modified model 1, except that the GABAA decay time constant of the GC→MC synapses was reduced from 18 ms to 3 ms.
This “awake/behaving”-parameterized model exhibited the same effects of nicotinic and muscarinic cholinergic modulation demonstrated by the default model. Nicotinic activation sharpened the firing rate representation by suppressing MCs on the periphery of the tuning curve (Fig. 13, compare B1, A1), while modestly degrading the power of sLFP oscillations (Fig. 13, compare B2, A2). Muscarinic activation enhanced sLFP oscillatory power, as evidenced by the extended periodicity in the autocorrelogram and a stronger gamma-frequency peak in the power spectrum (Fig. 13, compare C2, A2, B2). Although there was some sharpening effect in the firing rate representation compared with the control case (Fig. 13, compare C1, A1), the periphery was not suppressed as effectively as it was under nicotinic modulation, even with a twofold larger GC→MC synaptic weight. Combined activation of nAChRs and mAChRs, however, resulted in both a high degree of contrast enhancement (Fig. 13D1) and a strong sLFP oscillation (Fig. 13D2). Furthermore, muscarinic activation also sharpened spike timing representations (as it did in the default model), particularly when nicotinic receptors also were active (Fig. 13, compare C3, A3, and D3, B3).
In these simulations, while average MC firing rates increased twofold, the frequency of sLFP oscillations remained almost the same as in the default model (Table 6), demonstrating that the sLFP frequency is not tightly coupled to the mean MC firing rate. In some gamma-oscillogenic models (Traub et al., 1996; Wang and Buzsáki, 1996; Brunel and Wang, 2003), the frequency of field oscillations is tightly linked to the decay time constant of inhibitory (GABAergic) postsynaptic potentials. To assess whether this parameter would have a similar effect on the dynamics of the present model, we reduced the GABAA decay time constant of the GC→MC synapses from 18 ms to 3 ms [values are based on decay time constants reported in different studies (Davison et al. 2003; Schoppa, 2006; Brea et al. 2009)]. Figure 14 reports results from simulations incorporating a 3 ms decay time constant of GC→MC inhibition, in addition to the parameter changes depicted in the simulations of Figure 13. This reduction in the decay time constant increased sLFP oscillation frequencies by about 10 Hz (from ∼30 Hz to ∼40 Hz; Table 6) in the presence of either type of cholinergic activation. This suggests that the decay rate of inhibition is a key limiting factor in the frequency of OB gamma. The concomitant reduction in total inhibition of MCs produced by the reduced decay time constant also further increased MC firing rates, which now averaged about threefold those of the default model (Table 6). This demonstrates that EPL inhibition in aggregate is capable of affecting MC firing rates (Arevian et al., 2008), even if its primary effect in the absence of such dramatic manipulations is the more subtle regulation of MC spike timing. Moreover, further reducing the PGC→MC synaptic weight (below 5; data not shown) when the GC→MC decay time constant was fast (3 ms) further increased sLFP oscillation frequencies, indicating that the coupling of MC firing rates with sLFP oscillations depends, to some extent, on the duration of GC→MC postsynaptic potentials.
Figure 14.

Cholinergic neuromodulation in the full model with lower PGC→MC synaptic weight and higher GC→MC synaptic weight and smaller decay time constant of the GC→MC synapses. The PGC→MC synaptic weight was reduced from 8 to 5 and the GC→MC synaptic weight was increased from 1 to 2, plus the decay time constant of the GC→MC GABAA synapses reduced from 18 ms to 3 ms. A1, Histograms of activity in all 25 glomeruli under control conditions, arranged according to their levels of afferent activation for ease of visualization. Top, Steady-state OSN input levels; middle, odor-evoked spike rates in MCs; bottom, odor-coding spike rates in MCs (see Materials and Methods). A2, Simulated LFP (top) during odor presentation, with autocorrelation (middle) and power spectrum (bottom), under control conditions. A3, Raster plot of MC spike phases with respect to sLFP oscillations, under control conditions. B1–B3, As in A1–A3, but with nicotinic cholinergic neuromodulation active. C1–C3, As in A1–A3, but with muscarinic cholinergic neuromodulation active. D1–D3, As in A1–A3, but with both nicotinic and muscarinic cholinergic neuromodulation active.
As in the default and awake/behaving model parameterizations, nicotinic activation in this parameterization again sharpened the MC firing rate representation (Fig. 14, compare B1, A1), whereas muscarinic activation enhanced sLFP oscillatory power (Fig. 14, compare C2, A2, B2) and sharpened spike timing-based odor representations (Fig. 14, compare C3, A3, B3). Moreover, coactivation of nAChRs and mAChRs again produced potent contrast enhancement (Fig. 14D1), a strong sLFP gamma oscillation (Fig. 14D2), and a sharp spike timing representation (Fig. 14D3).
Effects of selectively increasing nicotinic efficacy on MCs
In the simulations described above, nicotinic cholinergic activation sharpens MC receptive fields mainly by enhancing PGC-mediated feedforward inhibition. As nicotinic receptors are present in both MCs and PGCs, the relative efficacy of nicotinic activation in these two cell types is likely to be important. If MCs were excited more strongly with respect to PGCs, for example, would MC receptive fields still be sharpened? To address this question, we increased the maximum density of the MC nicotinic conductance (gnic-MC) fivefold, from the default 1 mS/cm2 up to a maximum of 5 mS/cm2, while holding the nicotinic conductance density in PGCs constant in the glomerular model (Fig. 15).
Figure 15.

Nicotinic neuromodulation of the glomerular model with stronger excitation on MCs. The maximal conductance density of the nicotinic current inserted into the MC tuft was simulated at multiple fold of the original default value (1 mS/cm2), whereas that inserted into the PGC spine was held constant at the default value (15 mS/cm2). A, Histograms of activity in all 25 glomeruli under control conditions (no nicotinic activation), artificially arranged according to their levels of afferent activation for ease of visualization. Top, Steady-state OSN input levels; middle, odor-evoked spike rates in MCs; bottom, odor-coding spike rates in MCs (see Materials and Methods). A is identical to Figure 6A and reproduced here for ease of comparison. B, As in A, but with nicotinic cholinergic neuromodulation active; the nicotinic conductance density on MCs is 1 mS/cm2. B is identical to Figure 6B and reproduced here for ease of comparison. C, As in A, but with nicotinic cholinergic neuromodulation active; the nicotinic conductance density on MCs is 3 mS/cm2. D, As in A, but with nicotinic cholinergic neuromodulation active; the nicotinic conductance density on MCs is 5 mS/cm2. E, Average spontaneous and odor-evoked MC firing rates as a function of the maximal conductance density of the nicotinic current in MCs. F, Contrast enhancement (CE) index as a function of the maximal conductance density of the nicotinic current in MCs. The dashed horizontal line denotes the CE index in the control case.
Profiles of MC firing rates with no nicotinic activation, the default nicotinic conductance, and threefold and fivefold increases in MC nicotinic receptor density are shown in Figure 15A–D, respectively. The average spontaneous and odor-evoked MC firing rates are plotted in Figure 15E and the contrast enhancement index in Figure 15F, as functions of MC nicotinic receptor density. With a 3 mS/cm2 nicotinic conductance density, the MCs on the periphery of the active representation (i.e., those receiving the most effective surround inhibition; MC1–MC5, MC20–MC25) still were effectively inhibited, whereas the activities of MCs in the center of the representation still were enhanced (Fig. 15, compare C, middle, A, middle). Even with a nAChR density of 5 mS/cm2, the firing rates of peripheral MCs still were lower than in the control case (Fig. 15, compare D, A). Figure 15E shows that when gnic-MC increased from 0 to 5 mS/cm2, the MC spontaneous firing rate increased linearly owing to the added depolarizing current. In contrast, although the average odor-evoked firing rates also increased as gnic-MC increased, this increase was considerably shallower. Part of this effect is because, during spontaneous firing, the excitation induced by nAChRs inactivated the ICaT current in PGCs, reducing their spiking activity while maintaining a relatively polarized membrane potential that limited the efficacy of their graded inhibition of MCs (Fig. 5C–F). During odor presentation, the depolarized PGC membrane potential delivered much more effective inhibition onto MCs. Finally, the contrast enhancement index was largest at 0 mS/cm2, declining as gnic-MC increased (Fig. 15F). However, the decline was gradual, and the contrast enhancement index remained well above the control level even at the maximum MC nicotinic conductance density tested.
Because the surface area of the MC tuft is approximately 10 times larger than that of the PGC spine in the model, MC conductance densities exceeding 2 mS/cm2 reflect a circuit with stronger nicotinic-induced excitation on MCs than on PGCs. Thus, in these simulations, MC receptive fields were still sharpened by nicotinic activation even when the direct effect of nicotinic current on MCs was substantially greater than that on PGCs.
Discussion
Detailed, data-constrained models serve to embody and integrate existing working hypotheses, vetting them quantitatively and discovering the conditions under which their diverse underlying data sets are compatible. In this study, we use this approach to examine the OB circuit mechanisms that mediate the functional effects of acetylcholine. We show that nicotinic receptor activation, mediated by glomerular-layer microcircuitry, sharpens “traditional” MC chemoreceptive fields by regulating spike rates without substantially affecting fast time-scale oscillations or spike synchrony. The resulting decorrelation of olfactory representations is organized with respect to the overlap in odorants' physical similarities and operates by silencing moderately activated MCs that constitute the periphery of each representation via graded, PGC-mediated shunting inhibition. Indeed, feedforward intraglomerular inhibition via PGCs readily silences activated MCs (Gire and Schoppa, 2009) and can generate on-center/inhibitory surround contrast enhancement in a natural chemical similarity space of arbitrary dimensionality, thereby sharpening MC tuning curves (Cleland and Sethupathy, 2006; Cleland et al., 2007; Cleland, 2010; Cleland and Linster, 2012). Theories in which traditional contrast enhancement is mediated by EPL circuitry are inconsistent with this nicotinic neuromodulatory effect.
In contrast, these simulations indicate that muscarinic receptor activation, primary modulating the lateral inhibitory circuitry of the EPL, substantially enhances MC spike synchrony and the power of gamma-band field potential oscillations while only weakly affecting MC spike rates. The different metrics of action and functional topologies of these layers suggest that the OB effectively constitutes two coupled but quasi-independent processing layers. Notably, the simultaneous activation of nicotinic and muscarinic receptors, presumably the normal consequence of cholinergic release in vivo, sharpens both the slow timescale (MC firing rate) and fast timescale (MC spike timing) odor representations, thereby producing sharper odor tuning than either microcircuit alone could achieve. Based on these profiles of OB cholinergic mechanisms and functions, we propose the following general framework for interpreting neuronal activity in olfactory bulb.
First, the metric of information storage and transfer within neural circuitry must be considered separately from the information that it mediates. In the present model, for example, EPL processing has little effect on MC spike rates, while strongly regulating MC spike timing. We suggest that the spike rate metric that seems to mediate odor information in glomerular-layer computations gives way in this layer to a new metric based substantially on MC spike timing. The advantages of spike timing-based metrics are manifold (Fries et al., 2007; Panzeri et al., 2010), including but not limited to faster computation and the conservation of metabolic energy. Importantly, this conversion of the afferent activation profile from a rate-based to a timing-based metric is a separate issue from whether the information content of the representation is also altered in this layer.
In fact, unsurprisingly, EPL computations do mediate transformations in information content along with the metric conversion. Long-term odor memory within OB, for example, depends on durable transformations in EPL circuitry (Mandairon and Linster, 2009; Sultan et al., 2010), and synaptic weight changes in this layer have long been thought to regulate the pattern of lateral inhibition among mitral cells. Regardless of the topology or function of lateral inhibition in this layer, the metric illustrated in the present model indicates that these lateral inhibitory weights can influence the timing rather than the existence of MC spikes, with stronger inhibition effecting greater spike delays. This, of course, requires that downstream neurons be sensitive to spike timing, as is the case in some analogous insect systems (Stopfer et al., 1997; Friedrich and Stopfer, 2001; Linster and Cleland, 2001; Cleland and Linster, 2002; Finelli et al., 2008).
Second, the most parsimonious spike timing-based metric, given current knowledge, is an oscillation-dependent spike precedence code, also known as a phase code (Panzeri et al., 2010). The EPL simulations of the present model naturally evoke such a precedence code. The representation of MC activation levels via spike precedence emerges naturally out of the established dynamics of MCs and glomerular-layer circuitry (Desmaisons et al., 1999; Rubin and Cleland, 2006), as illustrated here. First, rapid feedforward shunt inhibition of MCs by PGCs results in the common phase-resetting of MC intrinsic subthreshold oscillations (e.g., by a sniff; Fig. 2E,F; Rubin and Cleland, 2006). The more strongly activated MCs will be the first to emerge from this inhibition and produce action potentials, whereas moderately activated MCs will produce spikes later, or not at all [this constitutes “surround” inhibition because marginal levels of afferent activity are selectively inhibited below baseline (Cleland and Sethupathy, 2006; Cleland and Linster, 2012)]. Notably, either the delay or the suppression of MC spikes can have the same functional effect within this framework. Second, synchronously activated GCs then deliver periodic recurrent and lateral inhibition onto MCs, thereby regulating MC spike synchronization over several gamma cycles. Phase-restricting action potentials with respect to a background of coherent oscillatory inhibition resolves a potential weakness of timing-based representations: without such an underlying “clock,” there is no clear way to distinguish a late spike generated by an event at time t from an early spike generated by an event at time t + ε. With periodic inhibition, at the cost of limiting the temporal resolution of signaling to the oscillatory period, the restriction of spikes to the lower-inhibition fraction of this oscillatory period reliably disambiguates early from late spikes. In OB, intrinsic gamma-band oscillations are dependent on EPL circuitry (Neville and Haberly, 2003; Lagier et al., 2004, 2007; Rojas-Líbano and Kay, 2008), and restrict the firing times of MC spikes (Kashiwadani et al., 1999; David et al., 2009). Hence, spike precedence information can be generated over multiple gamma cycles during a single odor presentation.
In addition to generating a common clock, MC–GC synaptic interactions are likely to be heterogeneous in their weights. Stronger inhibitory GC→MC synapses are likely to correspondingly delay spiking in those MCs (David et al., 2008; McTavish et al., 2012), weakening their output in terms of the precedence code metric and thereby sharpening the odor representation via spike timing just as it had previously been sharpened in the glomerular layer via spike suppression (Linster and Cleland, 2010). As illustrated in the present model, muscarinic activation in OB strengthens gamma oscillations and enhances the reliability of spike timing. In this way, the decorrelation of similar odor representations could be enhanced by muscarinic neuromodulation in the EPL within a spike timing metric just as it is by nicotinic modulation in the glomerular layer via a rate metric (though, as discussed below, this does not imply that the topologies of decorrelation in each layer are similar).
Third, EPL computations transform the underlying metric of the odor representation as well as modifying its information content. The present model illustrates how muscarinic cholinergic activation within OB increases the power of intrinsic gamma oscillations in OB as it does in hippocampus and cortex (Buhl et al., 1998; Fisahn et al., 1998; Rodriguez et al., 2004) and narrows the phase constraint of MC spikes with respect to these oscillations (as measured by the sLFP) by potentiating GC-mediated lateral inhibition. Moreover, muscarinic activation particularly constrains the more strongly activated MCs to fire earlier and more reliably, thereby improving the integrity of a precedence code. That is, under some current theories of spike timing-dependent decorrelation of neuronal representations (Linster and Cleland, 2010), muscarinic activation may enhance the decorrelation of similar odor representations in EPL just as nicotinic activation does in the glomerular layer, but with two key differences: (1) it operates with respect to a spike precedence code rather than a rate code metric, delaying spikes rather than suppressing them, and (2) the topology of the space within which EPL decorrelation acts is not the same as that of the glomerular layer (Fantana et al., 2008; Kim et al., 2011). That is, there is no reason that the pattern of functional lateral inhibitory weights should reflect the similarity of OSN receptive fields as measured within any one particular statistical odor environment. Rather, it has been hypothesized that decorrelation in this layer reflects olfactory learning, altering the behavioral discrimination of similar odorants based on individual experience (Cleland et al., 2009; Cleland, 2010).
These simulations also illustrate how nicotinic and muscarinic effects can synergize with one another, exerting complementary effects that seem to compensate for the other's weaknesses and produce a more robust effect than either subtype would evoke separately. For example, nicotinic neuromodulation increases contrast enhancement, but slightly reduces the efficacy of EPL inhibition. With low GC excitability (Cang and Isaacson, 2003; Pressler et al., 2007), multiple presynaptic MC spikes within a narrow time window are needed to evoke GC activity sufficient to effectively influence spike timing in follower MCs. With muscarinic coactivation, the increased synchrony among MC spikes renders them more effective at inducing substantive GC responses, and the increase in GC excitability sharpens the phase restriction of MC spikes while retaining the narrower activity profile generated by nicotinic neuromodulation. The coordinated activation of nicotinic and muscarinic receptors seems to best regulate the degree of sharpening of odor representations in both computational layers of the OB and with respect to both spike rate and spike timing metrics.
Footnotes
The authors declare no competing financial interests.
This work was supported by NIDCD Grants DC009948 and DC012249.
References
- Arevian AC, Kapoor V, Urban NN. Activity-dependent gating of lateral inhibition in the mouse olfactory bulb. Nat Neurosci. 2008;11:80–87. doi: 10.1038/nn2030. [DOI] [PMC free article] [PubMed] [Google Scholar]
- Aungst JL, Heyward PM, Puche AC, Karnup SV, Hayar A, Szabo G, Shipley MT. Centre-surround inhibition among olfactory bulb glomeruli. Nature. 2003;426:623–629. doi: 10.1038/nature02185. [DOI] [PubMed] [Google Scholar]
- Balu R, Larimer P, Strowbridge BW. Phasic stimuli evoke precisely timed spikes in intermittently discharging mitral cells. J Neurophysiol. 2004;92:743–753. doi: 10.1152/jn.00016.2004. [DOI] [PubMed] [Google Scholar]
- Barkai E, Hasselmo ME. Modulation of the input/output function of rat piriform cortex pyramidal cells. J Neurophysiol. 1994;72:644–658. doi: 10.1152/jn.1994.72.2.644. [DOI] [PubMed] [Google Scholar]
- Bathellier B, Lagier S, Faure P, Lledo PM. Circuit properties generating gamma oscillations in a network model of the olfactory bulb. J Neurophysiol. 2006;95:2678–2691. doi: 10.1152/jn.01141.2005. [DOI] [PubMed] [Google Scholar]
- Bhalla US, Bower JM. Exploring parameter space in detailed single neuron models: simulations of the mitral and granule cells of the olfactory bulb. J Neurophysiol. 1993;69:1948–1965. doi: 10.1152/jn.1993.69.6.1948. [DOI] [PubMed] [Google Scholar]
- Brea JN, Kay LM, Kopell NJ. Biophysical model for gamma rhythms in the olfactory bulb via subthreshold oscillations. Proc Natl Acad Sci U S A. 2009;106:21954–21959. doi: 10.1073/pnas.0910964106. [DOI] [PMC free article] [PubMed] [Google Scholar]
- Brunel N, Wang XJ. What determines the frequency of fast network oscillations with irregular neural discharges? I. Synaptic dynamics and excitation-inhibition balance. J Neurophysiol. 2003;90:415–430. doi: 10.1152/jn.01095.2002. [DOI] [PubMed] [Google Scholar]
- Buhl EH, Tamás G, Fisahn A. Cholinergic activation and tonic excitation induce persistent gamma oscillations in mouse somatosensory cortex in vitro. J Physiol. 1998;513:117–126. doi: 10.1111/j.1469-7793.1998.117by.x. [DOI] [PMC free article] [PubMed] [Google Scholar]
- Cadetti L, Belluzzi O. Hyperpolarisation-activated current in glomerular cells of the rat olfactory bulb. Neuroreport. 2001;12:3117–3120. doi: 10.1097/00001756-200110080-00027. [DOI] [PubMed] [Google Scholar]
- Cang J, Isaacson JS. In vivo whole-cell recording of odor-evoked synaptic transmission in the rat olfactory bulb. J Neurosci. 2003;23:4108–4116. doi: 10.1523/JNEUROSCI.23-10-04108.2003. [DOI] [PMC free article] [PubMed] [Google Scholar]
- Carnevale NT, Hines ML. The neuron book. Cambridge, UK: Cambridge UP; 2006. [Google Scholar]
- Castillo PE, Carleton A, Vincent JD, Lledo PM. Multiple and opposing roles of cholinergic transmission in the main olfactory bulb. J Neurosci. 1999;19:9180–9191. doi: 10.1523/JNEUROSCI.19-21-09180.1999. [DOI] [PMC free article] [PubMed] [Google Scholar]
- Chaudhury D, Escanilla O, Linster C. Bulbar acetylcholine enhances neural and perceptual odor discrimination. J Neurosci. 2009;29:52–60. doi: 10.1523/JNEUROSCI.4036-08.2009. [DOI] [PMC free article] [PubMed] [Google Scholar]
- Chen WR, Shepherd GM. Membrane and synaptic properties of mitral cells in slices of rat olfactory bulb. Brain Res. 1997;745:189–196. doi: 10.1016/s0006-8993(96)01150-x. [DOI] [PubMed] [Google Scholar]
- Cleland TA. Early transformations in odor representation. Trends Neurosci. 2010;33:130–139. doi: 10.1016/j.tins.2009.12.004. [DOI] [PMC free article] [PubMed] [Google Scholar]
- Cleland TA, Linster C. How synchronization properties among second-order sensory neurons can mediate stimulus salience. Behav Neurosci. 2002;116:212–221. doi: 10.1037//0735-7044.116.2.212. [DOI] [PubMed] [Google Scholar]
- Cleland TA, Linster C. On-center/inhibitory-surround decorrelation via intraglomerular inhibition in the olfactory bulb glomerular layer. Front Integr Neurosci. 2012;6:5. doi: 10.3389/fnint.2012.00005. [DOI] [PMC free article] [PubMed] [Google Scholar]
- Cleland TA, Sethupathy P. Non-topographical contrast enhancement in the olfactory bulb. BMC Neurosci. 2006;7:7. doi: 10.1186/1471-2202-7-7. [DOI] [PMC free article] [PubMed] [Google Scholar]
- Cleland TA, Johnson BA, Leon M, Linster C. Relational representation in the olfactory system. Proc Natl Acad Sci U S A. 2007;104:1953–1958. doi: 10.1073/pnas.0608564104. [DOI] [PMC free article] [PubMed] [Google Scholar]
- Cleland TA, Narla VA, Boudadi K. Multiple learning parameters differentially regulate olfactory generalization. Behav Neurosci. 2009;123:26–35. doi: 10.1037/a0013991. [DOI] [PMC free article] [PubMed] [Google Scholar]
- David F, Linster C, Cleland TA. Lateral dendritic shunt inhibition can regularize mitral cell spike patterning. J Comp Neurosci. 2008;25:25–38. doi: 10.1007/s10827-007-0063-5. [DOI] [PubMed] [Google Scholar]
- David FO, Hugues E, Cenier T, Fourcaud-Trocmé N, Buonviso N. Specific entrainment of mitral cells during gamma oscillation in the rat olfactory bulb. PLoS Comp Biol. 2009;5:e1000551. doi: 10.1371/journal.pcbi.1000551. [DOI] [PMC free article] [PubMed] [Google Scholar]
- Davison AP, Feng J, Brown D. A reduced compartmental model of the mitral cell for use in network models of the olfactory bulb. Brain Res Bull. 2000;51:393–399. doi: 10.1016/s0361-9230(99)00256-7. [DOI] [PubMed] [Google Scholar]
- Davison AP, Feng J, Brown D. Dendrodendritic inhibition and simulated odor responses in a detailed olfactory bulb network model. J Neurophysiol. 2003;90:1921–1935. doi: 10.1152/jn.00623.2002. [DOI] [PubMed] [Google Scholar]
- Desmaisons D, Vincent JD, Lledo PM. Control of action potential timing by intrinsic subthreshold oscillations in olfactory bulb output neurons. J Neurosci. 1999;19:10727–10737. doi: 10.1523/JNEUROSCI.19-24-10727.1999. [DOI] [PMC free article] [PubMed] [Google Scholar]
- Doty RL, Bagla R, Kim N. Physostigmine enhances performance on an odor mixture discrimination test. Physiol Behav. 1999;65:801–804. doi: 10.1016/s0031-9384(98)00238-8. [DOI] [PubMed] [Google Scholar]
- D'Souza RD, Vijayaraghavan S. Nicotinic receptor-mediated filtering of mitral cell responses to olfactory nerve inputs involves the 3 4 subtype. J Neurosci. 2012;32:3261–3266. doi: 10.1523/JNEUROSCI.5024-11.2012. [DOI] [PMC free article] [PubMed] [Google Scholar]
- Durand M, Coronas V, Jourdan F, Quirion R. Developmental and aging aspects of the cholinergic innervation of the olfactory bulb. Int J Dev Neurosci. 1998;16:777–785. doi: 10.1016/s0736-5748(98)00087-2. [DOI] [PubMed] [Google Scholar]
- Fantana AL, Soucy ER, Meister M. Rat olfactory bulb mitral cells receive sparse glomerular inputs. Neuron. 2008;59:802–814. doi: 10.1016/j.neuron.2008.07.039. [DOI] [PubMed] [Google Scholar]
- Finelli LA, Haney S, Bazhenov M, Stopfer M, Sejnowski TJ. Synaptic learning rules and sparse coding in a model sensory system. PLoS Comp Biol. 2008;4:e1000062. doi: 10.1371/journal.pcbi.1000062. [DOI] [PMC free article] [PubMed] [Google Scholar]
- Fisahn A, Pike FG, Buhl EH, Paulsen O. Cholinergic induction of network oscillations at 40 Hz in the hippocampus in vitro. Nature. 1998;394:186–189. doi: 10.1038/28179. [DOI] [PubMed] [Google Scholar]
- Friedrich RW, Stopfer M. Recent dynamics in olfactory population coding. Curr Opin Neurobiol. 2001;11:468–474. doi: 10.1016/s0959-4388(00)00236-1. [DOI] [PubMed] [Google Scholar]
- Fries P, Nikolić D, Singer W. The gamma cycle. Trends Neurosci. 2007;30:309–316. doi: 10.1016/j.tins.2007.05.005. [DOI] [PubMed] [Google Scholar]
- Ghatpande AS, Gelperin A. Presynaptic muscarinic receptors enhance glutamate release at the mitral/tufted to granule cell dendrodendritic synapse in the rat main olfactory bulb. J Neurophysiol. 2009;101:2052–2061. doi: 10.1152/jn.90734.2008. [DOI] [PubMed] [Google Scholar]
- Gire DH, Schoppa NE. Control of on/off glomerular signaling by a local GABAergic microcircuit in the olfactory bulb. Soc Neurosci Abstr. 2009;29:13454–13464. doi: 10.1523/JNEUROSCI.2368-09.2009. [DOI] [PMC free article] [PubMed] [Google Scholar]
- Gschwend O, Beroud J, Carleton A. Encoding odorant identity by spiking packets of rate-invariant neurons in awake mice. PLoS One. 2012;7:e30155. doi: 10.1371/journal.pone.0030155. [DOI] [PMC free article] [PubMed] [Google Scholar]
- Hall BJ, Delaney KR. Contribution of a calcium-activated non-specific conductance to NMDA receptor-mediated synaptic potentials in granule cells of the frog olfactory bulb. J Physiol. 2002;543:819–834. doi: 10.1113/jphysiol.2002.024638. [DOI] [PMC free article] [PubMed] [Google Scholar]
- Hodgkin AL, Huxley AF. A quantitative description of membrane current and its application to conduction and excitation in nerve. J Physiol. 1952;117:500–544. doi: 10.1113/jphysiol.1952.sp004764. [DOI] [PMC free article] [PubMed] [Google Scholar]
- Inoue T, Strowbridge BW. Transient activity induces a long-lasting increase in the excitability of olfactory bulb interneurons. J Neurophysiol. 2008;99:187–199. doi: 10.1152/jn.00526.2007. [DOI] [PMC free article] [PubMed] [Google Scholar]
- Isaacson JS, Strowbridge BW. Olfactory reciprocal synapses: dendritic signaling in the CNS. Neuron. 1998;20:749–761. doi: 10.1016/s0896-6273(00)81013-2. [DOI] [PubMed] [Google Scholar]
- Jahr CE, Nicoll RA. Dendrodendritic inhibition: demonstration with intracellular recording. Science. 1980;207:1473–1475. doi: 10.1126/science.7361098. [DOI] [PubMed] [Google Scholar]
- Kashiwadani H, Sasaki YF, Uchida N, Mori K. Synchronized oscillatory discharges of mitral/tufted cells with different molecular receptive ranges in the rabbit olfactory bulb. J Neurophysiol. 1999;82:1786–1792. doi: 10.1152/jn.1999.82.4.1786. [DOI] [PubMed] [Google Scholar]
- Kim DH, Phillips ME, Chang AY, Patel HK, Nguyen KT, Willhite DC. Lateral connectivity in the olfactory bulb is sparse and segregated. Front Neural Circuits. 2011;5:5. doi: 10.3389/fncir.2011.00005. [DOI] [PMC free article] [PubMed] [Google Scholar]
- Kosaka K, Kosaka T. Synaptic organization of the glomerulus in the main olfactory bulb: compartments of the glomerulus and heterogeneity of the periglomerular cells. Anat Sci Int. 2005;80:80–90. doi: 10.1111/j.1447-073x.2005.00092.x. [DOI] [PubMed] [Google Scholar]
- Lagier S, Carleton A, Lledo PM. Interplay between local GABAergic interneurons and relay neurons generates gamma oscillations in the rat olfactory bulb. J Neurosci. 2004;24:4382–4392. doi: 10.1523/JNEUROSCI.5570-03.2004. [DOI] [PMC free article] [PubMed] [Google Scholar]
- Lagier S, Panzanelli P, Russo RE, Nissant A, Bathellier B, Sassoè-Pognetto M, Fritschy JM, Lledo PM. GABAergic inhibition at dendrodendritic synapses tunes gamma oscillations in the olfactory bulb. Proc Natl Acad Sci U S A. 2007;104:7259–7264. doi: 10.1073/pnas.0701846104. [DOI] [PMC free article] [PubMed] [Google Scholar]
- Le Jeune H, Aubert I, Jourdan F, Quirion R. Comparative laminar distribution of various autoradiographic cholinergic markers in adult main olfactory bulb. J Chem Neuroanat. 1995;9:99–112. doi: 10.1016/0891-0618(95)00070-n. [DOI] [PubMed] [Google Scholar]
- Linster C, Cleland TA. How spike synchronization among olfactory neurons can contribute to sensory discrimination. J Comp Neurosci. 2001;10:187–193. doi: 10.1023/a:1011221131212. [DOI] [PubMed] [Google Scholar]
- Linster C, Cleland TA. Decorrelation of odor representations via spike timing-dependent plasticity. Front Comp Neurosci. 2010;4:157. doi: 10.3389/fncom.2010.00157. [DOI] [PMC free article] [PubMed] [Google Scholar]
- Linster C, Garcia PA, Hasselmo ME, Baxter MG. Selective loss of cholinergic neurons projecting to the olfactory system increases perceptual generalization between similar, but not dissimilar, odorants. Behav Neurosci. 2001;115:826–833. doi: 10.1037//0735-7044.115.4.826. [DOI] [PubMed] [Google Scholar]
- Luo M, Katz LC. Response correlation maps of neurons in the mammalian olfactory bulb. Neuron. 2001;32:1165–1179. doi: 10.1016/s0896-6273(01)00537-2. [DOI] [PubMed] [Google Scholar]
- Ma M, Luo M. Optogenetic activation of basal forebrain cholinergic neurons modulates neuronal excitability and sensory responses in the main olfactory bulb. J Neurosci. 2012;32:10105–10116. doi: 10.1523/JNEUROSCI.0058-12.2012. [DOI] [PMC free article] [PubMed] [Google Scholar]
- Macrides F, Davis BJ, Youngs WM, Nadi NS, Margolis FL. Cholinergic and catecholaminergic afferents to the olfactory bulb in the hamster: a neuroanatomical, biochemical, and histochemical investigation. J Comp Neurol. 1981;203:495–514. doi: 10.1002/cne.902030311. [DOI] [PubMed] [Google Scholar]
- Madison DV, Lancaster B, Nicoll RA. Voltage clamp analysis of cholinergic action in the hippocampus. J Neurosci. 1987;7:733–741. doi: 10.1523/JNEUROSCI.07-03-00733.1987. [DOI] [PMC free article] [PubMed] [Google Scholar]
- Mandairon N, Linster C. Odor perception and olfactory bulb plasticity in adult mammals. J Neurophysiol. 2009;101:2204–2209. doi: 10.1152/jn.00076.2009. [DOI] [PubMed] [Google Scholar]
- Mandairon N, Ferretti CJ, Stack CM, Rubin DB, Cleland TA, Linster C. Cholinergic modulation in the olfactory bulb influences spontaneous olfactory discrimination in adult rats. Eur J Neurosci. 2006;24:3234–3244. doi: 10.1111/j.1460-9568.2006.05212.x. [DOI] [PubMed] [Google Scholar]
- Mandairon N, Peace ST, Boudadi K, Boxhorn CE, Narla VA, Suffis SD, Cleland TA. Compensatory responses to age-related decline in odor quality acuity: cholinergic neuromodulation and olfactory enrichment. Neurobiol Aging. 2011;32:2254–2265. doi: 10.1016/j.neurobiolaging.2009.12.024. [DOI] [PMC free article] [PubMed] [Google Scholar]
- McQuiston AR, Katz LC. Electrophysiology of interneurons in the glomerular layer of the rat olfactory bulb. J Neurophysiol. 2001;86:1899–1907. doi: 10.1152/jn.2001.86.4.1899. [DOI] [PubMed] [Google Scholar]
- McTavish TS, Migliore M, Shepherd GM, Hines ML. Mitral cell spike synchrony modulated by dendrodendritic synapse location. Front Comp Neurosci. 2012;6:3. doi: 10.3389/fncom.2012.00003. [DOI] [PMC free article] [PubMed] [Google Scholar]
- Migliore M, Shepherd GM. Dendritic action potentials connect distributed dendrodendritic microcircuits. J Comp Neurosci. 2008;24:207–221. doi: 10.1007/s10827-007-0051-9. [DOI] [PMC free article] [PubMed] [Google Scholar]
- Migliore M, Hines ML, Shepherd GM. The role of distal dendritic gap junctions in synchronization of mitral cell axonal output. J Comp Neurosci. 2005;18:151–161. doi: 10.1007/s10827-005-6556-1. [DOI] [PubMed] [Google Scholar]
- Neville KR, Haberly LB. Beta and gamma oscillations in the olfactory system of the urethane-anesthetized rat. J Neurophysiol. 2003;90:3921–3930. doi: 10.1152/jn.00475.2003. [DOI] [PubMed] [Google Scholar]
- Panhuber H, Laing DG, Willcox ME, Eagleson GK, Pittman EA. The distribution of the size and number of mitral cells in the olfactory bulb of the rat. J Anat. 1985;140:297–308. [PMC free article] [PubMed] [Google Scholar]
- Panzeri S, Brunel N, Logothetis NK, Kayser C. Sensory neural codes using multiplexed temporal scales. Trends Neurosci. 2010;33:111–120. doi: 10.1016/j.tins.2009.12.001. [DOI] [PubMed] [Google Scholar]
- Pinato G, Midtgaard J. Regulation of granule cell excitability by a low-threshold calcium spike in turtle olfactory bulb. J Neurophysiol. 2003;90:3341–3351. doi: 10.1152/jn.00560.2003. [DOI] [PubMed] [Google Scholar]
- Pressler RT, Inoue T, Strowbridge BW. Muscarinic receptor activation modulates granule cell excitability and potentiates inhibition onto mitral cells in the rat olfactory bulb. J Neurosci. 2007;27:10969–10981. doi: 10.1523/JNEUROSCI.2961-07.2007. [DOI] [PMC free article] [PubMed] [Google Scholar]
- Rall W, Shepherd GM, Reese TS, Brightman MW. Dendrodendritic synaptic pathway for inhibition in the olfactory bulb. Exp Neurol. 1966;14:44–56. doi: 10.1016/0014-4886(66)90023-9. [DOI] [PubMed] [Google Scholar]
- Rinberg D, Koulakov A, Gelperin A. Sparse odor coding in awake behaving mice. J Neurosci. 2006;26:8857–8865. doi: 10.1523/JNEUROSCI.0884-06.2006. [DOI] [PMC free article] [PubMed] [Google Scholar]
- Rodriguez R, Kallenbach U, Singer W, Munk MH. Short- and long-term effects of cholinergic modulation on gamma oscillations and response synchronization in the visual cortex. J Neurosci. 2004;24:10369–10378. doi: 10.1523/JNEUROSCI.1839-04.2004. [DOI] [PMC free article] [PubMed] [Google Scholar]
- Rojas-Líbano D, Kay LM. Olfactory system gamma oscillations: the physiological dissection of a cognitive neural system. Cognit Neurodynam. 2008;2:179–194. doi: 10.1007/s11571-008-9053-1. [DOI] [PMC free article] [PubMed] [Google Scholar]
- Roman FS, Simonetto I, Soumireu-Mourat B. Learning and memory of odor-reward association: selective impairment following horizontal diagonal band lesions. Behav Neurosci. 1993;107:72–81. doi: 10.1037//0735-7044.107.1.72. [DOI] [PubMed] [Google Scholar]
- Rubin DB, Cleland TA. Dynamical mechanisms of odor processing in olfactory bulb mitral cells. J Neurophysiol. 2006;96:555–568. doi: 10.1152/jn.00264.2006. [DOI] [PubMed] [Google Scholar]
- Schoppa NE. Synchronization of olfactory bulb mitral cells by precisely timed inhibitory inputs. Neuron. 2006;49:271–283. doi: 10.1016/j.neuron.2005.11.038. [DOI] [PubMed] [Google Scholar]
- Schoppa NE, Westbrook GL. Regulation of synaptic timing in the olfactory bulb by an A-type potassium current. Nat Neurosci. 1999;2:1106–1113. doi: 10.1038/16033. [DOI] [PubMed] [Google Scholar]
- Shao Z, Puche AC, Kiyokage E, Szabo G, Shipley MT. Two GABAergic intraglomerular circuits differentially regulate tonic and phasic presynaptic inhibition of olfactory nerve terminals. J Neurophysiol. 2009;101:1988–2001. doi: 10.1152/jn.91116.2008. [DOI] [PMC free article] [PubMed] [Google Scholar]
- Shen GY, Chen WR, Midtgaard J, Shepherd GM, Hines ML. Computational analysis of action potential initiation in mitral cell soma and dendrites based on dual patch recordings. J Neurophysiol. 1999;82:3006–3020. doi: 10.1152/jn.1999.82.6.3006. [DOI] [PubMed] [Google Scholar]
- Shepherd GM, Wei RC, Greer CA. Olfactory bulb. In: Shepherd GM, editor. The synaptic organization of the brain. New York: Oxford UP; 2004. pp. 165–216. [Google Scholar]
- Smith RS, Araneda RC. Cholinergic modulation of neuronal excitability in the accessory olfactory bulb. J Neurophysiol. 2010;104:2963–2974. doi: 10.1152/jn.00446.2010. [DOI] [PMC free article] [PubMed] [Google Scholar]
- Stopfer M, Bhagavan S, Smith BH, Laurent G. Impaired odour discrimination on desynchronization of odour-encoding neural assemblies. Nature. 1997;390:70–74. doi: 10.1038/36335. [DOI] [PubMed] [Google Scholar]
- Sultan S, Mandairon N, Kermen F, Garcia S, Sacquet J, Didier A. Learning-dependent neurogenesis in the olfactory bulb determines long-term olfactory memory. FASEB J. 2010;24:2355–2363. doi: 10.1096/fj.09-151456. [DOI] [PubMed] [Google Scholar]
- Takahashi Y, Kaba H. Muscarinic receptor type 1 (M1) stimulation, probably through KCNQ/Kv7 channel closure, increases spontaneous GABA release at the dendrodendritic synapse in the mouse accessory olfactory bulb. Brain Res. 2010;1339:26–40. doi: 10.1016/j.brainres.2010.03.104. [DOI] [PubMed] [Google Scholar]
- Traub RD, Whittington MA, Colling SB, Buzsáki G, Jeffreys JG. Analysis of gamma rhythms in the rat hippocampus in vitro and in vivo. J Physiol. 1996;493:471–484. doi: 10.1113/jphysiol.1996.sp021397. [DOI] [PMC free article] [PubMed] [Google Scholar]
- Wang XJ. Ionic basis for intrinsic 40 Hz neuronal oscillations. Neuroreport. 1993;5:221–224. doi: 10.1097/00001756-199312000-00008. [DOI] [PubMed] [Google Scholar]
- Wang XJ. Fast burst firing and short-term synaptic plasticity: a model of neocortical chattering neurons. Neuroscience. 1999;89:347–362. doi: 10.1016/s0306-4522(98)00315-7. [DOI] [PubMed] [Google Scholar]
- Wang XJ, Buzsáki G. Gamma oscillation by synaptic inhibition in a hippocampal interneuronal network model. J Neurosci. 1996;16:6402–6413. doi: 10.1523/JNEUROSCI.16-20-06402.1996. [DOI] [PMC free article] [PubMed] [Google Scholar]
- Wang XY, McKenzie JS, Kemm RE. Whole-cell K+ currents in identified olfactory bulb output neurones of rats. J Physiol. 1996;490:63–77. doi: 10.1113/jphysiol.1996.sp021127. [DOI] [PMC free article] [PubMed] [Google Scholar]
- Wellis DP, Scott JW. Intracellular responses of identified rat olfactory bulb interneurons to electrical and odor stimulation. J Neurophysiol. 1990;64:932–947. doi: 10.1152/jn.1990.64.3.932. [DOI] [PubMed] [Google Scholar]
- Wellis DP, Kauer JS. GABAergic and glutamatergic synaptic input to identified granule cells in salamander olfactory bulb. J Physiol. 1994;475:419–430. doi: 10.1113/jphysiol.1994.sp020082. [DOI] [PMC free article] [PubMed] [Google Scholar]
- Wilson DA, Fletcher ML, Sullivan RM. Acetylcholine and olfactory perceptual learning. Learn Mem. 2004;11:28–34. doi: 10.1101/lm.66404. [DOI] [PMC free article] [PubMed] [Google Scholar]
- Yokoi M, Mori K, Nakanishi S. Refinement of odor molecule tuning by dendrodendritic synaptic inhibition in the olfactory bulb. Proc Natl Acad Sci U S A. 1995;92:3371–3375. doi: 10.1073/pnas.92.8.3371. [DOI] [PMC free article] [PubMed] [Google Scholar]
- Záborszky L, Carlsen J, Brashear HR, Heimer L. Cholinergic and GABAergic afferents to the olfactory bulb in the rat with special emphasis on the projection neurons in the nucleus of the horizontal limb of the diagonal band. J Comp Neurol. 1986;243:488–509. doi: 10.1002/cne.902430405. [DOI] [PubMed] [Google Scholar]
- Zador A, Koch C, Brown TH. Biophysical model of a Hebbian synapse. Proc Natl Acad Sci U S A. 1990;87:6718–6722. doi: 10.1073/pnas.87.17.6718. [DOI] [PMC free article] [PubMed] [Google Scholar]