

Abstract
Mammalian target of rapamycin (mTOR) hyperactivity in perinatal neural progenitor cells (NPCs) of tuberous sclerosis complex 1 (Tsc1) heterozygote mice leads to heterotopia and abnormal neuronal morphogenesis as seen in patients with tuberous sclerosis. Considering that pathological hyperactive mTOR also occurs in individuals carrying no genetic mutations, we examined whether increasing mTOR activity in neonatal NPCs of wild-type mice would recapitulate the above phenotypes. Electroporation of a plasmid encoding constitutively active Ras-homolog enriched in brain (RhebCA) into subventricular zone NPCs increased mTOR activity in newborn cells. At 19 d post-electroporation (dpe), heterotopia and ectopic cells with a neuronal morphology were observed along the migratory path [rostral migratory stream (RMS)] and in the olfactory bulb (OB). These ectopic cells displayed action potentials and received synaptic inputs identifying them as synaptically integrated neurons. RMS heterotopias contained astrocytes, neurons, and entrapped neuroblasts. Immunostaining at 3 dpe revealed the presence of Mash1+ Olig2− cells in the migratory route accompanied by ectopic neuronal differentiation and altered direction and speed of neuroblast migration at 7 dpe, suggesting a non-cell-autonomous disruption of migration. At >19 dpe, newborn RhebCA-expressing neurons displayed altered distribution and formed micronodules in the OB. In addition, they displayed increased dendritic complexity along with altered membrane biophysics and increased frequency of GABAergic synaptic inputs. OB heterotopia, micronodules, and dendrite hypertrophy were notably prevented by rapamycin treatment, suggesting their mTOR dependence. Collectively, these data show that increasing mTOR activity in neonatal NPCs of wild-type mice recapitulate the pathologies observed in Tsc1 mutant mice. In addition, increased mTOR activity in individuals without known mutations could significantly impact neurogenesis and circuit formation.
Introduction
The mammalian target of rapamycin (mTOR) is a serine/threonine kinase acting in two distinct protein complexes: mTOR complex 1 (mTORC1) and mTORC2. mTORC1 (referred to as mTOR) integrates information from many extracellular and intracellular signals (e.g., Ras–ERK and phosphatidylinositol 3-kinase–Akt) that converge on the immediate upstream mTOR regulators: TSC1/TSC2 complex and Ras-homolog enriched in brain (Rheb). TSC1/2 negatively regulates Rheb, which directly activates mTOR. mTOR is thus a central hub and is considered a master regulator of cell growth and plasticity through regulation of protein translation (Kwiatkowski and Manning, 2005). As a result, mTOR is implicated in many functions in the adult nervous system, and a proper level of mTOR activity is critical for brain development (Swiech et al., 2008; Hoeffer and Klann, 2010).
Increases in mTOR activity has been reported in several neurodevelopmental disorders, including fragile X syndrome (Hoeffer et al., 2012), Cowden syndrome [phosphatase and tensin homolog (PTEN) mutation] (Endersby and Baker, 2008), autism (Bourgeron, 2009), and the classical mTOR disorder tuberous sclerosis complex (TSC) (Crino et al., 2006). TSC patients are born with a TSC1 or TSC2 mutant allele, and an additional increase in mTOR activity in developing cells is thought to lead to severe brain malformations as supported by findings in transgenic mice (Mizuguchi and Takashima, 2001; Meikle et al., 2007; Way et al., 2009; Feliciano et al., 2011, 2012; Goto et al., 2011; Magri et al., 2011; Zeng et al., 2011). Although these studies used mice with a Tsc1/2-mutant background, mTOR activity can also be increased through several pathological mechanisms (e.g., viral infections) in otherwise normal individuals (Walsh and Mohr, 2004; Inoki et al., 2005; Moody et al., 2005; Moorman et al., 2008; Zoncu et al., 2011). We thus investigated whether a focal increase in mTOR activity in wild-type animals is sufficient to generate malformations and alter neuronal development and circuit formation as shown in the case of TSC.
To address this issue, we increased mTOR activity in neonatal neural progenitor cells (NPCs) of the subventricular zone (SVZ) by electroporating a vector encoding constitutively active Rheb (RhebCA) (Levison and Goldman, 1993; Lacar et al., 2010; Pathania et al., 2010). The RhebCA-encoding vector has been used as a reliable tool to increase mTOR activity in different cell types (Maehama et al., 2008; Nie et al., 2010; Magri et al., 2011). We explored whether this manipulation recapitulated the hyperactive mTOR-induced defects reported in Tsc1-mutant mice occurring during neonatal neurogenesis; these defects included migratory heterotopia, ectopic neuron placement, neuronal hypertrophy, and olfactory bulb (OB) micronodules (Feliciano et al., 2012). We found that RhebCA expression in NPCs of wild-type mice recapitulated the above defects. Using immunostaining and migration assays, we identified a sequence of cell development within the heterotopia suggesting premature neuronal differentiation and non-cell-autonomous effects on neuroblast migration. We also found that ectopic neurons were functional and synaptically integrated. Finally, the mTOR blocker rapamycin, which is undergoing clinical trials in TSC patients, prevented the OB heterotopia and circuit abnormalities. Collectively, these findings underscore the impact of pathological mTOR hyperactivity during perinatal development in individuals without mutations.
Materials and Methods
Mice and genotyping.
Animal protocols were approved by the Yale University Institutional Animal Care and Use Committee. Experiments were performed on wild-type CD1 mice (Charles River) of either gender.
Neonatal electroporation and vectors.
Electroporation is as we described previously (Lacar et al., 2010; Platel et al., 2010). Plasmids (1–1.5 μg/μl) were diluted in PBS containing 0.1% fast green as a tracer; 0.5–1 μl of plasmid solution was injected into the lateral ventricles of cold-anesthetized neonatal pups using a pulled glass pipette (diameter, <50 μm). Three square pulses of 50 ms duration with 950 ms intervals at 130 V were applied using a pulse ECM830 BTX generator and tweezer-type electrodes (model 520; BTX) placed on the heads of postnatal day 0 (P0) to P1 pups. The following plasmids were used: pCAG–RhebCA (0.5, 0.7, or 1 μg/mg) generously provided by Dr. Hanada and Dr. Maehama (National Institute of Infectious Diseases, Tokyo, Japan), pCAG–tdTomato (noted RFP for red fluorescent protein; at the same concentration as RhebCA) (Pathania et al., 2012), pCAG–GFP (1 μg/mg; Addgene), pLKO.1–shRNA against Raptor (shRaptor; Open Biosystems; TRCN0000077468 from the Broad Institute RNAi Consortium, 1 μg/mg), pLKO.1–scramble shRNA (catalog #1864; Addgene), and pCMV-encoding constitutive active mTOR [pCDNA3.1 vector, mutation E2419K, 1 μg/mg; Addgene (Urano et al., 2007)].
Vector validation in Neuro2a cells.
The Neuro-2a mouse neuroblastoma cell line (American Type Culture Collection) was routinely propagated in tissue culture-treated polystyrene multiwell plates or flasks (Falcon; BD Biosciences Discovery Labware). The medium consisted of DMEM (Invitrogen) supplemented with 10% heat-inactivated fetal calf serum and penicillin–streptomycin at 100 U/L and 100 μg/L each (Invitrogen). Cells were maintained at 37°C and 5% CO2. Polyjet (SignaGen Laboratories) was used to transfect expression vectors according to the instructions of the manufacturer when cells reached 80% confluency. RNA and protein was harvested 48 h after transfection.
For Western blots, samples were homogenized in 300 μl of RIPA buffer, 1× Halt Protease and phosphatase inhibitor cocktail (Thermo Fisher Scientific), and 8 U/ml DNase. Samples were boiled in 2× Laemmli's buffer for 5 min. Approximately 20 μg protein/sample was loaded into a 4–15% polyacrylamide gel (Bio-Rad Mini Protean TGX gel). Proteins were transferred to PVDF and blocked in 5% milk or 5% BSA for phospho-antibodies. When appropriate, the blots were probed for phosphorylated ribosomal S6 (pS6), stripped with Restore Western Stripping buffer from Pierce (catalog #21059), followed by probing for the total S6 or GAPDH. Finally, the blots were restripped and probed for total protein using Amido Black total protein stain (0.1% Amido Black, 10% acetic acid, and 40% methanol). After Amido Black staining, the blots were rinsed in 7% acetic acid (6×). All quantifications were performed using NIH Image J software. Antibodies for Western blots included the following: anti-pS6240/244 (1:100,000, catalog #5368; Cell Signaling Technology), S6 (1:5000, catalog #2217; Cell Signaling Technology), and GAPDH (1:5000, catalog #SC-25778; Santa Cruz Biotechnology). HRP-conjugated donkey anti-rabbit from Southern Biotech were used as secondary antibody (1:5000).
Slice preparation.
Horizontal or sagittal slices (300 μm) were prepared from anesthetized (100 mg/kg Nembutal, i.p.) P6–P42 mice using a Leica VT1000S vibratome. Slices were cut in a solution containing the following (in mm): 107 sucrose, 62 NaCl, 2.6 KCl, 1 CaCl2, 1.23 NaH2PO4, 3 MgSO4, 26 NaHCO3, and 10 dextrose, pH 7.4 (equilibrated with 95% O2–5% CO2). After cutting, slices were stored for 30 min at 37°C and then >30 min at room temperature in the following (in mm):124 NaCl, 2.6 KCl, 1 CaCl2, 1.23 NaH2PO4, 26 NaHCO3, 3 MgSO4, and 10 dextrose, pH 7.4. For recording, slices were placed in a flow-through chamber and continuously superfused with oxygenated artificial CSF containing the following (in mm): 124 NaCl, 3 KCl, 2.5 CaCl2, 1.23 NaH2PO4, 1.2 MgSO4, 26 NaHCO3, and 10 dextrose, pH 7.4.
Electrophysiology.
Whole-cell patch-clamp recordings were obtained as described previously (Bolteus and Bordey, 2004). Pipettes had resistances of 6–8 MΩ when filled with an intracellular solution containing the following (in mm): 135 KCl, 2 MgATP, 0.2 NaGTP, 0.2 EGTA, 10 HEPES, and 1 mm NaCl2. The pH and the osmolarity were adjusted to 7.4 and 290 mOsm, respectively. Fluorescent cells were visualized using an Olympus BX51 WI microscope, Olympus LUMPlanFL/IR objectives (4× and 60× water-immersion objective) and appropriate filters, and a Prior Scientific Lumen 200 Fluorescence Illumination System. The liquid junction potential (∼4 mV) was not corrected. Whole-cell recordings were performed using an Axopatch 200B amplifier, and current signals were low-pass filtered at 2–5 kHz and digitized online at 5–20 kHz using a Digidata 1320 digitizing board (Molecular Devices). Recorded cells were held at −70 mV. Capacitive and leak currents were not subtracted. Data were acquired with pClamp, and synaptic currents and cell properties were analyzed using Minianalysis (Synaptosoft) and plotted with SigmaPlot. For some recordings, the GABAA receptor blocker gabazine (2 μm) was used (Tocris Cookson).
Brain clearing and image acquisition.
Brain slices (600 μm) and hemisections expressing fluorescent proteins, postfixed in 4% paraformaldehyde containing PBS for 24 and 48 h, respectively, were optically cleared in Scale A2 solution (Hama et al., 2011) containing the following: 4 m urea, 10% (w/v) glycerol, and 0.1% (w/v) Triton X-100 at pH 7.7. Brain slices were incubated in Scale A2 solution (5 ml) for 7 d, and hemisections were cleared in of the same solution (50 ml) for 14 d. After clearing, slices were mounted in 100% glycerol on microscope slides and imaged using a laser scanning confocal fluorescence microscope (FV-1000; Olympus). Hemisections were mounted in low-melt agarose (3% in Scale A2 solution; AB00981-00050; American Bioanalytical) and imaged with an epifluorescence-enabled stereo microscope (SZX16; Olympus) coupled to a digital camera (DP72; Olympus).
Immunohistochemistry, image acquisition, and pS6 quantification.
Slice preparation, immunostaining, and image acquisition and analysis were as previously described previously (Platel et al., 2010; Feliciano et al., 2012). The primary antibodies used were as follows: rabbit anti-pS6 (1:1000, S240/244, D68F8, XP #5364; Cell Signaling Technology), anti-doublecortin (DCX) (1:500, N-19, sc-8067; Santa Cruz Biotechnology), anti-glial fibrillary acidic protein (GFAP) (1:500, catalog #Z0334; Dako), anti-Mash1 (1:200, catalog #556604; BD Biosciences Pharmingen), anti-Olig2 (1:500, H-68, sc-48817; Santa Cruz Biotechnology), anti-Ki67 (1:200, catalog #556003; BD Biosciences Pharmingen), and anti-NeuN (1:100, clone A60, MAB377; Millipore). The secondary antibody was the appropriate Alexa Fluor series at 1:1000 (Invitrogen) applied for 4–6 h at room temperature. Each staining was replicated in slices from three different animals. Z-section images were acquired on a confocal microscope (FluoView 1000) with a 20× dry objective [numerical aperture (NA) 0.75] or 60× oil objective (NA 1.42). Low-magnification images were acquired with a 10× or 4× dry objective. Images were analyzed and reconstructed using NIH ImageJ 1.39t (Wayne Rasband, National Institutes of Health, Bethesda, MD) and Photoshop CS3 (Adobe Systems). Immunostaining for each marker was performed in at least three sections from more than three different animals.
For quantification of pS6 staining intensity, serial Z-stacks were acquired in coronal sections of an OB. Regions of interest (ROIs) were generated using an elliptical selection tool, and average intensities for each ROI were determined as reported previously (Feliciano et al., 2012). pS6 intensity of RFP+ cells were compared with that in RFP− cells in the same sections.
Acute slice migration assays.
Migration assays were performed as described previously (Lacar et al., 2010). P6–P7 mice were deeply anesthetized with 20 mg/kg Nembutal, and brains were dissected into ice-cold, oxygenated (95% O2, 5% CO2) high-glucose DMEM. The 300-μm-thick sagittal slices were obtained using a Leica vibratome. After incubating for 1 h in room temperature DMEM, slices were transferred to a heated (35°C) perfusion chamber for 1 h. Individual fluorescently labeled cells in the RMS were visualized using a confocal Olympus FluoView 1000 system. Confocal Z-stack images (4 μm spaced sections over 60 μm) were acquired with a 20× immersion objective (XUMPLFL, NA 1.20) every 5 min for at least 90 min. Movies were analyzed in NIH ImageJ software. Image stacks were realigned, and RFP fluorescent cells were tracked using NIH ImageJ plug-ins [Stackreg (56) and MTrackJ written by Dr. E. Meijering, Biomedical Imaging Group Rotterdam, Rotterdam, The Netherlands]. Individual fluorescent cells were tracked using the MTrackJ plug-in.
Morphometry analyses.
Plasmid-expressing neurons in the OB granule cell layer (GCL) of mice killed at P27–P28 or P19 were analyzed in 100-μm-thick sections. Complete dendrites or basal dendrites in confocal Z-stack acquired at 20× on a Fluoview 1000 confocal microscope were traced using Simple Neurite Tracer in FIJI (NIH ImageJ 1.39t) (Schindelin et al., 2012). Sholl analyses were blindly performed using intersections and total dendrite length as a measure of morphological complexity. The number of intersections was measured in 10-μm-increment concentric circles and plotted as a function of the radial distance from the soma. At least four animals were analyzed per condition.
Micronodule analyses.
We used the image processing package FIJI. Z-stacked images of the OB (16 stacks taken at a 4× magnification) were stacked at maximum intensity into one image. The contrast was enhanced with a pixel saturation of 0.35%. The threshold of this image was adjusted following Tsai's threshold (Tsai, 1985). Watershed segmentation (a built-in algorithm in FIJI) was used to separate touching cells and to remove dendrites. A rectangle was drawn to select for an area in the GCL (610 μm width, 555 μm height), and the threshold for detection was set to analyze anything larger than 250 μm2. The number of clusters larger than the area threshold was analyzed for differences between groups.
OB heterotopia quantification.
Analyses of heterotopias in the OB were performed as described for micronodule analyses, but in this case a rectangle encompassing the RMSOB was selected on 10× images. No threshold was set to discriminate for particle size.
Rapamycin treatment.
Different rapamycin treatments were used: (1) 1 mg/kg rapamycin from P5 to P19 every 3 d; (2) 0.1 mg/kg every day from the day of postnatal electroproation to P4, 0.5 mg/kg from P5 to P9 every 2 d, 1 mg/kg from P10 to P19 every 2 d; and (3) 1 mg/kg at embryonic day 17 to the mother, 0.2 mg/kg every day from P0 to P4 (day of electroporation = P1), 0.5 mg/kg from P5 to P9 every 2 d, 1 mg/kg from P10 to P19 every 2 d, but 0.5 mg/kg second to last injection. Together, we had three groups of rapamycin treatment consisting of four to six rapamycin-treated mice and four to five littermate vehicle-treated mice both in the RhebCA condition. The data were analyzed for each group. Considering that the rapamycin effect was similar for each group, data were pooled.
Statistical analyses.
Statistical significance was determined using the one- and two-tailed Student's t test and Mann–Whitney U test. Significance was set at p < 0.05. Data are presented as mean ± SEM.
Results
RhebCA expression increases mTOR activity in newborn neurons in vivo
To increase mTOR activity, we expressed a gain-of-function Rheb mutant in which serine 16 is replaced by a histidine, thus activating Rheb constitutively (RhebCA) (Maehama et al., 2008). The RhebCA-encoding plasmid or a GFP-encoding control vector were injected into the lateral ventricle, the extent of which is shown in Figure 1A (green shape), before being electroporated into NPCs in the SVZ of P1–P2 mice (Fig. 1B). A tdTomato-encoding plasmid (noted RFP) was also coelectroporated in both conditions, allowing cell labeling in the RhebCA condition. Figure 1A displays a 3D model of the lateral ventricle in a P4 mouse. Figure 1B illustrates a simplified sequence of events after NPC electroporation, including the following: generation of daughter cells (transit amplifying cells and neuroblasts) by 3 d post-electroporation (dpe), neuroblast migration from SVZ to OB, and final positioning of newborn neurons in the OB by 3 weeks post-electroporation (wpe). Figure 1C illustrates the extent of electroporation throughout the lateral ventricle. RFP+ cells are already visible in the RMSelbow and OB (Fig. 1C). To examine whether the RhebCA plasmid led to mTOR hyperactivity, we transfected Neuro2a cells with the RhebCA or RFP-encoding vector. Western blot analysis 48 h after transfection showed that RhebCA increased the expression of pS6 compared with the control vector (Fig. 1D). S6 is phosphorylated at serine235/236 and serine240/244 by S6 kinase 1, a direct target of mTOR (Ma and Blenis, 2009). In addition, we immunostained for pS6 in P21 coronal OB sections containing RFP+ neurons (Fig. 1E). RFP+ neurons displayed a significant 52% increase in pS6 immunostaining intensity compared with surrounding RFP− neurons (p < 0.001, N = 3 mice, n = 110, Mann–Whitney U test; Fig. 1F).
Figure 1.
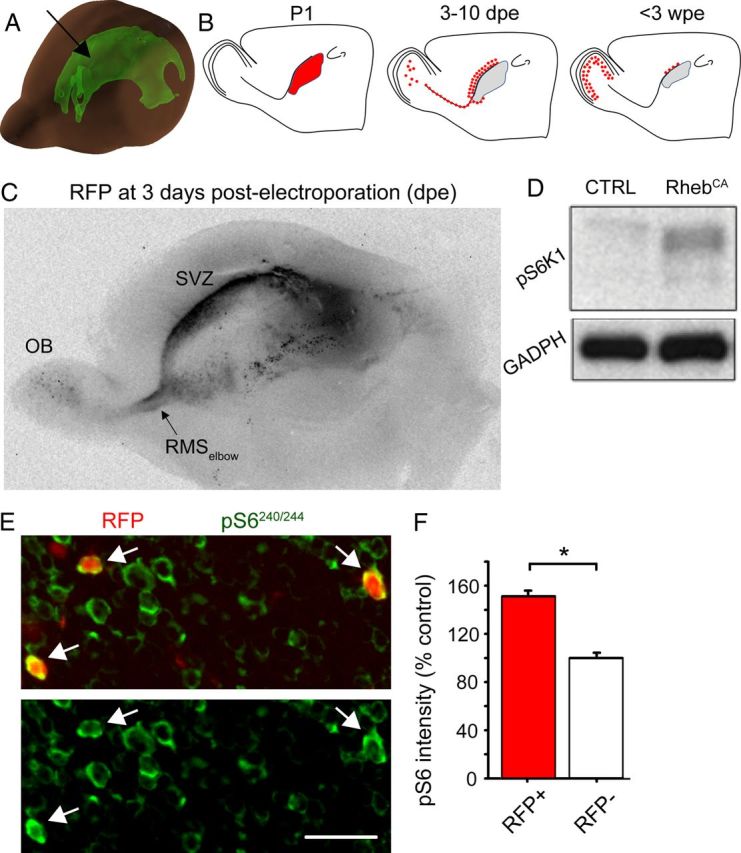
RhebCA induces increased S6 phosphorylation. A, 3D diagram illustrating the lateral ventricle in a P4 mouse brain (arrow). The diagram was generated using the Allen Developing Mouse Brain Atlas (http://www.brain-map.org/). B, Diagram showing the site of electroporation in the lateral ventricle at P1–P3, the migratory route path taken by newly born cells at 7–10 dpe, and their final location at 4–6 wpe and up. C, Image of a 600-μm-thick sagittal cut of a P3 brain containing RFP-expressing cells in the SVZ, RMSelbow, and OB at 3dpe. D, Western blot showing an increase of pS6 phosphorylation after electroporation of Neuro2a cells with a RhebCA or GFP-encoding plasmid. CTRL, Control. E, Confocal images of RFP fluorescence and pS6 immunostaining (green) in the GCL of an OB section from a P21 mouse electroporated at P1. Arrows point to RhebCA-expressing cells. F, Bar graphs of the pS6 intensity (as a percentage of control measured in surrounding RFP− cells) of RFP+ (RhebCA-containing, red) and RFP− (white) granule neurons in the same sections. *p < 0.05. Scale bar, 50 μm (E).
RhebCA expression leads to migratory heterotopia in the RMSelbow and OB
We directly examined whether RhebCA expression would lead to heterotopia as reported previously after Tsc1 removal (Feliciano et al., 2011). By ∼3 wpe, most RFP+ cells in the control condition had reached their final location in the OB, and very few migrating cells were seen in the RMSelbow in sagittal sections (N = 10; Fig. 2A,C). In contrast, in all the littermate mice electroporated with RhebCA, heterotopia were visible along the migratory route to the OB and in the OB (N = 9; Fig. 2B). At higher magnification, two types of migratory heterotopia were visible: more specifically, an accumulation of cells was consistently observed at the RMSelbow that contained cells with a neuronal morphology (arrow) as well as cells with a glial morphology (Fig. 2D, arrowhead). In addition, at the rostral end of the SVZ, accumulation of cells with neuronal morphology were visible (Fig. 2E). Glial cells resembling astrocytes were visible in the RMSOB, and ectopic neuron-like cells were routinely found adjacent to, but outside of, the RMSOB in the accessory olfactory nucleus (AON) (Fig. 2F) and in the OB (Fig. 2B). As expected, cells with a neuronal morphology were consistently observed in the nucleus accumbens close to the ventral tip of the lateral ventricle in both control and RhebCA conditions (De Marchis et al., 2004) (Fig. 2G). These neurons in the RhebCA condition visually appear larger with hypertrophic dendrites than control neurons, but this was not further investigated in this study. These findings are in addition to the presence of ectopic “giant” cells found scattered along the migratory route (see Fig. 6B,E). Collectively, the most consistent and largest pathologies were the presence of “neuronal” heterotopia just outside the RMSOB and mixed neuro-glial heterotopia in the RMSelbow.
Figure 2.
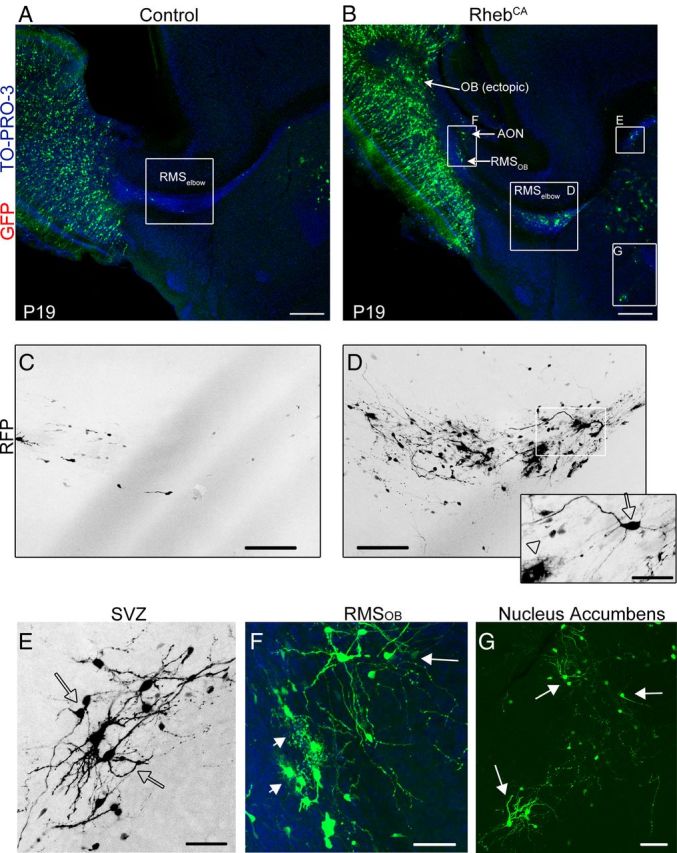
RhebCA expression leads to migratory heterotopia. A, B, GFP- and RhebCA-expressing cells in a sagittal section of P19 mice electroporated at P1 with GFP and RhebCA, respectively. Higher-magnification images in the white squares are shown in C–G. C, D, Confocal seven-image Z-stack of cells in the RMSelbow in control (C) and RhebCA (D) conditions. The inset in D represents a three-image Z-stack from the white square in D to illustrate the presence of a neuron-like cell (arrow) and a glial-like cell (arrowhead). E–G, Higher-magnification images of heterotopia in the white squares of image B in the rostral SVZ (E), the RMSOB (F), and the nucleus accumbens (G). Arrows and arrowheads point to cells with a neuronal and a glial morphology, respectively. Scale bars: A, B, 350 μm; C, D, 70 μm; E, 40 μm; F, 50 μm; G, 70 μm.
Figure 6.

RhebCA-expressing neuroblasts display altered direction and reduced speed while passing stationary giant cells. A, B, Confocal image of RFP+ cells coexpressing GFP (not shown) or RhebCA in the RMSelbow of a sagittal section from a P7 mouse. C, D, Bar graphs of the mean ± SEM speed of migration (C) and the mean number of processes per cell (D) in control (white) and RhebCA (red) condition. E, Example of a cytomegalic, giant RhebCA-expressing cell. F, Diagram showing the four bins used to compare the angles of the processes. G, H, Bar graphs of the mean angles of the processes (G) and the mean percentage of cells in the quadrants compared with the 0–90 ° quadrant. Scale bars: B, 60 μm; E, 50 μm. *p < 0.05; **p < 0.01.
Heterotopia contained neuroblasts, astrocytes, and synaptically integrated neurons
To further characterize the cells forming heterotopia, we performed immunostaining and patch-clamp experiments. Immunostaining was performed for neuronal and glial markers at P19 in sagittal sections containing the RMSelbow. DCX immunostaining (blue) revealed disruption of the chains of migrating neuroblasts at the location of RFP+ cells (Fig. 3A–C). DCX+ cells, i.e., neuroblasts, were found in the heterotopias and leaving the RMSelbow going into the AON (Fig. 3D,E). Immunostaining for the astrocytic marker GFAP (green) revealed the presence of astrocytes in the heterotopias (Fig. 3E,F). As expected, GFAP staining is filamentous and thus essentially overlaps with GFP or RFP in the thickest cell processes and across the cytoplasm. Considering that NPCs generate Mash1+ transit amplifying cells that display a neuronal and oligodendroglial fate, we stained for Mash1 and Olig2, two transcription factors. None of the RFP+ cells expressed the Olig2, and occasionally a Mash1+ cell could be found (data not shown). Thus, heterotopia contained a meshwork of GFAP+ cells and DCX+ neuroblasts, which appear trapped in the heterotopia. The other cells forming the heterotopias displayed a neuronal morphology and were further studied using patch-clamp recordings in acute slices of P15–P20 wild-type mice.
Figure 3.

Heterotopia contained neuroblasts, astrocytes, and cells with a neuronal morphology at P19. A, B, Coimmunostaining for GFAP (green) and DCX (blue) in a sagittal section containing RhebCA-expressing cells at the RMSelbow. C, Confocal image of DCX immunostaining in the RhebCA and control conditions. Image for the RhebCA condition is the same as that shown in A and B. D, E, Immunostaining for GFAP (green) and DCX (blue) of the cells shown in the white square in A and B. The top and deep sections are shown in D and E, respectively. The arrows point to RFP+ cells being DCX+ or GFAP+. F, Immunostaining for GFAP (green) of RhebCA-expressing cells in a heterotopia at the RMSelbow. The arrows point to RFP+ cells being GFAP+. Scale bars: A–C, 150 μm; E, 30 μm; F, 10 μm.
First, we confirmed that cells resembling neuroblasts along the SVZ–RMS axis displayed a typical outwardly rectifying current profile and the lack of action potentials (data not shown) (Wang et al., 2003). Neuronal-like RFP+ cells in or around the RMSelbow, at the base of the OB, and in the RMSOB displayed current-induced action potentials (Fig. 4A,B). In the RMSelbow, ectopic neurons displayed significantly smaller mean capacitance (Cm) and larger input resistance (Rin) than neurons misplaced in the OB (Table 1). This finding suggests a more immature phenotype of ectopic RMS neurons or a different neuronal identity considering that both small GABAergic interneurons and glutamatergic neurons are generated during the neonatal period (Brill et al., 2009; Sequerra et al., 2010; Winpenny et al., 2011). Surprisingly, ectopic neurons displayed spontaneous synaptic currents (sPSCs), suggesting that they receive synaptic inputs from an unknown source. The amplitude of sPSCs (mean of 8 pA) was similar in the RMSOB and OB. The frequency of sPSCs was very low in the RMSelbow and ranged from 3 to 7 Hz in the RMSOB and OB (Table 1). Together, these data suggest that RhebCA expression leads to ectopic differentiation of a subpopulation of newborn neuroblasts and their synaptic integration despite misplacement.
Figure 4.
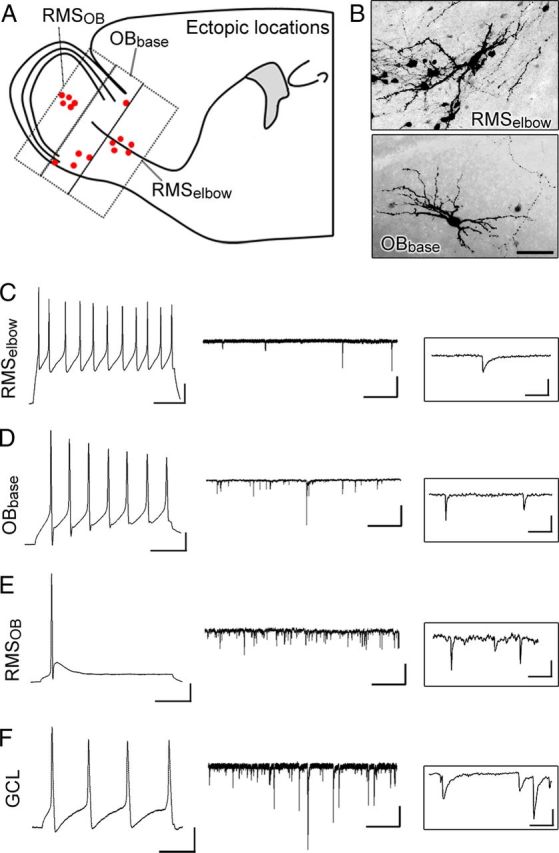
Ectopic neurons in or around heterotopias fire current-induced actions potential and receive synaptic inputs. A, Diagram showing the location of recorded cells. B, Exemplary images of RhebCA-expressing cells with a neuronal morphology in the RMSelbow and at the base of the OB (OBbase). C–F, Current-induced action potentials, sPSC (middle), and higher temporal resolution (right) for synaptic currents recorded in ectopic RhebCA cells at the locations indicated on the left. Calibration: action potentials, 50 ms, 20 mV; synaptic currents, 2 s, 20 pA; synaptic currents, higher resolution, 100 ms, 10 pA. Scale bar, 50 μm.
Table 1.
Electrophysiological properties of RhebCA-containing ectopic cells
| SVZ | n | RMSelbow | n | OB | n | RMSOB | n | |
|---|---|---|---|---|---|---|---|---|
| Action potential amplitude (mV) | 79.5 ± 9.8 | 2 | 60.5 ± 18.3 | 4 | 77.9 ± 17.6 | 4 | ||
| sPSC amplitude (pA) | 8.3 ± 2.8 | 4 | 8.3 ± 2.8 | 3 | ||||
| IEI mean (ms) | 291.7 ± 130.3 | 3 | 148.5 ± 55.4 | 3 | ||||
| Rm (GΩ) | 2.8 ± 1.4 | 3 | 2.8 ± 0.6 | 4 | 1.1 ± 0.3 | 6 | 1.0 ± 0.4 | 4 |
| Cm (GΩ) | 4.8 ± 0.5 | 4 | 12.0 ± 1.6 | 4 | 15.4 ± 3.2 | 6 | 24.6 ± 8.5 | 4 |
IEI, Interevent interval.
Mixed neuro-glial heterotopia may arise from disruption in the migratory path and premature neuronal differentiation
Better understanding the RMSelbow heterotopia requires background on the process of neurogenesis/gliogenesis during the neonatal period. Electroporated radial glia undergo a series of developmental events, including division and generation of Mash1+ transit amplifying cells (Parras et al., 2004), whereas some transform into astrocytes primarily during the first 2 postnatal weeks (Law et al., 1999; Alves et al., 2002). Mash1+ cells have a dual fate and generate DCX+ neuroblasts or Olig2+ progenitor cells committed to becoming oligodendrocytes (Parras et al., 2004). Two major types of neurons are generated mainly during the neonatal period: GABAergic interneurons and to a smaller extent short-axon glutamatergic neurons (Brill et al., 2009; Sequerra et al., 2010; Winpenny et al., 2011). As early as 3 dpe, immunostaining for Mash1 in sagittal section containing the RMSelbow revealed the accumulation of RFP+ Mash1+ cells at the location in which heterotopia are found at P19 in the RhebCA condition (Fig. 5A–E). None of the RFP+ cells were Olig2+, suggesting a neuronal fate (Fig. 5B–D). In addition, ectopically located cells with a more differentiated morphology were already observed in and outside the RMS (Fig. 5A, insets). Nonetheless, neuroblasts were also observed below and past the Mash1+ cell accumulation at 3 dpe and did not appear overly affected by RhebCA (Fig. 5D). Neuroblasts were DCX+, Mash1− (data not shown) and Olig2− (Fig. 5D). By P7, cells with a differentiated morphology in or at the edge of the RMSelbow were NeuN+ (Fig. 5E–H). These data suggest the premature differentiation of some neuroblasts. In addition, the early accumulation of Mash1+ cells may disrupt the stream of migration and lead to cells rerouting to the parenchyma or entrapment over time of neuroblasts and GFAP+ cells from transforming radial glia.
Figure 5.
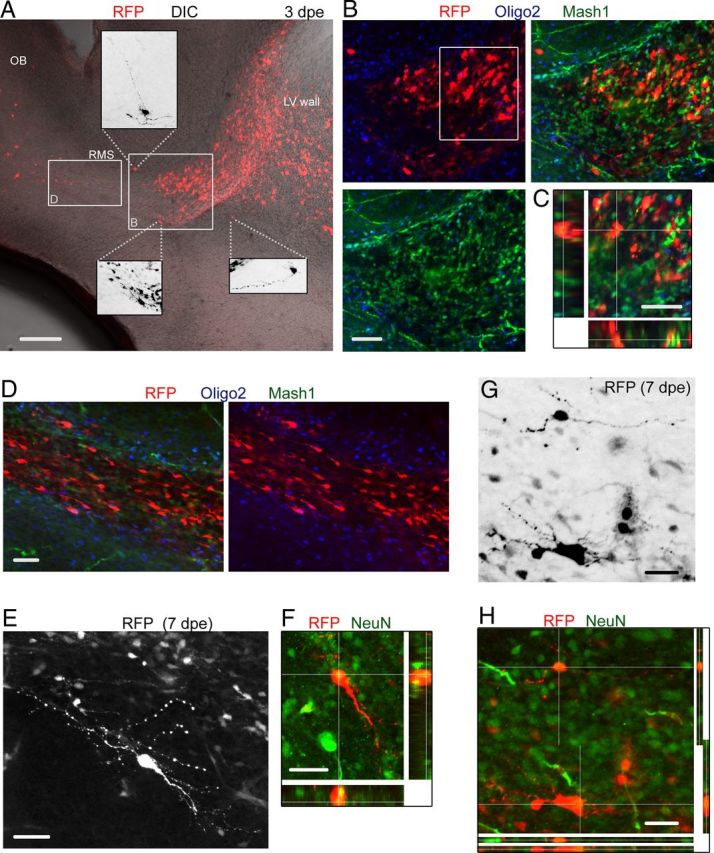
RFP+ cells at early neonatal stages include Mash1+ cells, neuroblasts, and differentiating neurons in the RhebCA condition. A, Confocal image of a sagittal slice at 3 dpe (P4) containing RFP+ cells in the RhebCA condition. Cells are already seen entering the OB circuitry. Insets, Zooms of some ectopic RFP+ cells with a more differentiated morphology. DIC, Differential interference contrast; LV, lateral ventricle. B, Coimmunostaining for Olig2 (blue) and Mash1 (green) of RFP+ cells shown in the white square in A. C, One Z section and multiple Z-associated projections for RFP+ cells that are Mash1+ from the white square in B. D, Confocal image of Mash1 and Olig2 immunostaining in the RMS from the white rectangle shown in A. Neuroblasts are Olig2− and Mash1−. E, F, Confocal images of a differentiated cell at 7 dpe (P8) that stained for NeuN (green) as shown in the projections in F. E shows a Z-stack, and F shows a single Z. G, Confocal image of RFP+ cells in the RMSelbow. H, Immunostaining for NeuN (green) showing that RFP+ cells with a more differentiated morphology are NeuN+. Scale bars: A, 150 μm; B, G, H, 50 μm; C, 40 μm; D–F, 70 μm.
To further explore the notion of migratory disruption, we monitored neuroblast migration in the RMSelbow. RhebCA neuroblasts displayed a significantly decreased speed of migration (54.7 ± 1.8 μm/h, n = 133, N = 5) compared with neuroblasts containing a control RFP-encoding vector (62.4 ± 1.8 μm/h, n = 81, N = 4, p < 0.001; Fig. 6A–C). Figure 6, A and B, illustrates images of RFP+ cells in acute sagittal slices in each condition. All visible cells (except giant cells as in B) were analyzed. To further understand some of the parameters contributing to decreased migratory speed, we counted the number of processes per cell, the angle of the leading process, and the direction of migration. There was a small but significant increase in the mean number of processes with RhebCA (n = 57, N = 3 control, and n = 95, N = 4 RhebCA, Student's t test, p < 0.001; Fig. 6D). This essentially resulted from the presence of more cells with two and occasionally three processes in the RhebCA condition compared with control (12 of 57 vs 47 of 95, p < 0.05, Fisher's exact test). The majority of the cells bearing two or more processes were stationary. Some of these cells were identified as NeuN+ cells in Figure 5. In the RhebCA condition, the RMS also contained stationary enlarged cells of giant proportion compared with surrounding neuroblasts that were not included in the process count (Fig. 6B,E). The angle of the leading process was measured to a line parallel to the RMS and was divided into four bins of 45° each (Fig. 6F). The mean angle calculated independently of the direction (i.e., categorizing all cells into a 0–90° scale) was similar in control (19.6°, n = 63, N = 3) and in RhebCA (21.4°, n = 143, N = 5, p = 0.5; Fig. 6G). Consistent with this finding, the mean angle in the 0–45° and 45–90 ° bins was similar (mean of 15.0° and 62.3° in control and 14.7° and 65.0° with RhebCA). However, when taking into account the direction of migration, we found that there were significantly more cells in the 90–180 ° quadrants (bin 3;4) compared to the 0–90° quadrant in RhebCA (22%, 32 of 143 cells) versus the control (11%, 7 of 67 cells, p < 0.05, one-tail Fisher's exact test; Fig. 6H). These data suggest that migrating neuroblasts had lost directional cues, suggesting a non-cell-autonomous effect from ectopic and stationary cells in the RMS.
RhebCA expression promotes dendritic morphogenesis and synaptic integration in vivo without altering spiking properties
Tsc1null newborn neurons in the OB have increased dendritic complexity (Feliciano et al., 2011). We thus examined the dendritic morphology of RhebCA-containing newborn neurons in the GCL of the OB. At 4 wpe, RhebCA-containing neurons displayed a significant increase in the dendritic complexity and length compared with neurons containing a control vector (Fig. 7A,B). The total length was increased by ∼35% (p < 0.01; Fig. 7C).
Figure 7.
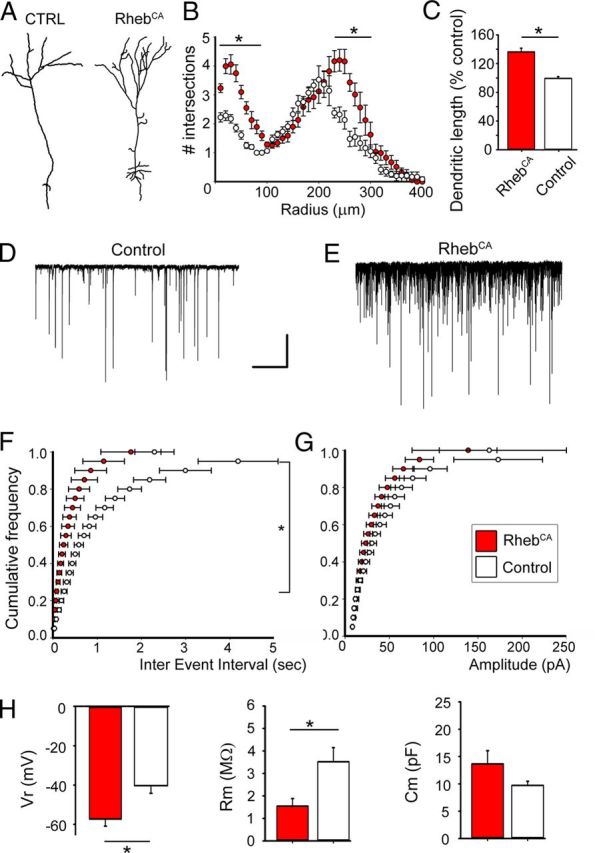
RhebCA leads to a hypertrophic dendritic tree and associated synaptic and biophysical changes. A–C, Tracing of a representative control and a RhebCA-expressing granule neuron (A), corresponding Sholl analysis (B), and bar graphs of the mean dendritic length (C; red: RhebCA, N = 6; white: control, N = 4). D, E, Patch-clamp recording of sPSCs in control (D) and RhebCA (E) granule neurons. Calibration: 10 s, 50 pA. F, G, Corresponding cumulative plots of the frequency (F) and amplitude (G) of synaptic currents (white, control; red, RhebCA). H, Bar graphs of the resting potential (Vr), membrane resistance (Rm), and membrane capacitance of RhebCA (red) and control (white) granule neurons. *p < 0.05.
To examine potential changes in synaptic activity, RFP+ neurons were recorded with the patch-clamp technique at 4 wpe. Consistent with increased dendritic length, the frequency of GABAergic sPSCs was significantly increased by eightfold in RhebCA-containing neurons compared with neurons containing a control vector (10.9 Hz, n = 8 vs 1.3 Hz, n = 7, p < 0.001; Fig. 7D,E, Table 2). Synaptic currents were identified as GABAergic because a GABAA receptor blocker (gabazine, 2 μm) blocked 90% of the synaptic currents (n = 6; data not shown). The sPSC amplitude was not significantly different between the two conditions.
Table 2.
Electrophysiological and synaptic properties of granule cells
| RhebCA (mean ± SEM) | n | CTRL | n | % change (Rheb/CTRL) | p | |
|---|---|---|---|---|---|---|
| Resting potential (mV) | −57.2 ± 3.5 mV | 8 | −40.3 ± 3.9 | 7 | 29.5 | 0.001 |
| Rm (GΩ) | 1.5 ± 0.3 | 6 | 3.5 ± 0.6 | 5 | 43.9 | 0.05 |
| Cm (GΩ) | 13.6 ± 2.4 | 6 | 9.7 ± 0.7 | 5 | 40.3 | NS |
| IEI (ms) | 90.9 ± 2.4 | 8 | 780.7 ± 32.9 | 8 | 89 | 0.001 |
| AP threshold (mV) | −53.6 ± 2.5 | 6 | −49.9 ± 5.9 | 5 | 7.5 | NS |
| AP width (ms) | 1.5 ± 0.2 | 8 | 3.0 ± 0.7 | 7 | 50 | NS |
| AP amplitude (mV) | 81.2 ± 4.8 | 8 | 68.4 ± 7.3 | 7 | 18.7 | NS |
| AP number | 6.0 ± 2.0 | 8 | 6.6 ± 1.1 | 7 | 7.5 | NS |
CTRL, Control; IEI, interevent interval; AP, action potential; NS, not significant.
In addition, the resting potential of RhebCA neurons was significantly more hyperpolarized compared with control neurons (−57.2 vs −40.3 mV, p < 0.001). Importantly, we found no significant changes in the properties of action potentials (i.e., threshold, width, and amplitude) in RhebCA compared with control neurons (Table 2). These data suggest that increased mTOR activity through RhebCA expression in newborn granule neurons did not affect their excitability.
RhebCA-expressing neurons form micronodules
As mentioned above, the majority of RhebCA-expressing neuroblasts appeared normal in the RMS and reached the OB in which they integrated primarily as granule cells. We examined the overall organization of RFP+ neurons in the GCL. In medial sagittal OB sections, clumping of RFP+ neurons was visible in the RhebCA condition, leading to the visual appearance of micronodules compared with the control (no RhebCA) and rapamycin (with RhebCA) conditions (Fig. 8A,B). To quantify this apparent disorganization of RhebCA-expressing neurons, we counted the number of micronodules. We found that there was a significant increase in the number of micronodules in the RhebCA condition compared with the control condition (i.e., GFP electroporated, p < 0.05, Mann–Whitney U test, N = 15 with RhebCA and N = 11 in control; Fig. 8B). These data suggest that RhebCA-expressing neurons release improper attractant or repellant cues and/or have defects in adhesion molecules.
Figure 8.
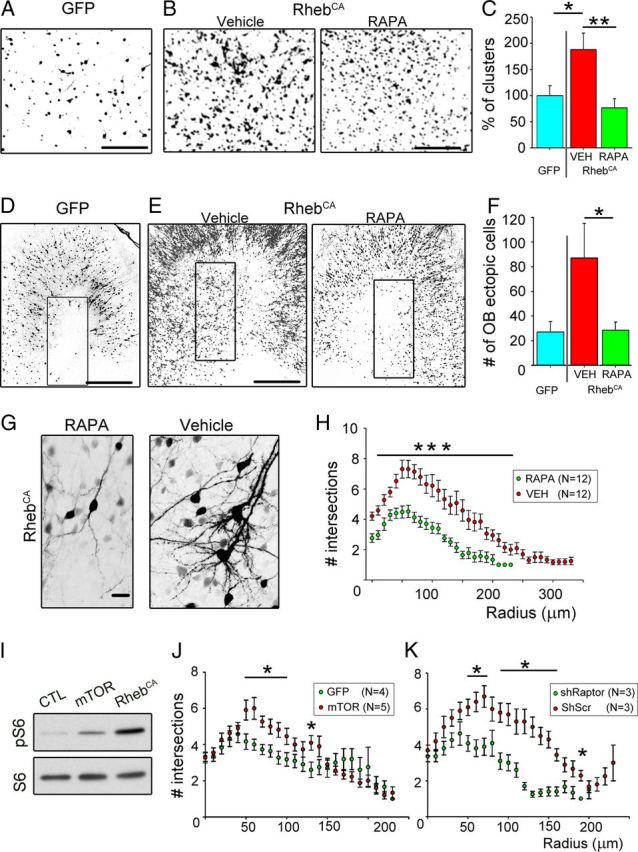
OB heterotopia, micronodules, and dendrite hypertrophy are mTOR dependent. A, B, Images taken in a medial sagittal section of the OB illustrating cells forming micronodules in the vehicle condition compared with the rapamycin condition (B) and control (GFP instead of RhebCA) conditions (A). In the rapamycin and vehicles, cells were electroporated with RhebCA. C, Bar graphs of the percentage of micronodules (or clusters) in the RhebCA condition with vehicle (red) or rapamycin (green) normalized to the GFP-electroporated condition (blue). D, E, Images of ectopic GFP- or RhebCA-containing cells in or outside the RMSOB in sagittal sections. The rectangles highlight the analyzed regions. F, Bar graphs of the number of ectopic cells in the OB in the GFP- (blue) and RhebCA-electroporated conditions with vehicle (red) or rapamycin (green). G, Images of RhebCA-expressing cells in the vehicle and rapamycin condition. H, Sholl analysis representing the number of intersections for the basal dendrites of RhebCA-expressing granule cells in vehicle (red)- and rapamycin (green)-treated mice at 19 dpe. I, Immunoblots of phospho-S6240/244 (pS6) and S6 from Neuro2a transfected with a control vector (GFP), mTOR-encoding, or RhebCA-encoding vector. CTL, Control. J, K, Sholl analysis of the number of intersections for the basal dendrites of GFP or shRaptor (green)-expressing and mTOR or shScramble (red)-expressing granule cells at 19 dpe. Scr, Scramble; RAPA, rapamycin. *p < 0.05, **p < 0.005, ***p < 0.001. Scale bars: A, B, 100 μm; D, E, 350 μm; G, 50 μm.
OB heterotopia, micronodules, and dendrite hypertrophy are rapamycin sensitive
To examine whether the described RhebCA-induced alterations were mTOR dependent, we tested the mTOR blocker rapamycin. mTOR formed two complexes: mTORC1 and mTORC2 (Ma and Blenis, 2009). Rapamycin preferentially blocks mTORC1 and is the gold standard for testing mTOR involvement (Franz, 2011). In addition, rapamycin is undergoing several clinical trials to prevent tuberous sclerosis pathologies and symptoms. Mice were thus treated with rapamycin at different concentrations based on age or vehicle. We saw no improvement of the RMSelbow heterotopias, which forms as early as 3 dpe. However, the OB heterotopias, micronodules, and dendrite hypertrophy observed in the RhebCA condition were significantly prevented by rapamycin treatment (Fig. 8). The percentage of micronodules in medial sagittal sections was significantly prevented with rapamycin treatment (p < 0.005, Mann–Whitney U test, N = 15 vehicle and N = 18 with rapamycin; Fig. 8A,B). To quantify OB heterotopias, we counted the number of ectopic cells in the OB just in or outside the RMSOB. There was a significant 68% decrease in the number of ectopic OB cells with rapamycin treatment (p < 0.05, one-tailed Student's t test, N = 9 and N = 12 in rapamycin and vehicle treated, respectively; Fig. 8C,D). Rapamycin treatment significantly decreased the basal dendrite complexity induced by RhebCA treatment (Fig. 8E,F). Considering that basal dendrites can be reliably quantified, we also tested whether an mTOR encoding vector could recapitulate dendrite hypertrophy. The mTOR vector was not as strong as the RhebCA vector at increasing mTOR activity in Neuro2a (Fig. 8G). pS6 was used as a readout of mTOR activity. Nevertheless, a subset of mTOR-expressing granule cells displayed significant increased basal dendrite complexity compared with GFP-expressing cells (Fig. 8H). Finally, we tested whether shRaptor, a critical component of mTORC1, would prevent dendrite hypertrophy. shRaptor-expressing cells displayed a decreased dendritic complexity than shScramble-containing cells (Fig. 8K).
Discussion
Here, we found that expression of RhebCA in neonatal NPCs of the SVZ led to the formation of TSC-like lesions, synaptically integrated ectopic neurons, and circuit abnormality in wild-type mice. The lesions included RMS and OB heterotopia. Most of the observed defects were rapamycin sensitive, suggesting the involvement of mTOR in these pathologies. The lack of rescue of the RMS heterotopia is presumably technical as discussed below. This finding suggests that normal individuals without any known mutation who experience increased mTOR signaling during the perinatal period may acquire TSC-like lesions and associated neurological impairments.
To increase mTOR activity, we expressed a plasmid encoding RhebCA. This vector has been shown previously to efficiently activate the mTOR pathway by several groups (Maehama et al., 2008; Nie et al., 2010; Magri et al., 2011). It allows rapid mTOR stimulation in <2 d that persist for at least 1 month (we did not examine longer time points). RhebCA does not lead to overt mTOR activation considering that most of the defects are rapamycin sensitive. In addition, using a plasmid allows us to affect an early-born cohort of cells generated from electroporated NPCs because dividing cells dilute the plasmid over time (Lacar et al., 2010). This approach may thus better represent a transient mTOR upregulation attributable to viral infection or other mechanisms during development as opposed to a permanent genetic deletion.
Using this approach, we report several pathologies that recapitulate those found after biallelic Tsc1 inactivation in Tsc1 heterozygote mice using the same experimental approach (i.e., neonatal electroporation). These data suggest that mTOR activation in animals with a wild-type background is sufficient to lead to severe defects of neurogenesis and circuit. These pathologies at >19 dpe consisted of the following: heterotopia in the migratory path and in the OB, ectopic neurons in or just outside the migratory path, GCL micronodules attributable to cell clumping, and dendrite hypertrophy.
At 19 dpe, the RMS heterotopia contained a mixture of cells, including neurons (NeuN+), neuroblasts (DCX+), and astrocytes (GFAP+). These heterotopia were not prevented by rapamycin treatment. To better understand this finding and the cellular diversity in the heterotopia, we performed immunostaining at different time points. We found that, as early as 3 dpe, Mash1+ Olig2− cells were found at the location in which heterotopia are found at 19 dpe. Mash1+ cells are generated from NPCs and have a neuronal fate when they lack Olig2− expression (Parras et al., 2004). In addition, ectopic cells were already observed at 3 dpe and exhibited a more differentiated phenotype. These data lead us to propose that RhebCA-expressing Mash1+ cells in the RMS may disrupt cell migration through either obstruction of the migratory path and/or release of aberrant cues. As a result, some cells may be trapped or rerouted to the parenchyma. By 7 dpe, NeuN+ neurons as well as giant cells are found scattered through the RMS and could contribute to the disruption in migration. This concept of non-cell-autonomous disruption of neuroblast migration fits well with the migration data. RhebCA neuroblasts displayed a small increase in the number of processes and no change in the angle of the leading process. However, a larger number of RhebCA neuroblasts migrated in the opposite direction, and this could explain the small (13%) decrease in migration speed at 7 dpe. These findings and explanations are in agreement with the larger decrease in migration speed in Tsc1+/− mice, in which experiments were performed at an older age (P21) when the RMS contained a larger number of nonstationary cells (Feliciano et al., 2012). In addition, these data are in agreement with a recent study showing that Pten deletion in SVZ neuroblasts and resulting hyperactive mTOR does not significantly alter their speed of migration (Zhu et al., 2012). The presence of Mash1+ cells and then differentiated neurons may also lead to entrapment of GFAP+ cells, i.e., astrocytes, that are generated from the transformation of radial glia. Although not shown, we observed radial fibers from radial glia electroporated in the SVZ as reported previously using DiI labeling (Law et al., 1999; Alves et al., 2002). Finally, the fact that the RMS heterotopia results from abnormal development during the first postnatal week likely explains the lack of rapamycin effect at the dose tested. We could not increase rapamycin dosage because the animals by 19 dpe were half the size of the littermates.
The presence of giant-looking cells in the migratory path is a striking feature of TSC and focal cortical dysplasia type II (Mizuguchi and Takashima, 2001; Lamparello et al., 2007). It remains to be explored whether these cells are generated as a result of abnormal differentiation of neonatal radial glial cells that can produce bipotential progenitors with a dual lineage property (i.e., neurons and glia) (Levison and Goldman, 1993; Aguirre and Gallo, 2004). Another possibility is that microglia may be activated by some RhebCA-expressing cells that are undergoing apoptosis. Microglia are an inherent cellular component of the neurogenic niche (Goings et al., 2006). Activated microglia could attempt to phagocytose the damaged cells and would then acquire RhebCA and hyperactive mTOR. This could lead to enlarged microglia with a mixed phenotype.
Another defect in the RhebCA condition is the presence of ectopic neurons in the RMS heterotopia, along the migratory path, and forming OB heterotopia. These ectopic neurons were found to generate action potentials and received synaptic currents. These RhebCA neurons were thus synaptically integrated despite their mislocation. Ectopic neurons are much larger than RhebCA-expressing granule cells and display firing properties different from granule cells, suggesting that they are different types of neurons. In addition, it is intriguing that some neuroblasts are affected by RhebCA whereas others migrate properly and reach their final location. Although additional work would be required for a definitive explanation, we propose that the above findings result from the following synergistic effects: (1) some neuroblasts are trapped or enter the parenchyma and synaptically integrate because of the accumulation of cells in their migratory path, and (2) mTOR activation leads to mRNA translation promoting cell differentiation and thus migration arrest. In addition, two pieces of evidence could explain the diversity of neuronal size and electrophysiological properties: (1) mTOR activation leads to the translation of mRNA, which should not have been expressed leading to a fate switch, and/or (2) considering that neonatal NPCs generate different types of neurons, including GABAergic and glutamatergic neurons (although to a smaller extent), mTOR will likely affect both neuroblast types leading to neuronal diversity. We favor the second option considering that glutamatergic neurons have been shown to be generated (Brill et al., 2009; Sequerra et al., 2010; Winpenny et al., 2011).
Finally, we identified significant circuit defects in the OB, including micronodule and dendritic hypertrophy. Both defects were prevented by rapamycin treatment. The formation of micronodules attributable to apparent neuron clumping suggests that RhebCA-expressing neurons either express attractant cues or do not express the proper repellant cues. Finally, as shown after Tsc1 or Pten removal and associated mTOR hyperactivity in embryonic or neonatal immature neurons (Kwon et al., 2006; Meikle et al., 2007; Feliciano et al., 2011, 2012; Goto et al., 2011), we found that the dendritic trees of synaptically integrated neurons in the OB (i.e., at their final location) was hypertrophic. This was associated with a corresponding increase in the frequency of GABAergic synaptic inputs (i.e., more dendritic length, more synaptic points of contact) and correlated changes in the cell biophysics. However, their current-induced action potentials in RhebCA neurons were unaffected by mTOR hyperactivity. This finding suggests that mTOR hyperactivity does not alter the intrinsic excitability of granule neurons. Such an important finding needs to be examined in cortical neurons because it would suggest that cortical excitability in TSC arises from synaptic rewiring as already proposed (Major et al., 2009) and/or mishandling of synaptic information by hypertrophic neurons. In addition to rapamycin, we found that an mTOR-encoding vector also led to dendrite hypertrophy. It was not as pronounced as with RhebCA presumably because the mTOR vector was not as strong as the RhebCA vector because of a different promoter. The RhebCA effect on dendrites was also prevented by knocking down Raptor, one of the essential components of mTORC1. These data strongly suggest the mTORC1 contribution to dendrite hypertrophy of newborn neurons in vivo.
Collectively, our data show that Rheb activation associated with mTOR hyperactivity in newborn NPCs and neuroblasts leads to tuberous sclerosis-like lesions, ectopic and premature neuronal differentiation and integration, micronodule formation, and hypertrophic neuronal morphogenesis. mTOR can be increased by several mechanisms, such as viral infections or epigenetic changes affecting gene expression and protein function impinging on the mTOR pathway [e.g., Pten (Endersby and Baker, 2008), STRADα (Orlova et al., 2010), and AMPK (Amato and Man, 2011)]. Overall, our findings raise the possibility that transient increase in mTOR signaling during a given developmental period leads to specific brain lesions with different degrees of severity as seen in TSC patients.
Footnotes
This work was supported by grants from the Department of Defense (Idea Development Award W81XWH-10-1-0041 (A.B.), Pfizer Goldman-Rakic fellowship (T.L.), and National Institute of Health National Research Service Award 10668225 (D.M.F.). We thank Dr. Hanada and Dr. Maehama (Department Biochemistry and Cell Biology, National Institute of Infectious Diseases, Tokyo, Japan) for the RhebCA vector and the laboratory members for helpful discussion and comments.
The authors declare no competing financial interests.
References
- Aguirre A, Gallo V. Postnatal neurogenesis and gliogenesis in the olfactory bulb from NG2-expressing progenitors of the subventricular zone. J Neurosci. 2004;24:10530–10541. doi: 10.1523/JNEUROSCI.3572-04.2004. [DOI] [PMC free article] [PubMed] [Google Scholar]
- Alves JA, Barone P, Engelender S, Fróes MM, Menezes JR. Initial stages of radial glia astrocytic transformation in the early postnatal anterior subventricular zone. J Neurobiol. 2002;52:251–265. doi: 10.1002/neu.10087. [DOI] [PubMed] [Google Scholar]
- Amato S, Man HY. Bioenergy sensing in the brain: the role of AMP-activated protein kinase in neuronal metabolism, development and neurological diseases. Cell Cycle. 2011;10:3452–3460. doi: 10.4161/cc.10.20.17953. [DOI] [PMC free article] [PubMed] [Google Scholar]
- Bolteus AJ, Bordey A. GABA release and uptake regulate neuronal precursor migration in the postnatal subventricular zone. J Neurosci. 2004;24:7623–7631. doi: 10.1523/JNEUROSCI.1999-04.2004. [DOI] [PMC free article] [PubMed] [Google Scholar]
- Bourgeron T. A synaptic trek to autism. Curr Opin Neurobiol. 2009;19:231–234. doi: 10.1016/j.conb.2009.06.003. [DOI] [PubMed] [Google Scholar]
- Brill MS, Ninkovic J, Winpenny E, Hodge RD, Ozen I, Yang R, Lepier A, Gascón S, Erdelyi F, Szabo G, Parras C, Guillemot F, Frotscher M, Berninger B, Hevner RF, Raineteau O, Götz M. Adult generation of glutamatergic olfactory bulb interneurons. Nat Neurosci. 2009;12:1524–1533. doi: 10.1038/nn.2416. [DOI] [PMC free article] [PubMed] [Google Scholar]
- Crino PB, Nathanson KL, Henske EP. The tuberous sclerosis complex. N Engl J Med. 2006;355:1345–1356. doi: 10.1056/NEJMra055323. [DOI] [PubMed] [Google Scholar]
- De Marchis S, Fasolo A, Puche AC. Subventricular zone-derived neuronal progenitors migrate into the subcortical forebrain of postnatal mice. J Comp Neurol. 2004;476:290–300. doi: 10.1002/cne.20217. [DOI] [PubMed] [Google Scholar]
- Endersby R, Baker SJ. PTEN signaling in brain: neuropathology and tumorigenesis. Oncogene. 2008;27:5416–5430. doi: 10.1038/onc.2008.239. [DOI] [PubMed] [Google Scholar]
- Feliciano DM, Su T, Lopez J, Platel JC, Bordey A. Single-cell Tsc1 knockout during corticogenesis generates tuber-like lesions and reduces seizure threshold in mice. J Clin Invest. 2011;121:1596–1607. doi: 10.1172/JCI44909. [DOI] [PMC free article] [PubMed] [Google Scholar]
- Feliciano DM, Quon JL, Su T, Taylor MM, Bordey A. Postnatal neurogenesis generates heterotopias, olfactory micronodules and cortical infiltration following single-cell Tsc1 deletion. Hum Mol Genet. 2012;21:799–810. doi: 10.1093/hmg/ddr511. [DOI] [PMC free article] [PubMed] [Google Scholar]
- Franz DN. Everolimus: an mTOR inhibitor for the treatment of tuberous sclerosis. Expert Rev Anticancer Ther. 2011;11:1181–1192. doi: 10.1586/era.11.93. [DOI] [PubMed] [Google Scholar]
- Goings GE, Kozlowski DA, Szele FG. Differential activation of microglia in neurogenic versus non-neurogenic regions of the forebrain. Glia. 2006;54:329–342. doi: 10.1002/glia.20381. [DOI] [PubMed] [Google Scholar]
- Goto J, Talos DM, Klein P, Qin W, Chekaluk YI, Anderl S, Malinowska IA, Di Nardo A, Bronson RT, Chan JA, Vinters HV, Kernie SG, Jensen FE, Sahin M, Kwiatkowski DJ. Regulable neural progenitor-specific Tsc1 loss yields giant cells with organellar dysfunction in a model of tuberous sclerosis complex. Proc Natl Acad Sci U S A. 2011;108:E1070–E1079. doi: 10.1073/pnas.1106454108. [DOI] [PMC free article] [PubMed] [Google Scholar]
- Hama H, Kurokawa H, Kawano H, Ando R, Shimogori T, Noda H, Fukami K, Sakaue-Sawano A, Miyawaki A. Scale: a chemical approach for fluorescence imaging and reconstruction of transparent mouse brain. Nat Neurosci. 2011;14:1481–1488. doi: 10.1038/nn.2928. [DOI] [PubMed] [Google Scholar]
- Hoeffer CA, Klann E. mTOR signaling: at the crossroads of plasticity, memory and disease. Trends Neurosci. 2010;33:67–75. doi: 10.1016/j.tins.2009.11.003. [DOI] [PMC free article] [PubMed] [Google Scholar]
- Hoeffer CA, Sanchez E, Hagerman RJ, Mu Y, Nguyen DV, Wong H, Whelan AM, Zukin RS, Klann E, Tassone F. Altered mTOR signaling and enhanced CYFIP2 expression levels in subjects with fragile X syndrome. Genes Brain Behav. 2012;11:332–341. doi: 10.1111/j.1601-183X.2012.00768.x. [DOI] [PMC free article] [PubMed] [Google Scholar]
- Inoki K, Corradetti MN, Guan KL. Dysregulation of the TSC-mTOR pathway in human disease. Nat Genet. 2005;37:19–24. doi: 10.1038/ng1494. [DOI] [PubMed] [Google Scholar]
- Kwiatkowski DJ, Manning BD. Tuberous sclerosis: a GAP at the crossroads of multiple signaling pathways. Hum Mol Genet 14 Spec No. 2005;2:R251–R258. doi: 10.1093/hmg/ddi260. [DOI] [PubMed] [Google Scholar]
- Kwon CH, Luikart BW, Powell CM, Zhou J, Matheny SA, Zhang W, Li Y, Baker SJ, Parada LF. Pten regulates neuronal arborization and social interaction in mice. Neuron. 2006;50:377–388. doi: 10.1016/j.neuron.2006.03.023. [DOI] [PMC free article] [PubMed] [Google Scholar]
- Lacar B, Young SZ, Platel JC, Bordey A. Imaging and recording subventricular zone progenitor cells in live tissue of postnatal mice. Front Neurosci. 2010;4.pii:43. doi: 10.3389/fnins.2010.00043. [DOI] [PMC free article] [PubMed] [Google Scholar]
- Lamparello P, Baybis M, Pollard J, Hol EM, Eisenstat DD, Aronica E, Crino PB. Developmental lineage of cell types in cortical dysplasia with balloon cells. Brain. 2007;130:2267–2276. doi: 10.1093/brain/awm175. [DOI] [PubMed] [Google Scholar]
- Law AK, Pencea V, Buck CR, Luskin MB. Neurogenesis and neuronal migration in the neonatal rat forebrain anterior subventricular zone do not require GFAP-positive astrocytes. Dev Biol. 1999;216:622–634. doi: 10.1006/dbio.1999.9498. [DOI] [PubMed] [Google Scholar]
- Levison SW, Goldman JE. Both oligodendrocytes and astrocytes develop from progenitors in the subventricular zone of postnatal rat forebrain. Neuron. 1993;10:201–212. doi: 10.1016/0896-6273(93)90311-e. [DOI] [PubMed] [Google Scholar]
- Ma XM, Blenis J. Molecular mechanisms of mTOR-mediated translational control. Nat Rev Mol Cell Biol. 2009;10:307–318. doi: 10.1038/nrm2672. [DOI] [PubMed] [Google Scholar]
- Maehama T, Tanaka M, Nishina H, Murakami M, Kanaho Y, Hanada K. RalA functions as an indispensable signal mediator for the nutrient-sensing system. J Biol Chem. 2008;283:35053–35059. doi: 10.1074/jbc.M805822200. [DOI] [PMC free article] [PubMed] [Google Scholar]
- Magri L, Cambiaghi M, Cominelli M, Alfaro-Cervello C, Cursi M, Pala M, Bulfone A, Garcìa-Verdugo JM, Leocani L, Minicucci F, Poliani PL, Galli R. Sustained activation of mTOR pathway in embryonic neural stem cells leads to development of tuberous sclerosis complex-associated lesions. Cell Stem Cell. 2011;9:447–462. doi: 10.1016/j.stem.2011.09.008. [DOI] [PubMed] [Google Scholar]
- Major P, Rakowski S, Simon MV, Cheng ML, Eskandar E, Baron J, Leeman BA, Frosch MP, Thiele EA. Are cortical tubers epileptogenic? Evidence from electrocorticography. Epilepsia. 2009;50:147–154. doi: 10.1111/j.1528-1167.2008.01814.x. [DOI] [PubMed] [Google Scholar]
- Meikle L, Talos DM, Onda H, Pollizzi K, Rotenberg A, Sahin M, Jensen FE, Kwiatkowski DJ. A mouse model of tuberous sclerosis: neuronal loss of Tsc1 causes dysplastic and ectopic neurons, reduced myelination, seizure activity, and limited survival. J Neurosci. 2007;27:5546–5558. doi: 10.1523/JNEUROSCI.5540-06.2007. [DOI] [PMC free article] [PubMed] [Google Scholar]
- Mizuguchi M, Takashima S. Neuropathology of tuberous sclerosis. Brain Dev. 2001;23:508–515. doi: 10.1016/s0387-7604(01)00304-7. [DOI] [PubMed] [Google Scholar]
- Moody CA, Scott RS, Amirghahari N, Nathan CO, Young LS, Dawson CW, Sixbey JW. Modulation of the cell growth regulator mTOR by Epstein-Barr virus-encoded LMP2A. J Virol. 2005;79:5499–5506. doi: 10.1128/JVI.79.9.5499-5506.2005. [DOI] [PMC free article] [PubMed] [Google Scholar]
- Moorman NJ, Cristea IM, Terhune SS, Rout MP, Chait BT, Shenk T. Human cytomegalovirus protein UL38 inhibits host cell stress responses by antagonizing the tuberous sclerosis protein complex. Cell Host Microbe. 2008;3:253–262. doi: 10.1016/j.chom.2008.03.002. [DOI] [PMC free article] [PubMed] [Google Scholar]
- Nie D, Di Nardo A, Han JM, Baharanyi H, Kramvis I, Huynh T, Dabora S, Codeluppi S, Pandolfi PP, Pasquale EB, Sahin M. Tsc2-Rheb signaling regulates EphA-mediated axon guidance. Nat Neurosci. 2010;13:163–172. doi: 10.1038/nn.2477. [DOI] [PMC free article] [PubMed] [Google Scholar]
- Orlova KA, Parker WE, Heuer GG, Tsai V, Yoon J, Baybis M, Fenning RS, Strauss K, Crino PB. STRADalpha deficiency results in aberrant mTORC1 signaling during corticogenesis in humans and mice. J Clin Invest. 2010;120:1591–1602. doi: 10.1172/JCI41592. [DOI] [PMC free article] [PubMed] [Google Scholar]
- Parras CM, Galli R, Britz O, Soares S, Galichet C, Battiste J, Johnson JE, Nakafuku M, Vescovi A, Guillemot F. Mash1 specifies neurons and oligodendrocytes in the postnatal brain. EMBO J. 2004;23:4495–4505. doi: 10.1038/sj.emboj.7600447. [DOI] [PMC free article] [PubMed] [Google Scholar]
- Pathania M, Yan LD, Bordey A. A symphony of signals conduct early and late stages of adult neurogenesis. Neuropharmacology. 2010;58:865–876. doi: 10.1016/j.neuropharm.2010.01.010. [DOI] [PMC free article] [PubMed] [Google Scholar]
- Pathania M, Torres-Reveron J, Yan L, Kimura T, Lin TV, Gordon V, Teng ZQ, Zhao X, Fulga TA, Van Vactor D, Bordey A. miR-132 enhances dendritic morphogenesis, spine density, synaptic integration, and survival of newborn olfactory bulb neurons. PLoS One. 2012;7:e38174. doi: 10.1371/journal.pone.0038174. [DOI] [PMC free article] [PubMed] [Google Scholar]
- Platel JC, Dave KA, Gordon V, Lacar B, Rubio ME, Bordey A. NMDA receptors activated by subventricular zone astrocytic glutamate are critical for neuroblast survival prior to entering a synaptic network. Neuron. 2010;65:859–872. doi: 10.1016/j.neuron.2010.03.009. [DOI] [PMC free article] [PubMed] [Google Scholar]
- Schindelin J, Arganda-Carreras I, Frise E, Kaynig V, Longair M, Pietzsch T, Preibisch S, Rueden C, Saalfeld S, Schmid B, Tinevez JY, White DJ, Hartenstein V, Eliceiri K, Tomancak P, Cardona A. Fiji: an open-source platform for biological-image analysis. Nat Methods. 2012;9:676–682. doi: 10.1038/nmeth.2019. [DOI] [PMC free article] [PubMed] [Google Scholar]
- Sequerra EB, Miyakoshi LM, Fróes MM, Menezes JR, Hedin-Pereira C. Generation of glutamatergic neurons from postnatal and adult subventricular zone with pyramidal-like morphology. Cereb Cortex. 2010;20:2583–2591. doi: 10.1093/cercor/bhq006. [DOI] [PubMed] [Google Scholar]
- Swiech L, Perycz M, Malik A, Jaworski J. Role of mTOR in physiology and pathology of the nervous system. Biochim Biophys Acta. 2008;1784:116–132. doi: 10.1016/j.bbapap.2007.08.015. [DOI] [PubMed] [Google Scholar]
- Tsai W. Moment-preserving thresholding: a new approach. Comput Vis Graph Image Process. 1985;29:377–393. [Google Scholar]
- Urano J, Sato T, Matsuo T, Otsubo Y, Yamamoto M, Tamanoi F. Point mutations in TOR confer Rheb-independent growth in fission yeast and nutrient-independent mammalian TOR signaling in mammalian cells. Proc Natl Acad Sci U S A. 2007;104:3514–3519. doi: 10.1073/pnas.0608510104. [DOI] [PMC free article] [PubMed] [Google Scholar]
- Walsh D, Mohr I. Phosphorylation of eIF4E by Mnk-1 enhances HSV-1 translation and replication in quiescent cells. Genes Dev. 2004;18:660–672. doi: 10.1101/gad.1185304. [DOI] [PMC free article] [PubMed] [Google Scholar]
- Wang DD, Krueger DD, Bordey A. Biophysical properties and ionic signature of neuronal progenitors of the postnatal subventricular zone in situ. J Neurophysiol. 2003;90:2291–2302. doi: 10.1152/jn.01116.2002. [DOI] [PubMed] [Google Scholar]
- Way SW, McKenna J, 3rd, Mietzsch U, Reith RM, Wu HC, Gambello MJ. Loss of Tsc2 in radial glia models the brain pathology of tuberous sclerosis complex in the mouse. Hum Mol Genet. 2009;18:1252–1265. doi: 10.1093/hmg/ddp025. [DOI] [PMC free article] [PubMed] [Google Scholar]
- Winpenny E, Lebel-Potter M, Fernandez ME, Brill MS, Götz M, Guillemot F, Raineteau O. Sequential generation of olfactory bulb glutamatergic neurons by Neurog2-expressing precursor cells. Neural Dev. 2011;6:12. doi: 10.1186/1749-8104-6-12. [DOI] [PMC free article] [PubMed] [Google Scholar]
- Zeng LH, Rensing NR, Zhang B, Gutmann DH, Gambello MJ, Wong M. Tsc2 gene inactivation causes a more severe epilepsy phenotype than Tsc1 inactivation in a mouse model of tuberous sclerosis complex. Hum Mol Genet. 2011;20:445–454. doi: 10.1093/hmg/ddq491. [DOI] [PMC free article] [PubMed] [Google Scholar]
- Zhu G, Chow LM, Bayazitov IT, Tong Y, Gilbertson RJ, Zakharenko SS, Solecki DJ, Baker SJ. Pten deletion causes mTorc1-dependent ectopic neuroblast differentiation without causing uniform migration defects. Development. 2012;139:3422–3431. doi: 10.1242/dev.083154. [DOI] [PMC free article] [PubMed] [Google Scholar]
- Zoncu R, Efeyan A, Sabatini DM. mTOR: from growth signal integration to cancer, diabetes and ageing. Nat Rev Mol Cell Biol. 2011;12:21–35. doi: 10.1038/nrm3025. [DOI] [PMC free article] [PubMed] [Google Scholar]