

Abstract
Lateral inhibition between neurons occurs in many different sensory systems, where it can perform such functions as contrast enhancement. In the olfactory bulb, lateral inhibition may occur between odorant receptor-specific glomeruli that are linked anatomically by GABAergic granule cells (GCs) and cells within the glomerular layer, although evidence supporting lateral inhibition at a functional level is modest. Here, we used patch-clamp, imaging, and glutamate uncaging methods in rat olfactory bulb slices to test for the presence of interglomerular lateral inhibition, as well as its underlying mechanisms. We found that a conditioning stimulus applied at one or a small group of glomeruli could suppress stimulus-evoked excitation of output mitral cells (MCs) at another glomerulus for interstimulus intervals of 20–50 ms and glomerular separations of up to 600 μm. The observed lateral inhibition was entirely dependent on circuitry within the glomerular layer, rather than GCs, and it involved GABAergic synaptic inputs that were targeted mainly onto tufted cells, which act as intermediaries in the excitation between olfactory sensory neurons and MCs. The key cell type responsible for mediating lateral interactions between glomeruli were GABAergic short-axon cells. These results suggest a functional segregation of GABAergic cells within the bulb, with one set located in the glomerular layer mediating suppression of MC spiking across glomeruli, and a second set, the GCs, synchronizing different glomeruli.
Introduction
Lateral inhibition between functionally defined neurons occurs in a number of sensory systems, where it can sharpen receptive fields (Kuffler, 1953). For olfaction, such signal sharpening may occur in the first processing center, the olfactory bulb (OB), where groups of output mitral cells (MCs) and tufted cells are ordered by their affiliation with odorant receptor (OR)-specific glomeruli (Mori et al., 1999; Shepherd et al., 2004). Lateral inhibition between glomeruli (“interglomerular” inhibition) may also serve other functions, such as normalization of signaling for odor concentration (Linster and Cleland, 2009) or temporal patterning. Much of the basis for the argument that lateral inhibition in the bulb may be important is based on the circuit anatomy. GABAergic granule cells (GCs) make dendrodendritic synaptic contacts onto the lateral dendrites of MCs affiliated with different glomeruli, and short-axon cells within the glomerular layer link groups of glomeruli (Pinching and Powell, 1971; Aungst et al., 2003; Kiyokage et al., 2010).
Surprisingly, the evidence supporting the existence of interglomerular lateral inhibition is in fact quite modest. In in vivo studies, odor can suppress MC action potential firing (Wellis et al., 1989; Buonviso and Chaput, 1990; Yokoi et al., 1995; Fantana et al., 2008; Tan et al., 2010; “spiking”), yet the observed effects could very well be due to mechanisms intrinsic to one glomerulus (McGann et al., 2005; Cleland and Sethupathy, 2006; Gire and Schoppa, 2009; Shao et al., 2012) rather than interglomerular mechanisms. In one study in bulb slices testing more directly for lateral inhibition (Arevian et al., 2008), electrical stimulation of one glomerulus reduced spiking at a different glomerulus by as much as ∼20%. However, this effect, attributed to GC inputs, was observed when the cell bodies of the test MCs were directly depolarized with a patch pipette, which differs from the natural situation in which excitation is initiated by olfactory sensory neurons (OSNs). Following OSN stimulation, MC spiking is dependent on a long-lasting depolarization (LLD) (Carlson et al., 2000; Gire and Schoppa, 2009) driven by powerful, regenerative events in a glomerulus, and it is unclear what impact inhibition would have on the LLD. The glomerular microcircuitry has been reported to inhibit the LLD (Aungst et al., 2003; Shirley et al., 2010), but only weakly. The LLD at one glomerulus could be shortened by stimulation of another glomerulus at times ≥150 ms later, presumably when the regenerative events that underlie the LLD were nearly terminated. This long delay suggests that this inhibition would be effective only near the very end of a rodent's sniff cycle (Wachowiak, 2011).
In this study, we used patch-clamp and imaging methods in rat bulb slices to test for the presence of interglomerular lateral inhibition and its underlying mechanisms. Using a dual-stimulation paradigm in which a conditioning stimulus of a glomerulus was applied just before (≤50 ms) stimulation of another glomerulus, we found significant interglomerular inhibition of the MC LLD. The observed inhibition was mediated entirely by circuitry within the glomerular layer, and involved GABAergic short-axon cells targeting synapses mainly onto tufted cells.
Materials and Methods
Animals.
Male and female 9- to 22-d-old Sprague Dawley rats were used in most experiments. Some experiments (see Fig. 6) used transgenic rats expressing Venus fluorescent protein under control of the vesicular GABA transporter promoter [VGAT-Venus rats (Uematsu et al., 2008), strain 2; Wistar background]. Animals used for these experiments were heterozygotes obtained by breeding a homozygous VGAT-Venus male with a wild-type Wistar female. All experiments were conducted under protocols approved by the Institutional Animal Care and Use Committee of the University of Colorado, Anschutz Medical Campus.
Figure 6.
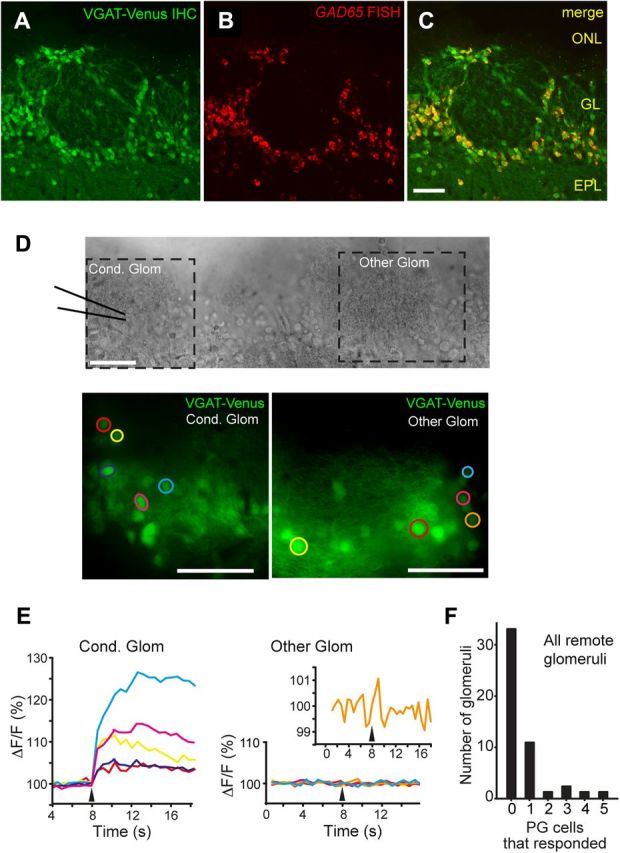
Few PG cells are excited by conditioning stimulation of other glomeruli. A–C, Overlap in Venus and GAD65 signals in the glomerular layer of OB. A, Venus immunohistochemistry (IHC) (GFP antibody). B, GAD65 RNA fluorescent in situ hybridization (FISH). C, Overlay. D, E, Measurements of calcium signals (fura-2 AM) in Venus-positive putative PG cells in response to stimulation of a conditioning glomerulus (300 μA, 100 μs). D shows the DIC image (top) and VGAT-Venus fluorescence (native) image (bottom) of the conditioning glomerulus upon which the stimulating electrode was placed and another glomerulus. E shows the calcium responses (ΔF/F) of putative PG cells taken from the two glomeruli shown in D. Note the much larger responses from PG cells at the conditioning glomerulus. At the other glomerulus, one cell (orange trace) was a responder, based on our statistical analysis (see Materials and Methods), but the response was very weak. F, Summary of counts of PG cells that responded to the conditioning stimulus. Data were taken from 49 glomeruli located two to six glomerular widths (∼160–480 μm) from the stimulating pipette. Most glomeruli contained no responding PG cells. All scale bars, 50 μm.
Slice preparation.
Horizontal slices (330 μm) from rat olfactory bulbs were taken from rats following general isoflurane anesthesia and decapitation. Bulbs were rapidly removed and placed in ice-cold oxygenated (95% O2 and 5% CO2) solution containing the following (in mm): 72 sucrose, 83 NaCl, 26 NaHCO3, 10 glucose, 1.25 NaH2PO4, 3.5 KCl, 3 MgCl2, 0.5 CaCl2 adjusted to 295 mOsm. Before cutting slices, we separated the two bulbs from each other with a razor blade and glued a block that included one bulb and a small portion of the frontal cortex to a stage with Loctite 404 adhesive glue along the ventral surface of the bulb. Slices were cut using a vibrating microslicer (Vibratome 1000; Technical Products International) and were incubated in a holding chamber for 30 min at 32°C. Subsequently, the slices were stored at room temperature. Bulb slices were placed on an upright Zeiss Axioskop 2FS microscope (Carl Zeiss MicroImaging) with differential interference contrast (DIC) optics video microscopy and a CCD camera. Cells were visualized with 20 and 40× Zeiss water-immersion objectives, and most recordings were performed on the medial surface of the OB. The recording temperature was 30–35°C.
Electrophysiology.
The base extracellular recording solution contained the following (in mm): 125 NaCl, 25 NaHCO3, 1.25 NaH2PO4, 25 glucose, 3 KCl, 2 CaCl2, 1 MgCl2 (pH 7.3 and adjusted to 295 mOsm), and was oxygenated (95% O2, 5% CO2). The pipette solution for recordings of excitatory currents in MCs and external tufted (ET) cells contained the following (in mm): 125 K-gluconate, 2 MgCl2, 0.025 CaCl2, 1 EGTA, 2 NaATP, 0.5 NaGTP, 10 HEPES (pH 7.3 with KOH and adjusted to 215 mOsm), plus 100 μm Alexa 488 to allow visualization of cell processes. IPSCs in MCs and ET cells in Figures 3–5 were recorded with a pipette solution containing the following (in mm): 120 cesium methanesulfonate, 10 TEA-Cl, 10 HEPES, 1 EGTA, 2 NaATP, 0.5 NaGTP, plus 100 μm Alexa 488 and 10 mm QX-314. Patch pipettes were fabricated from borosilicate glass and were pulled to a resistance of 1–3 MΩ in MC recordings and 3–4 MΩ in recordings from ET cells.
Figure 3.
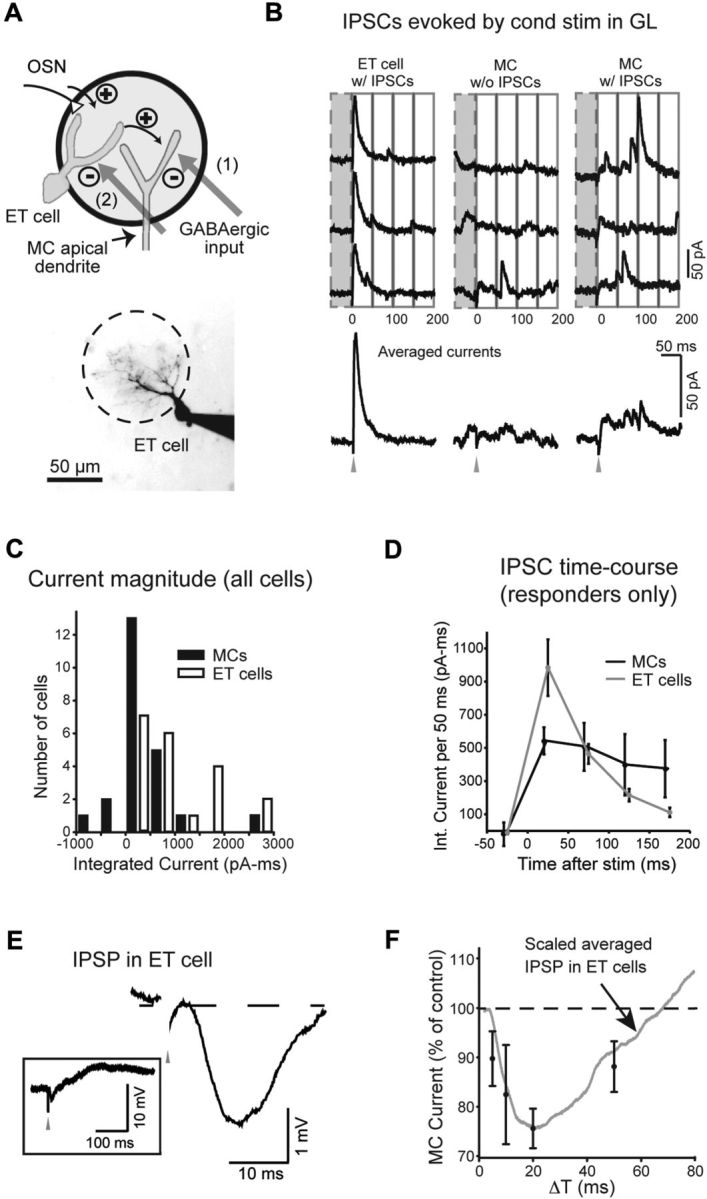
ET cells are the primary recipients of the GABAergic synapses that underlie lateral inhibition of MCs. A, Top, Two possible targets of the GABAergic synaptic inputs include the apical dendrite of the MC itself (option 1) or ET cells, which mediate multistep excitation between OSNs and MCs (option 2). Bottom, ET cell used in the recording in B. B, Recording of IPSCs evoked by conditioning stimulation of distant glomeruli, used to determine the cell target of GABAergic synapses. Single-trial responses (top) and averaged responses (bottom) are shown for an ET cell that showed a strong evoked IPSC (left; Vhold = −7 mV) and MCs with (middle) and without (right) evoked IPSCs. MC recordings were made in slices with a cut through the EPL and ONL to ensure that evoked IPSCs originated in the GL. C, Histogram of baseline-subtracted integrated current measurements, summarizing the IPSC recordings in ET cells and MCs. Histogram bars are shown in increments of 500 pA · ms. The relatively large spread of the MC data around zero reflects noise in MC recordings due to spontaneous IPSCs. Conditioning stimuli were applied at distances >300 μm from the test cells in all experiments. D, Time course of evoked IPSCs in ET cells and MCs, in selected cells with evoked responses. Each point in plot reflects the average integrated current measured in 50 ms intervals centered at the indicated times. E, Current-clamp recording of the voltage response in an ET cell to a conditioning stimulus (prestimulus voltage, −58 mV), shown in expanded and nonexpanded (boxed) forms. Note the short-duration IPSP, which, in this cell, was followed by a longer-lasting EPSP. F, The IPSP in ET cells evoked by a conditioning stimulus (averaged across 6 ET cells) superimposed on plot relating suppression of the MC LLD with the time interval between conditioning and test stimulation (taken from Fig. 1G). The IPSP was scaled to peak at the current value for ΔT = 20 ms.
Figure 4.

Glutamate uncaging evokes lateral IPSCs in ET cells but not MCs. A, Experimental design. IPSCs in MCs and ET cells were recorded in response to glutamate uncaging at a distant glomerulus (gray circle; recordings done in 100 μm MNI-glutamate, 35-μm-diameter laser pulse). The uncaged glutamate can excite SA cells in the conditioning glomerulus that project to the test glomerulus. MC recordings were done in slices with a cut through the EPL to isolate glomerular layer inhibition. B, Example current recordings (Vhold = −7 mV), showing an evoked IPSC in an ET cell (left) but not the MC (right). Three representative trials are shown at top, and averages are at bottom. The open bars below the averaged traces indicate the 100 ms laser pulse. The evoked IPSC in the ET cell occurred with a delay of ∼30 ms following the start of the laser pulse, presumably reflecting the time it takes for glutamate to accumulate and activate SA cells at the conditioning glomerulus, either directly or via a polysynaptic mechanism. C, Histogram summarizing baseline-subtracted current measurements made across 45 MC–laser spot pairs and 38 ET cell–laser spot pairs. D, The spatial spread of the laser-evoked glutamate transients was assessed by measuring excitatory currents in an ET cell directly evoked by the uncaged glutamate. The top image shows the ET cell, along with light spots applied at different locations. The bottom traces show evoked currents. E, Summary of evoked current amplitude versus distance between the light spot and the nearest dendritic process of the test cell. Recordings were obtained in six MCs and two ET cells.
Figure 5.

ET cells receive inhibitory input from GABAergic SA cells. A, Two potential mechanisms for the source of GABAergic input onto ET cells that underlies lateral inhibition. GABAergic SA cells could provide direct inhibitory input onto ET cells (option 1) or glutamatergic SA cells could excite GABAergic PG cells that then inhibit ET cells (option 2). B, Recordings of IPSCs in an ET cell, evoked by glutamate uncaging at a distant conditioning glomerulus (at open bars), used to discriminate the two mechanisms in A. Local puff application of glutamate receptor blockers (20 μm NBQX, 100 μm dl-APV) at the target glomerulus of the ET cell failed to reduce the IPSC, consistent with a mechanism of inhibition involving GABAergic SA cells. Data traces are displayed in nonexpanded (left) and expanded (right) forms. Note at bottom left that the puff of antagonists did impact the ET cell current before the laser pulse, indicating that glutamate receptor activation contributed to the baseline current. C, Puffs of NBQX and APV greatly reduced the EPSC due to monosynaptic OSN-to-ET cell transmission, evoked by local stimulation of OSNs at the target glomerulus of the ET cell (40 μA, 100 μs). These results control for possible inadequate drug penetration of target glomeruli in the puffer experiments. D, Summary of effects of puff-applied NBQX and APV on the IPSC evoked by conditioning stimulation of a distant glomerulus or the monosynaptic OSN-to-ET cell EPSC. Asterisk denotes a significant (p = 0.04) reduction due to the puff. E, The IPSC in the ET cell evoked by electrical stimulation at a conditioning stimulus (300 μA, 100 μs) had a short onset delay, further consistent with a mechanism involving direct inputs from GABAergic SA cells. The onset delay in this experiment was 2.2 ms.
Current and voltage signals were recorded with a Multiclamp 700B amplifier (Molecular Devices), low-pass filtered at 1 kHz using an eight-pole Bessel filter, and digitized at 10 kHz. Data were acquired using Axograph X software on a Macintosh Power Mac G5 computer and analyzed using Axograph X and SigmaPlot (Systat Software) software. The target glomeruli of the test MCs were stimulated electrically by placing a broken-tip patch pipette (10 μm diameter) in the olfactory nerve (ON) layer, 50–100 μm superficial to the glomerular layer. Conditioning stimulation was performed by placing a similar stimulating electrode directly in the center of a glomerulus ≥200 μm from the target glomeruli. Since OSN axons run rostral to caudal across the surface of the OB, conditioning stimulation was always applied caudal to test stimulation to minimize the risk of inadvertently exciting olfactory receptor neuron axons with the conditioning pulse. Single conditioning and test stimulus pulses were applied (100 μs duration), with an intertrial interval of 20 s. The intensity of the stimulation of OSNs at target glomeruli (7–35 μA) was set to be the minimum intensity necessary to evoke an LLD in 100% of trials in the test MCs. Conditioning stimulation was always at a 300 μA intensity. Distances between the sites of conditioning and test stimulation were measured from the tip of the conditioning stimulator to the center of the target glomerulus of the recorded cell. We did not account for distance along the z-axis, so all distance measurements may have underestimated actual distance.
Glutamate uncaging was performed with a UGA-40 control unit and a 355 nm, 30 mW DPSL laser coupled to a 200 μm fiber optic light guide (Rapp OptoElectronics). This light guide produced a 35-μm-diameter laser spot when used with a 40× water-immersion objective. The laser was set to maximum emission and pulses were controlled using a TTL output from Axograph X. 4-Methoxy-7-nitroindolinyl-caged-l-glutamate (MNI caged glutamate) (100 μm) was prepared fresh each day and recycled for the duration of the experiment through a homemade gravity flow perfusion system. No currents were observed from cells that were stimulated with the same laser pulse in the absence of caged glutamate.
MCs were easily identified by their position in the MC layer. We identified ET cells initially based upon their location in the inner portion of the glomerular layer and their relatively large cell body size (≥15 μm diameter). In some cells, we performed cell-attached recordings on suspected ET cells before breaking in and going to whole-cell mode. Many ET cells displayed spontaneous bursts of action potentials in cell-attached mode. In all ET cells, we confirmed cell identity during patch-clamp recordings based on their relatively low input resistance (generally 150–300 MΩ) compared with periglomerular (PG) cells (generally 500 MΩ to >1 GΩ), the ability to evoke an LLD current with test stimulation (Gire and Schoppa, 2009), and an anatomical profile observed during live-cell imaging that included extensive dendritic arbors that ramified in a single glomerulus, a lack of lateral dendrites, and axons directed toward the MC layer. Cells projecting to more than one glomerulus or having a process that could be a lateral dendrite were excluded.
Focal puff application of glutamate receptor blockers 1,2,3,4-tetrahydro-6-nitro-2,3-dioxobenzo[f]quinoxaline-7-sulfonamide (NBQX) and d,l-2-amino-5-phosphonopentanoic acid (d,l-AP5) was conducted using a picospritzer (Parker Instrumentation).
Microsurgical cuts through the olfactory nerve layer (ONL), glomerular layer (GL), and external plexiform layer (EPL) were performed using a razor blade and a dissecting microscope.
Analysis of electrophysiological data.
For quantifying the magnitude of MC excitatory currents in voltage-clamp recordings (see Figs. 1, 2), currents evoked by ON stimulation were integrated using a 300 ms window starting just after the stimulus. This integration time window was chosen because it would capture most of the LLD response. In the presence of gabazine, LLD duration increased, and therefore these experiments were integrated over a 1.5 s window. To determine the fraction of MCs that displayed lateral inhibition, we used a criterion of a ≥10% decrease in the integrated current. This was based on the at-most 10% increase in the MC excitatory response due to the conditioning stimuli (see Fig. 1C), which we assumed reflected sampling error.
Figure 1.

Lateral inhibition of LLDs in MCs. A, Experimental design. A test stimulus was applied to the ONL near the target glomerulus of the test MC (labeled with Alexa 488, 100 μm) to evoke an LLD. A conditioning stimulus was applied directly to a glomerulus 200–1200 μm from the target glomerulus (for this cell, 405 μm). ONL, Olfactory nerve layer; GL, glomerular layer; EPL, external plexiform layer; MCL, mitral cell layer. B, Recording from the MC in A showing that conditioning stimuli reduced the LLD current (measured at Vhold = −77 mV). Top, Five trials in response to test stimulation alone (left) or when a conditioning stimulus preceded test stimulation by 20 ms (right; ΔT = 20 ms). The gray and black arrowheads indicate times of conditioning and test stimulation, respectively. Bottom left, Average response from all trials in this cell (9 trials under each condition). Bottom right, Average currents for the same cell in response to test stimulation alone (black) or with a conditioning prestimulus (gray) in the presence of gabazine. C, Effect of conditioning stimulation on LLD current in 27 MCs for ΔT = 20 ms. The number of trials per experiment varied from 7 to 38. D, Example current-clamp recording from a MC, showing suppression of spike activity due to the conditioning stimulus (gray traces) compared with control (black). Four trials are shown overlaid under each condition. Spike peaks were truncated. E, Suppression of LLD current as a function of distance between conditioning and test stimuli. The diagonal line shows correlation between LLD inhibition and distance (R2 = 0.20; p = 0.02). The filled circles indicate experiments where the slice had a cut through the ONL between conditioning and test stimuli; the open circles were without a cut. Each data point in the plot reflects a separate recording. F, Comparison of LLD suppression in one MC for ΔT = 20 (left) or 50 ms (right). G, Dependence of lateral inhibition of the LLD on the time interval between conditioning and test stimulation. n values are shown for each interval. Inhibition (*p ≤ 0.03) was observed for both ΔT = 20 and 50 ms, although significantly less inhibition was observed for ΔT = 50 ms (p = 0.01).
Figure 2.

A circuit in the glomerular layer mediates lateral inhibition. A, Sectioning through the GL between the sites of conditioning and test stimulation abolished interglomerular LLD suppression. The DIC image at left (with fluorescent MC overlaid) shows the site of the cut through the GL and ON layers in an experiment in which the two stimulating electrodes were 420 μm apart. At middle are the averaged data traces recorded without (black) and with (gray) a conditioning stimulus. At right are IPSCs recorded in the same MC in response to the conditioning stimulus alone (isolated at Vhold = +23 mV). The presence of IPSCs indicates that this MC received substantial GABAergic synaptic input from GCs but that the inhibition did not suppress the LLD. B, Significant suppression of the LLD occurred in a slice in which the EPL was sectioned. C, Histogram summarizing LLD suppression for all recordings obtained in intact slices (cuts only through ONL) versus slices with cuts either through the EPL (blue) or GL (red). Histogram bars are shown in increments of 10%; the width of each bar was narrower to accommodate the three conditions on the same graph. Slices with cuts through the EPL or GL also included a cut through the ONL. D, E, Calcium imaging of fura 2 AM dye signals in the granule cell layer (GCL) was used to verify that cuts through the EPL greatly reduced excitation of GCs evoked by conditioning stimuli across the cut. Green in the fluorescence image in D reflects baseline fura-2 signal (elicited by 380 nm light) in the GCL on either the same side of the cut with respect to the stimulating electrode or across the cut. E, Representative GC responses (ΔF/F) on the same side (left) or across the cut (right). The arrows indicate time of stimulus. All scale bars: (in D), 50 μm.
In IPSC recordings (see Figs. 3, 4), we determined whether an ET cell or a MC had an IPSC evoked by conditioning stimulation by measuring the integrated current during a 50 ms baseline period and comparing that with the current in a 50 ms window after stimulation (100 ms windows for uncaging experiments). We recorded 5–49 trials per cell and assessed responsiveness across trials (α = 0.05) using a paired t test or a Wilcoxon signed rank test for those that failed a normality test. IPSC onset delays (see Fig. 5E) were determined by measuring the time interval between the center of the stimulus artifact and the first point where the current deviated from baseline, as determined by visual inspection.
Across the study, statistical significance was established using Student's t test unless the data were not normally distributed in which case the Wilcoxon signed rank or Mann–Whitney rank sum test was used. Data values are reported as mean ± SE.
Fluorescence measurements and calcium imaging.
Alexa 488 and Venus were excited by whole field epiillumination (480–510 nm) using a Sutter Lambda DG-4 light source and fluorescence signals detected by a CCD camera (CoolSnap II HQ) under control of Slidebook (Intelligent Imaging Innovations) or AxioVision (Zeiss) software. For the images, wide-field images from multiple planes were often overlaid to reconstruct dendritic morphology.
For calcium imaging, slices were first loaded by incubation with 50 μm fura-2 AM plus 0.2% pluronic for 60 min in oxygenated extracellular solution at room temperature. Following loading, slices were transferred back to the holding chamber and allowed to recover for 30 min before transferring to the recording chamber. Fura-2 was excited by whole field epiillumination (380 and 340 nm) and fluorescence signals captured at a 1–2 Hz frame rate with 4 × 4 binning using Slidebook. Regions of interest (ROIs) were defined by tracing the outline of cells and calculating the ratio of fluorescence at 340/380 nm for each ROI. Responders were detected by calculating the average baseline fluorescence over 10–14 frames, and then setting a response threshold based on the mean of the baseline plus 2.5 SDs. If the fluorescence of an ROI exceeded that threshold in one of the two frames following stimulation, it was classified as a responder. Changes in intracellular calcium concentration for each ROI are expressed as ΔF/F (the increase in fluorescence from baseline divided by the baseline fluorescence). Electrical stimulation in the imaging studies of PG cells (see Fig. 6) was performed using our standard glomerular stimulation method. Imaging experiments involving GCs (see Fig. 2D,E), done to confirm the efficacy of the cuts through the EPL in reducing GC excitation, were performed using stimuli applied to the ON layer. ON stimulation provided a more conservative test of the efficacy of the EPL cuts, since it likely provided a stronger excitatory stimulus. This assumption was supported by parallel experiments in which we analyzed responses in GCs that were just internal in the bulb with respect to a stimulation electrode placed in the glomerular layer. The fraction of dye-loaded GCs activated in these studies (17% of 441 dye-loaded GCs across four slices with no cuts) was still substantial but considerably lower than the fraction activated by ON stimulation (43%; the number reported in Results).
In situ hybridization.
An 8-week-old female heterozygous VGAT-Venus rat was anesthetized with Nembutal (50 mg/kg) and transcardially perfused with 10% sucrose followed by 4% formaldehyde in PBS. Brains were removed and postfixed in 4% formaldehyde overnight at 4°C. Horizontal OB slices (50 μm) were prepared on a vibratome and placed in diethylpyrocarbonate (DEPC)-treated PBS (DEPC-PBS). Slices were digested with proteinase K (10 μg/ml) in PBS plus 0.1% Tween 20 (PBST) for 15 min at room temperature, followed by a 10 min wash with 2 mg/ml glycine in PBST and two 5 min washes in PBST. Slices were then postfixed with 4% paraformaldehyde/0.2% glutaraldehyde in PBST for 20 min at room temperature followed by two 5 min washes in PBST. Sections were dehydrated with 2 min incubations in ascending ethanol (50, 70, 95, and 100%) and then rinsed briefly with PBST before being placed into hybridization buffer containing the following: 66% formamide, 13% dextran, 260 mm NaCl, 13 mm Tris, 1.3 mm EDTA, 0.5 mg/ml yeast tRNA, 10 mm DTT, and 1× Denhardt's solution, pH 8.0.
To determine whether the Venus signal in the VGAT-Venus rat could be used as a marker of PG cells, sections were treated with RNA probes for the 65 kDa isoform of glutamate decarboxylase (GAD65), which is specific to PG cells with uniglomerular dendritic projections (Kiyokage et al., 2010). We also tested probes for the vesicular glutamate transporter isoforms 1 and 2 (VGLUT1/2) as a further control. Digoxigenin (DIG)-labeled antisense and sense RNA probes for GAD65 and VGLUT1/2 were made as previously described (Jarvie and Hentges, 2012). Tissue was hybridized with probes for 20 h. GAD65 was detected by simultaneously hybridizing two probes corresponding to base pairs 312–945 and 940–1770 from accession number NM_012563.1, both of which have 100% homology with rat cDNA. Each probe was used at a concentration of 150 pg/μl and hybridized at 52°C. VGLUT1 (accession number NM_053859.2; base pairs 676–1281) and VGLUT2 (accession number NM_053427.1; base pairs 1511–2096) were hybridized together at 70°C at a concentration of 250 pg/μl and 1 ng/μl, respectively. Both probes were originally made from mice, but have a 95% homology with rat cDNA. Sense probes were used to establish specificity of antisense probes. Following hybridization, sections were subjected to three 30 min washes with 50% formamide in 5× SSC, pH 4.5, and three 30 min washes with 50% formamide in 2× SSC for 30 min at 60°C, and then digested for 30 min at 37°C with 20 μg/ml RNase A in TE plus 0.5 m NaCl, pH 8.0.
Sections were washed three times in TNT (0.1 m Tris-HCl, pH 7.5, 0.15 m NaCl, 0.05% Tween 20), and blocked for 1 h at room temperature in TNB (TN plus 0.5% Blocking Reagent provided in the TSA kit; PerkinElmer). Venus fluorescence was quenched by the in situ hybridization procedure, but immunohistochemistry was performed for Venus because the epitopes for antigenicity remained. Sections were incubated overnight at 4°C with sheep anti-DIG conjugated to horseradish peroxidase (Roche Applied Science; 1:1000) and chicken anti-GFP (Abcam; ab13970; 1:2000) in TNB. After three washes in TNT, sections were incubated for 2 h in donkey anti-chicken Cy3 secondary antibody (Millipore; 1:400), and then washed three times in TNT buffer and subjected to a 30 min biotin amplification using the TSA Plus Biotin Kit (PerkinElmer) following manufacturer's instructions. After biotin amplification, sections were incubated for 30 min in streptavidin conjugated to Alexa Fluor 488 (Invitrogen; 1:600), washed three times in TNT, and mounted for imaging.
Sections were imaged on an Olympus Fluoview 1000 confocal microscope using 20 and 60× oil-immersion objectives. Autofluorescence was minimized by imaging the no-primary control slices and consecutively decreasing photomultiplier tube sensitivity until fluorescence could no longer be visually detected. Images were focused ∼10 μm into the depth of the tissue and were acquired by sequentially scanning with individual lasers using a Kalman filter. For the images in Figure 6A–C, we applied a median filter using the Olympus Fluoview software (FV10-ASW) and inverted the green and red signals for clarity.
Colocalization between GAD65 and Venus (assayed with anti-GFP antibody) was assessed by creating ROIs encircling cells with visible nuclei. For this analysis, we collected ROI data from 229 GAD65-positive cells at 47 glomeruli from four different GAD65 antisense probe-treated slices. We then calculated thresholds of background pixel intensity by computing the average Venus and GAD65 levels for the same ROIs overlaid on control sections treated with sense probes for GAD65 and no primary antibody. A cell in slides treated with antisense GAD65 probes was determined to be positive if the mean intensity in the ROI exceeded the mean plus 2.5 SDs of the background fluorescence level.
To test whether a probe for VGLUT1 and VGLUT2 and Venus labeled the same or a different population of cells, we defined ROIs around cells classified as “VGLUT ” or “Venus ” based on visualization of their fluorescence levels. We then calculated the mean fluorescence levels for VGLUT (Alexa 488) and Venus (Cy3) in VGLUT cells and Venus cells. Background was determined by transposing ROIs within the glomerular neuropil of our sense probe control slices. We determined that the VGLUT level in all Venus cells was less than the mean minus 1 SD of the VGLUT levels in VGLUT cells. Likewise, the Venus level in all VGLUT cells was less than the mean minus 1 SD of the Venus level in Venus cells. This analysis provided strong evidence that the VGLUT probes and anti-GFP antibody labeled separate cells.
Results
Lateral inhibition of glomeruli
To test for interglomerular lateral inhibition, we used a dual-stimulation paradigm that included “test” stimulation of OSNs at the target glomerulus of a MC and a “conditioning” stimulus of another glomerulus located ≥200 μm away (Fig. 1A). The effect of the conditioning stimulus (300 μA, 100 μs) was tested on the ability of a weak-to-moderate intensity test stimulus (7–35 μA, 100 μs) to evoke excitation of MCs. MC excitation was monitored indirectly by performing voltage-clamp recordings (Vhold = −77 mV) of excitatory currents that underlie the LLD (Carlson et al., 2000). LLDs, which dominate the MC response to OSN stimulation and resemble natural odorant responses (Margrie and Schaefer, 2003), are regenerative, glomerular network-wide events lasting a few hundred milliseconds, and MC spiking, recorded in the cell-attached configuration, is perfectly correlated with the LLD (Gire and Schoppa, 2009). Thus, whole-cell measurements of the LLD current provided a convenient way to assess the status of excitation of an entire glomerulus, while also allowing us to determine visually the target glomeruli of the test MCs (using Alexa 488 in the whole-cell patch pipette). Experimental trials that included a conditioning stimulus were interleaved with trials containing a test pulse only to avoid run-down artifacts.
When the conditioning stimuli preceded test stimuli by 20 ms, we often observed robust lateral inhibition, as evidenced by suppression of the MC excitatory current (24 ± 4% decrease in integrated current; n = 27; p = 3 × 10⁻⁶; Fig. 1B,C). The amount of lateral inhibition varied considerably between experiments, but most MCs (20 of 27) displayed some level of it, as defined by a ≥10% decrease in the excitatory current (see Materials and Methods). In 11 cells, recordings were made in a sufficient number of trials to observe an unambiguous bimodal response distribution consisting of LLD event successes and failures, reflecting the all-or-none nature of the LLD (Carlson et al., 2000; Gire and Schoppa, 2009). In this subset of experiments, the conditioning prepulse decreased LLD probability from 94 ± 3 to 45 ± 9% (p = 0.0005). The reduction in LLD probability was also associated with a decrease in the number of MC spikes evoked by test stimulation (Fig. 1D; 54 ± 4% reduction in 3 MCs that also displayed LLD suppression, p = 0.03; spikes measured in 500 ms window after test stimulation, ≥8 trials per condition per cell). Lateral inhibition required activation of GABAA receptors, as conditioning stimuli were completely ineffective in suppressing the LLD when recordings were performed in the presence of the GABAA receptor antagonist gabazine (10 μm; 18 ± 9% increase in excitatory current, p = 0.13, in 5 MCs that showed clear LLD inhibition in the absence of gabazine; Fig. 1B). All but 1 of the 27 MC recordings were done in the presence of the GABAB receptor antagonist CGP55845 [(2S)-3-[[(1S)-1-(3,4-dichlorophenyl)ethyl]amino-2-hydroxypropyl](phenylmethyl)phosphinic acid] (2 μm), ruling out involvement of GABAB receptor-mediated presynaptic inhibition (Wachowiak et al., 2005; Vucinić et al., 2006).
When our experimental set of 27 test MCs was further divided by the spatial separation between the conditioning and test stimulation sites, we found that lateral inhibition was modestly correlated with distance (R2 = 0.20; p = 0.02; Fig. 1E). Suppression occurred at distances up to ∼600 μm, but not at distances ≥800 μm away (∼10 glomeruli). This distance dependence of lateral inhibition could reflect the morphologies of the cells mediating the suppression or, potentially, cutting artifacts in the brain slices. The extent of lateral inhibition also depended on the time interval between the conditioning and test stimuli (Fig. 1F,G). Significant interglomerular inhibition was observed when we expanded the interval from 20 to 50 ms (12 ± 5% inhibition; n = 10; p = 0.03), although the degree of inhibition was less than for a 20 ms interval (p = 0.01).
These experiments, using conditioning and test stimuli at different glomeruli, provided good evidence for interglomerular lateral inhibition that depended on glomerular separation and timing. It was very unlikely that the observed effects reflected local intraglomerular mechanisms of suppressing LLDs (Gire and Schoppa, 2009) that were inadvertently activated by the conditioning stimuli, as we took several steps to ensure that our conditioning stimuli did not activate OSN axons-of-passage that could terminate at target glomeruli. These included placing the stimulating electrode directly onto a glomerulus instead of the ON layer, making microsurgical cuts through the ON layer between the conditioning and test stimuli in most experiments (Fig. 1B; see summary in Fig. 1E), and always placing the conditioning electrode caudal with respect to the test glomeruli (OSN axons traverse the bulb from rostral to caudal). That the observed inhibitory effects were due to interglomerular rather than intraglomerular mechanisms was also strongly supported by parallel recordings that were done in ET cells with cell bodies located in the glomerular layer. Prior studies (Gire et al., 2012) have shown that direct stimulation of OSNs with an electrode placed near a target glomerulus always results in large-amplitude, fast-onset (<4 ms) EPSCs in ET cells (average amplitude, −238 pA in 13 ET cells), reflecting monosynaptic OSN-to-ET cell transmission (Hayar et al., 2004) (see Fig. 5C). Importantly, we found that our conditioning stimuli at other glomeruli evoked such EPSCs in only 1 of 20 ET cells (and in only one of seven stimulus trials in that 1 cell). The general failure of the conditioning stimuli to evoke OSN-EPSCs in ET cells argued against inadvertent stimulation of OSN axons-of-passage, as we otherwise should have observed significant OSN-EPSCs. In addition to these results supporting an interglomerular inhibitory mechanism, we will also show below with direct recordings of GABAA receptor-mediated inhibitory currents (see Fig. 4) that inhibition at a target glomerulus can be elicited by laser-inducing glutamate uncaging at a conditioning glomerulus, which is a method that avoids stimulation of OSN axons-of-passage.
Lateral inhibition is mediated by a glomerular layer circuit
To understand the GABAergic circuitry driving interglomerular lateral inhibition, we next performed experiments in OB slices with specific bulb layers sectioned between the conditioning and test stimulation sites (Fig. 2). If LLD suppression by the conditioning stimuli was mediated by GABAergic cells in the glomerular layer, a cut through the glomerular layer should abolish the suppression, while a mechanism involving GABAergic GCs predicted a strong effect due to a cut through the EPL, the site of GC contacts onto MCs. In these studies, we found a marked difference in the effect of sectioning through the different layers. Cuts through the glomerular layer abolished the ability of a conditioning stimulus to suppress the LLD (2 ± 2% reduction in current; n = 10; p = 0.6; Fig. 2A,C), consistent with a role for glomerular layer circuitry, while LLD suppression in slices with cuts through the EPL (20 ± 6% decrease in integrated current; n = 13; p = 0.01) was similar to intact slices (p = 0.30; Fig. 2B,C). We also observed suppression of LLDs (≥10% decrease in integrated current) in a similar fraction of MCs (9 of 13) in slices with cuts through the EPL compared with intact slices (20 of 27), further supporting the lack of involvement of GCs.
While these results suggest that the glomerular circuitry is both necessary and sufficient to produce interglomerular lateral inhibition, several control experiments were required to ensure the adequacy of the cuts. For example, the fact that a cut through the glomerular layer abolished lateral inhibition could be explained by a GC-mediated mechanism if the cuts inadvertently extended into the EPL, severing many of the GC–MC connections. This was unlikely based on visual inspection of the cut slices and also because MCs in these slices typically displayed strong, long-lasting IPSCs in response to conditioning stimuli (isolated using Vhold = −7 or +23 mV; in 6 of 10 MCs; Fig. 2A) that presumably had to have been mediated by GCs. In addition, we used fura-2 AM calcium-based imaging (see Materials and Methods) (Fig. 2D,E) to confirm that the ineffectiveness of the cuts through the EPL in abolishing the lateral inhibition was not because the cuts left intact most GC connections. Using stimulus-locked calcium signals as a measure of GC excitation, we found that ∼43% of dye-loaded GCs located on the same side of the cut as the conditioning stimulus electrode were excited by a conditioning stimulus (1110 of 2598 cells responded across five slices), which compared with a value of only ∼9% for GCs located on the opposite side of the cut (202 of 2156 cells). Thus, the cuts through the EPL were effective in removing most of the influence of GCs between the conditioning and test stimulus sites, yet the cuts nevertheless did not impact inhibition of the LLD.
The control experiments in Figure 2 also helped account for one other potential confound in our results implicating a role for the glomerular layer circuitry in suppressing the LLD. Because GC excitation under some conditions is dependent on NMDA receptors (Isaacson and Strowbridge, 1998), GC activation could be a cooperative process that was not effectively driven by our standard single-pulse conditioning stimulus. However, in our studies, GCs did appear to be well excited, based both on the presence of conditioning stimulus-driven IPSCs in MCs in slices with cuts through the GL (Fig. 2A, right), as well as the calcium responses in GCs (Fig. 2D,E; note GCs on same side of cuts as the conditioning stimulus). Thus, GCs were active and eliciting GABAergic signals in MCs, yet this inhibition could not suppress the LLD.
ET cells are the targets of interglomerular lateral inhibition
We next sought to establish the exact GABAergic circuit path within the glomerular layer that led to lateral inhibition of the LLD. Our first objective was to identify the cell target of the GABAA receptor-mediated synaptic inputs (Fig. 3). The observed suppression of LLDs in MCs could be accomplished by GABAergic synapses targeted onto the apical dendritic tufts of the MCs themselves (Fig. 3A, option 1), but MC LLDs could also be suppressed by GABAergic input targeted onto ET cells (Fig. 3A, option 2). ET cells have been demonstrated to be critical regulators of glomerular activation (De Saint Jan et al., 2009; Najac et al., 2011; Gire et al., 2012), acting as a part of a multistep excitatory signaling path between OSNs and MCs. Inhibition targeted onto ET cells could thus suppress the excitation of MCs initiated by OSN stimulation.
To determine the cell targets of the GABAergic inputs that underlie lateral inhibition in the glomerular layer, our first strategy was to ask which cell, ET cells or MCs, displayed prominent IPSCs evoked by a conditioning stimulus and mediated by the glomerular circuitry (Fig. 3B; isolated at Vhold = −7 mV in all ET cell recordings, −7 mV or +23 mV in MC recordings). For MC recordings, we ensured that any observed IPSC was in the glomerular layer by performing recordings in slices with cuts through the EPL between the site of the conditioning stimulus and the test MC. ET cells lack lateral dendrites, and, so, IPSCs in these cells had to be in the glomerular layer; we confirmed the GABAergic identity of evoked signals in ET cells by their sensitivity to gabazine (10 μm; n = 3). Because MC recordings were often noisy, with numerous spontaneously occurring IPSCs, an across-trial statistical analysis on the individual recordings was performed to determine whether there were evoked IPSCs (see Materials and Methods). We found marked differences in whether the conditioning stimuli could evoke IPSCs in the two cell types, with 19 of 20 ET cells, but only 6 of 23 MCs, showing evoked IPSCs. That evoked IPSCs in MCs were much less prominent than in ET cells was also confirmed by comparing the average baseline-subtracted inhibitory current in the two cell groups (957 ± 172 pA · ms in ET cells, n = 20; 385 ± 170 pA · ms in MCs, n = 19; p = 0.023; −7 mV holding potential data only; Fig. 3C). Furthermore, the timing of the evoked IPSC in the ET cell was more consistent with the timing of interglomerular inhibition of the MC LLD that we observed, which decayed between 20 and 50 ms (Fig. 1G). The IPSC in ET cells was a transient response that decayed across a 100 ms window after the stimulus (Fig. 3B,D), while the IPSC in MCs, in cells that had them, was much more sustained. The IPSP in ET cells evoked by conditioning stimuli (Fig. 3E) was also short in duration (half-width, 31 ± 5; n = 6) and superimposed quite well with the time course of LLD inhibition (Fig. 3F).
We also tested for IPSCs in ET cells and MCs using a conditioning stimulus that involved laser-evoked glutamate uncaging at a glomerulus (35 μm laser spot) (see Materials and Methods) (Fig. 4A). Uncaging, which was done in a solution that contained 100 μm MNI caged glutamate, had the advantage of allowing us to sample a larger number of stimulus locations for any given test cell (average of 3.2 spots per ET cell, 5 spots per MC). Uncaging also avoided possible stimulation of OSN axons-of-passage at conditioning glomeruli. Using a statistical analysis similar to that used above for IPSCs evoked by electrical stimulation, we found that uncaging at conditioning glomeruli evoked IPSCs in 15 of 38 ET cell–spot pairs (Fig. 4B,C; average integrated current, 490 ± 163 pA · ms; n = 38), but in only 3 of 45 MC–spot pairs (average integrated current, 8 ± 39 pA · ms; n = 45). That the glutamate transient evoked by uncaging was spatially restricted and not impinging on the target glomerulus of the test ET cells and MCs was confirmed by testing for glutamate-evoked excitatory currents in MCs and ET cells (recorded at Vhold = −77 mV) while uncaging glutamate at various distances from the target glomerulus of the test cells (Fig. 4D,E). Such excitatory currents were never observed (n = 6 MCs and 2 ET cells) when the uncaging spot was located ≥75 μm from the target glomeruli, which is a far shorter distance than the minimal separation between conditioning and target glomeruli in the uncaging experiments (200 μm).
One explanation for the much smaller glomerular layer IPSC in MCs compared with ET cells was filtering due to the long MC apical dendrite. However, in published dual-site recordings of EPSPs that originated in the glomerulus (Urban and Sakmann, 2002), dendritic signals near the apical glomerular tuft were only ∼37% larger than somatic signals; moreover, LLDs, which originate in the glomerulus, have indistinguishable amplitudes in the cell bodies of MCs versus ET cells (Gire et al., 2012). Thus, filtering effects of the apical dendrite are modest and likely cannot explain the large differences in the MC and ET cell IPSCs that we observed. It is also noteworthy that there were some differences observed in the IPSC measurements done when the conditioning stimulus was electrical stimulation of glomeruli (Fig. 3) versus uncaging (Fig. 4). IPSCs in MCs occurred in nearly one-quarter of the MCs with electrical stimulation compared with ∼7% with uncaging, and IPSCs evoked by electrical stimulation were larger in both ET cells and MCs. These differences likely reflected the stronger stimulus provided by electrical stimulation. While uncaging elicited a glutamate transient that was likely confined to one glomerulus, electrical stimulation likely activated more than one glomerulus at the relatively high stimulus intensities that we used (300 μA). The important point, however, was that, with both methods, ET cells received much stronger inhibitory synaptic inputs than MCs. This result, together with the fact that inhibition in ET cells had a time course that more closely matched the time course of LLD inhibition, supports the conclusion that interglomerular lateral inhibition is mainly mediated by inhibitory inputs onto ET cells.
Interglomerular lateral inhibition is delivered by GABAergic SA cells
Our final goal was to determine which cells in the glomerular layer provided the inhibitory input onto ET cells. Two possibilities (illustrated in Fig. 5A) included (1) GABAergic short axon (SA) cells that span across multiple glomeruli and directly synapse onto ET cells or (2) GABAergic PG cells localized at the target glomerulus. In the latter case, the PG cells would be excited by glutamatergic SA cells. The available evidence suggests that SA cells in the glomerular layer could be glutamatergic (Aungst et al., 2003; Brill et al., 2009) or GABAergic (Kiyokage et al., 2010).
To distinguish between the two mechanisms in Figure 5A, we recorded IPSCs evoked by a conditioning stimulus in ET cells (uncaging in these studies) and tested the impact of puff-applied glutamate receptor antagonists (NBQX, 20 μm; dl-APV, 100 μm) on the target glomeruli of the test ET cells (Fig. 5B). A mechanism involving direct GABAergic inputs onto ET cells from GABAergic SA cells predicted that the IPSC should be unaffected by the antagonists. In contrast, the multistep mechanism involving glutamatergic SA cells and PG cells predicted block of the IPSC, since a key step in driving inhibition is glutamatergic excitation of PG cells at the target glomerulus. We found that the puffs in fact did not affect the lateral IPSCs (5 ± 3% increase in integrated current; n = 5; p = 0.42; Fig. 5B,D), supporting a mechanism involving direct inputs onto ET cells from GABAergic SA cells. Importantly, the lack of effectiveness of the puffs in blocking the IPSC was not due to poor penetration of the antagonists at the target glomerulus, as the puffs were largely effective in blocking the monosynaptic EPSC in the ET cell evoked by electrical stimulation of OSNs at the target glomerulus (20–40 μA, 100 μs; 81 ± 4% decrease in integrated current; n = 5; p = 0.04; Fig. 5C,D). Further arguing that the ET cell IPSC resulted from direct inputs from GABAergic SA cells was the relatively short onset latency of the IPSC evoked by electrical stimulation at a conditioning glomerulus (Fig. 5E). Across 19 cells, the average onset latency was 4.1 ± 0.7 ms, with 5 cells showing latencies <3 ms. Cells with somewhat longer latencies could have reflected the spike transmission time down SA cell axons or the fact that SA cells at the conditioning glomeruli may not have been activated directly by the stimulating electrode but rather through a polysynaptic mechanism.
While the results above, especially the lack of an effect of the GluR antagonist puffs on the ET cell IPSC, argued strongly that the lateral IPSC in ET cells was due to direct inputs from GABAergic SA cells (Fig. 5A, option 1), we also wanted to test more directly for a multisynaptic path of inhibition involved glutamatergic SA cells and PG cells, given prior evidence for glutamatergic SA cells (Aungst et al., 2003; Brill et al., 2009). For this analysis (Fig. 6), we used a fura-2 AM-based calcium imaging approach, asking whether we could observe excitation of PG cells at one glomerulus due to stimulation at another glomerulus. Experiments were done in VGAT-Venus transgenic rats (Uematsu et al., 2008), where we could use the Venus signal, along with analysis of cell body diameter (6–8 μm for PG cells), to help identify GABAergic PG cells. We confirmed, using in situ hybridization methods, that Venus fluorescence was present in GAD65-positive PG cells in the glomerular layer (Venus in 92% of 229 GAD65-positive cells across four sections; Fig. 6A–C) (Kiyokage et al., 2010) and was not in cells expressing the vesicular glutamate transporter isoforms 1 and 2 (74 cells across three sections). We also confirmed the PG cell identity anatomically, based on their small dendritic arbor, in some of the responsive cells (n = 3) by performing whole-cell recordings with Alexa 488-containing dye in the patch pipette subsequent to the imaging. We found that conditioning electrical stimulation excited far more Venus-positive PG cells at the conditioning glomerulus (5.9 ± 1.2 cells per glomerulus; 9 glomeruli in 9 slices; Fig. 6D,E), compared with remote glomeruli located two to six glomeruli away (1.0 ± 0.2 cells per glomerulus; 49 glomeruli in 11 slices; p < 0.001). Most distant glomeruli (33 of 49) had no responsive Venus-positive PG cells (Fig. 6F). Moreover, even when responses were observed, they typically were much smaller in magnitude than those observed in glomeruli near the stimulating pipette (Fig. 6E) and much smaller than GC responses observed in studies of sectioned slices (Fig. 2E). These results are consistent with glutamatergic SA cells, if they exist, providing only very weak interglomerular excitatory signals onto PG cells, further supporting a model of lateral inhibitory signaling that involves GABAergic SA cells.
Discussion
An important feature of the anatomy of the olfactory bulb is the organization of the output MCs by OR-specific glomeruli. In this study, we used electrophysiological and imaging methods in rat bulb slices to test for lateral inhibition between glomeruli, as well as its underlying mechanisms.
Interglomerular lateral inhibition in olfactory bulb
We obtained strong evidence for interglomerular lateral inhibition, as observed as a conditioning stimulus-induced decrease in the LLD and spike activity in MCs. The effect of the conditioning stimulus on the LLD, which was most commonly examined, was quite variable, with only 9 of 27 MCs showing a >30% decrease. The electrical conditioning stimuli nearly always evoked a GABAergic current at target glomeruli (in 19 of 20 ET cells), so the small effect seen on the LLD in some experiments was not due to the absence of inhibition but rather because inhibition was too weak to counteract the powerful regenerative excitatory events that underlie an LLD. In the natural situation, odor activates many glomeruli across the surface of the bulb (Rubin and Katz, 1999; Bozza and Mombaerts, 2001), and, so, suppression of MC activity would likely be stronger.
While it has long been thought that lateral inhibition between glomeruli is one of the principal functional mechanisms operating in the bulb (Mori et al., 1999; Shepherd et al., 2004), the evidence supporting its existence has been modest, and our study here provides arguably the best demonstration of interglomerular lateral inhibition to date. Two prior studies showed that stimulation of a conditioning glomerulus can suppress an LLD at another glomerulus (Aungst et al., 2003; Shirley et al., 2010), as we did, but an important difference was in the timing of the effect. The prior studies reported lateral inhibition only when a conditioning stimulus was applied 150 ms or longer after a test stimulus, while inhibition of the LLD in our study occurred with conditioning stimuli applied at short intervals (20–50 ms) before a test stimulus. This fast timescale indicates that the interglomerular inhibition that we observed should be quite effective over the short time of a single inhalation cycle (Scott, 2006; Wachowiak, 2011). The timing also fits with what is known about activation times for different glomeruli, which can vary between 10 and 100 ms (Spors et al., 2006; Carey et al., 2009). Arevian et al. (2008) reported that glomerular stimulation could reduce MC spiking at another glomerulus by ∼20% at some spike frequencies in experiments in which spiking was evoked by direct MC depolarization; it is unclear whether they ever observed near-complete suppression of MC excitation as we sometimes did.
A major objective of future studies will be to define the function of interglomerular lateral inhibition during odor-evoked responses. One possible function is contrast enhancement, where suppression of weakly activated glomeruli by strongly activated ones enhances differences in signals for similar odors (Yokoi et al., 1995; Arevian et al., 2008; Giridhar et al., 2011). There is some reason, however, to question how important interglomerular lateral inhibition would be for olfactory contrast enhancement, since, unlike other sensory systems, there is only a weak spatial ordering of neurons by functional type in the bulb (Fantana et al., 2008; Soucy et al., 2009; Ma et al., 2012). Glomeruli do appear to be coarsely ordered across several hundred micrometers (Mori et al., 2006; Soucy et al., 2009), and, so, it is possible that interglomerular lateral inhibition acts on this broader spatial dimension to enhance contrast. Such a mechanism, perhaps acting in conjunction with local intraglomerular mechanisms of contrast enhancement (Cleland and Sethupathy, 2006), would fit with the relatively long axonal arbor of the SA cells that mediated interglomerular lateral inhibition in our studies (spanning as much as 1000 μm) (Aungst et al., 2003) and also the spatial range over which we observed interglomerular lateral inhibition (up to ∼600 μm; Fig. 1E). Alternatively, lateral inhibition could impart a temporal component to the MC response (Spors and Grinvald, 2002; Bathellier et al., 2008; Cury and Uchida, 2010; Shusterman et al., 2011; Phillips et al., 2012) or act as a mechanism to normalize the MC response to differences in odor concentration (Linster and Cleland, 2009). The inhibition that we observed, occurring during a simple dual stimulation paradigm, could represent a small part of an episode of “global” inhibition that leads to such a normalizing effect.
Circuit mediating interglomerular lateral inhibition
Based on experiments in which either the glomerular layer or EPL was sectioned, we determined that circuitry within the glomerular layer is necessary and sufficient for interglomerular lateral inhibition. A similar result with sectioning was also obtained in the study by Shirley et al. (2010) for the form of interglomerular lateral inhibition that they studied. This conclusion—that the glomerular layer mediates interglomerular lateral inhibition—differs from the commonly held view that GABAergic GCs mediate lateral inhibition in the bulb (Schoppa and Urban, 2003; Shepherd et al., 2004; Urban and Arevian, 2009). Our conclusion does, however, fit with what is known about the LLD event that dominates the MC response to OSN inputs. The LLD is generated by a series of regenerative events within a glomerulus, and so inhibition targeted onto the site of regenerative excitation might naturally be expected to be most effective in suppressing excitation. Also, at least one of the subpopulations of tufted cells—the ET cells—that play an important role in generating the LLD (Najac et al., 2011; Gire et al., 2012) do not form connections with GCs. Certainly, it is possible that GCs have a more important role in suppressing the LLD in the in vivo situation compared with slices, when the complete circuitry is intact. For example, glutamatergic cortical feedback fibers targeted onto GCs (Balu et al., 2007) could enhance the function of GCs in suppressing the LLD. GCs could also have roles in inhibiting MCs that are independent of the LLD. The LLD appears to be important in determining whether or not MCs spike in response to OSN inputs (Gire and Schoppa, 2009), yet GC inputs could affect the number of MC spikes. Effects on MC spike frequency attributed to GC inputs have been reported in experiments in which MCs were activated by direct current injection into their cell bodies (Arevian et al., 2008).
It appears that the main circuit path leading to interglomerular lateral inhibition involves GABAergic SA cells (Kiyokage et al., 2010) that synapse onto ET cells. The evidence that GABAergic SA cells have a dominant role in lateral inhibition was quite conclusive, being based on the observation that local application of glutamatergic receptor antagonists at a target glomerulus failed to reduce the IPSC evoked by a conditioning stimulus. These results do not exclude the possibility that a separate population of glutamatergic SA cells exist (Aungst et al., 2003; Brill et al., 2009), with perhaps a different function, or cells that corelease glutamate and GABA. Interestingly, we did obtain some evidence consistent with the presence of glutamatergic SA cells, based on weak evoked calcium signals in PG cells (Fig. 6) and a delayed EPSP evoked by conditioning stimuli in ET cells (Fig. 3E). That tufted cells were the major recipient of lateral inhibitory inputs was not surprising, based on evidence that these cells play a major role in multistep excitation between OSNs and MCs (De Saint Jan et al., 2009; Najac et al., 2011; Gire et al., 2012). Moreover, during local intraglomerular inhibition, GABAergic inputs that lead to suppression of LLDs are located exclusively on tufted cells (Gire and Schoppa, 2009).
In a broader context, our results make a strong case for a circuit model of the olfactory bulb in which different specific functions are accomplished within discrete layers. Whereas our experiments provided evidence that suppression of MC spiking across glomeruli is mainly if not entirely accomplished by mechanisms within the glomerular layer, GABAergic GC-to-MC synaptic contacts within the EPL appear to be mainly responsible for fast timescale neural synchrony during gamma frequency (30–70 Hz) oscillations (Rall and Shepherd, 1968; Kashiwadani et al., 1999; Friedman and Strowbridge, 2003; Lagier et al., 2004; Galán et al., 2006; Schoppa, 2006). This fast oscillatory activity appears in slice recordings superimposed on the slow-occurring LLD that controls whether there are any MC spikes. Having two disparate functions of the bulb—lateral inhibition and spike synchronization—be accomplished by different GABAergic cell types could be important because it allows for independent regulation. If one considers a situation in which a single cell type, the GCs, controlled both lateral inhibition and synchrony, any regulatory mechanism that reduces GABA release from GCs would reduce both lateral inhibition and synchrony, resulting in net opposite effects on the strength of the MC signal sent to the olfactory cortex (an increase, due to reduced lateral inhibition, and a decrease, due to reduced summation of EPSPs by synchronous inputs). Such a regulatory effect might be difficult for the olfactory cortex to interpret, and can be avoided by having spike number and synchrony regulated by discrete GABAergic cells.
Footnotes
This work was supported by funding from NIH Grants T32-NS007083, F31-DC011202 (J.D.W.), R01-DK0798749 (S.T.H.), R01-DC006640 (N.E.S.), and P30-DC004657 (Rocky Mountain Taste and Smell Center). We thank Dr. Yuchio Yanagawa (Gunma University Graduate School of Medicine, Showa-machi, Maebashi, Japan) for providing the VGAT-Venus transgenic rats; and Drs. Tom Finger, David Gire, and Diego Restrepo (University of Colorado, Anschutz Medical Campus) for helpful discussions.
The authors declare no competing financial interests.
References
- Arevian AC, Kapoor V, Urban NN. Activity-dependent gating of lateral inhibition in the mouse olfactory bulb. Nat Neurosci. 2008;11:80–87. doi: 10.1038/nn2030. [DOI] [PMC free article] [PubMed] [Google Scholar]
- Aungst JL, Heyward PM, Puche AC, Karnup SV, Hayar A, Szabo G, Shipley MT. Centre-surround inhibition among olfactory bulb glomeruli. Nature. 2003;426:623–629. doi: 10.1038/nature02185. [DOI] [PubMed] [Google Scholar]
- Balu R, Pressler RT, Strowbridge BW. Multiple modes of synaptic excitation of olfactory bulb granule cells. J Neurosci. 2007;27:5621–5632. doi: 10.1523/JNEUROSCI.4630-06.2007. [DOI] [PMC free article] [PubMed] [Google Scholar]
- Bathellier B, Buhl DL, Accolla R, Carleton A. Dynamic ensemble odor coding in the mammalian olfactory bulb: sensory information at different timescales. Neuron. 2008;57:586–598. doi: 10.1016/j.neuron.2008.02.011. [DOI] [PubMed] [Google Scholar]
- Bozza TC, Mombaerts P. Olfactory coding: revealing intrinsic representations of odors. Curr Biol. 2001;11:R687–R690. doi: 10.1016/s0960-9822(01)00409-2. [DOI] [PubMed] [Google Scholar]
- Brill MS, Ninkovic J, Winpenny E, Hodge RD, Ozen I, Yang R, Lepier A, Gascón S, Erdelyi F, Szabo G, Parras C, Guillemot F, Frotscher M, Berninger B, Hevner RF, Raineteau O, Götz M. Adult generation of glutamatergic olfactory bulb interneurons. Nat Neurosci. 2009;12:1524–1533. doi: 10.1038/nn.2416. [DOI] [PMC free article] [PubMed] [Google Scholar]
- Buonviso N, Chaput MA. Response similarity to odors in olfactory bulb output cells presumed to be connected to the same glomerulus: electrophysiological study using simultaneous single-unit recordings. J Neurophysiol. 1990;63:447–454. doi: 10.1152/jn.1990.63.3.447. [DOI] [PubMed] [Google Scholar]
- Carey RM, Verhagen JV, Wesson DW, Pírez N, Wachowiak M. Temporal structure of receptor neuron input to the olfactory bulb imaged in behaving rats. J Neurophysiol. 2009;101:1073–1088. doi: 10.1152/jn.90902.2008. [DOI] [PMC free article] [PubMed] [Google Scholar]
- Carlson GC, Shipley MT, Keller A. Long-lasting depolarizations in mitral cells of the rat olfactory bulb. J Neurosci. 2000;20:2011–2021. doi: 10.1523/JNEUROSCI.20-05-02011.2000. [DOI] [PMC free article] [PubMed] [Google Scholar]
- Cleland TA, Sethupathy P. Non-topographical contrast enhancement in the olfactory bulb. BMC Neurosci. 2006;7:7. doi: 10.1186/1471-2202-7-7. [DOI] [PMC free article] [PubMed] [Google Scholar]
- Cury KM, Uchida N. Robust odor coding via inhalation-coupled transient activity in the mammalian olfactory bulb. Neuron. 2010;68:570–585. doi: 10.1016/j.neuron.2010.09.040. [DOI] [PubMed] [Google Scholar]
- De Saint Jan D, Hirnet D, Westbrook GL, Charpak S. External tufted cells drive the output of olfactory bulb glomeruli. J Neurosci. 2009;29:2043–2052. doi: 10.1523/JNEUROSCI.5317-08.2009. [DOI] [PMC free article] [PubMed] [Google Scholar]
- Fantana AL, Soucy ER, Meister M. Rat olfactory bulb mitral cells receive sparse glomerular inputs. Neuron. 2008;59:802–814. doi: 10.1016/j.neuron.2008.07.039. [DOI] [PubMed] [Google Scholar]
- Friedman D, Strowbridge BW. Both electrical and chemical synapses mediate fast network oscillations in the olfactory bulb. J Neurophysiol. 2003;89:2601–2610. doi: 10.1152/jn.00887.2002. [DOI] [PubMed] [Google Scholar]
- Galán RF, Fourcaud-Trocmé N, Ermentrout GB, Urban NN. Correlation-induced synchronization of oscillations in olfactory bulb neurons. J Neurosci. 2006;26:3646–3655. doi: 10.1523/JNEUROSCI.4605-05.2006. [DOI] [PMC free article] [PubMed] [Google Scholar]
- Gire DH, Schoppa NE. Control of on/off glomerular signaling by a local GABAergic microcircuit in the olfactory bulb. J Neurosci. 2009;29:13454–13464. doi: 10.1523/JNEUROSCI.2368-09.2009. [DOI] [PMC free article] [PubMed] [Google Scholar]
- Gire DH, Franks KM, Zak JD, Tanaka KF, Whitesell JD, Mulligan AA, Hen R, Schoppa NE. Mitral cells in the olfactory bulb are mainly excited through a multistep signaling path. J Neurosci. 2012;32:2964–2975. doi: 10.1523/JNEUROSCI.5580-11.2012. [DOI] [PMC free article] [PubMed] [Google Scholar]
- Giridhar S, Doiron B, Urban NN. Timescale-dependent shaping of correlation by olfactory bulb lateral inhibition. Proc Natl Acad Sci U S A. 2011;108:5843–5848. doi: 10.1073/pnas.1015165108. [DOI] [PMC free article] [PubMed] [Google Scholar]
- Hayar A, Karnup S, Ennis M, Shipley MT. External tufted cells: a major excitatory element that coordinates glomerular activity. J Neurosci. 2004;24:6676–6685. doi: 10.1523/JNEUROSCI.1367-04.2004. [DOI] [PMC free article] [PubMed] [Google Scholar]
- Isaacson JS, Strowbridge BW. Olfactory reciprocal synapses; dendritic signaling in the CNS. Neuron. 1998;20:749–761. doi: 10.1016/s0896-6273(00)81013-2. [DOI] [PubMed] [Google Scholar]
- Jarvie BC, Hentges ST. Expression of GABAergic and glutamatergic phenotypic markers in hypothalamic proopiomelanocortin neurons. J Comp Neurol. 2012;520:3863–3876. doi: 10.1002/cne.23127. [DOI] [PMC free article] [PubMed] [Google Scholar]
- Kashiwadani H, Sasaki YF, Uchida N, Mori K. Synchronized oscillatory discharges of mitral/tufted cells with different molecular receptive ranges in the rabbit olfactory bulb. J Neurophysiol. 1999;82:1786–1792. doi: 10.1152/jn.1999.82.4.1786. [DOI] [PubMed] [Google Scholar]
- Kiyokage E, Pan YZ, Shao Z, Kobayashi K, Szabo G, Yanagawa Y, Obata K, Okano H, Toida K, Puche AC, Shipley MT. Molecular identity of periglomerular and short axon cells. J Neurosci. 2010;30:1185–1196. doi: 10.1523/JNEUROSCI.3497-09.2010. [DOI] [PMC free article] [PubMed] [Google Scholar]
- Kuffler SW. Discharge patterns and functional organization of mammalian retina. J Neurophysiol. 1953;16:37–68. doi: 10.1152/jn.1953.16.1.37. [DOI] [PubMed] [Google Scholar]
- Lagier S, Carleton A, Lledo PM. Interplay between local GABAergic interneurons and relay neurons generates gamma oscillations in the rat olfactory bulb. J Neurosci. 2004;24:4382–4392. doi: 10.1523/JNEUROSCI.5570-03.2004. [DOI] [PMC free article] [PubMed] [Google Scholar]
- Linster C, Cleland TA. Glomerular microcircuits in the olfactory bulb. Neural Netw. 2009;22:1169–1173. doi: 10.1016/j.neunet.2009.07.013. [DOI] [PMC free article] [PubMed] [Google Scholar]
- Ma L, Qiu Q, Gradwohl S, Scott A, Yu EQ, Alexander R, Wiegraebe W, Yu CR. Distributed representation of chemical features and tunotopic organization of glomeruli in the mouse olfactory bulb. Proc Natl Acad Sci U S A. 2012;109:5481–5486. doi: 10.1073/pnas.1117491109. [DOI] [PMC free article] [PubMed] [Google Scholar]
- Margrie TW, Schaefer AT. Theta oscillation coupled spike latencies yield computational vigour in a mammalian sensory system. J Physiol. 2003;546:363–374. doi: 10.1113/jphysiol.2002.031245. [DOI] [PMC free article] [PubMed] [Google Scholar]
- McGann JP, Pírez N, Gainey MA, Muratore C, Elias AS, Wachowiak M. Odorant representations are modulated by intra- but not interglomerular presynaptic inhibition of olfactory sensory neurons. Neuron. 2005;48:1039–1053. doi: 10.1016/j.neuron.2005.10.031. [DOI] [PubMed] [Google Scholar]
- Mori K, Nagao H, Yoshihara Y. The olfactory bulb: coding and processing of odor molecule information. Science. 1999;286:711–715. doi: 10.1126/science.286.5440.711. [DOI] [PubMed] [Google Scholar]
- Mori K, Takahashi YK, Igarashi KM, Yamaguchi M. Maps of odorant molecular features in the mammalian olfactory bulb. Physiol Rev. 2006;86:409–433. doi: 10.1152/physrev.00021.2005. [DOI] [PubMed] [Google Scholar]
- Najac M, De Saint Jan D, Reguero L, Grandes P, Charpak S. Monosynaptic and polysynaptic feed-forward inputs to mitral cells from olfactory sensory neurons. J Neurosci. 2011;31:8722–8729. doi: 10.1523/JNEUROSCI.0527-11.2011. [DOI] [PMC free article] [PubMed] [Google Scholar]
- Phillips ME, Sachdev RN, Willhite DC, Shepherd GM. Respiration drives network activity and modulates synaptic and circuit processing of lateral inhibition in the olfactory bulb. J Neurosci. 2012;32:85–98. doi: 10.1523/JNEUROSCI.4278-11.2012. [DOI] [PMC free article] [PubMed] [Google Scholar]
- Pinching AJ, Powell TP. The neuron types of the glomerular layer of the olfactory bulb. J Cell Sci. 1971;9:305–345. doi: 10.1242/jcs.9.2.305. [DOI] [PubMed] [Google Scholar]
- Rall W, Shepherd GM. Theoretical reconstruction of field potentials and dendrodendritic synaptic interactions in the olfactory bulb. J Neurophysiol. 1968;31:884–915. doi: 10.1152/jn.1968.31.6.884. [DOI] [PubMed] [Google Scholar]
- Rubin BD, Katz LC. Optical imaging of odorant representations in the mammalian olfactory bulb. Neuron. 1999;23:499–511. doi: 10.1016/s0896-6273(00)80803-x. [DOI] [PubMed] [Google Scholar]
- Schoppa NE. Synchronization of olfactory bulb mitral cells by precisely timed inhibitory inputs. Neuron. 2006;49:271–283. doi: 10.1016/j.neuron.2005.11.038. [DOI] [PubMed] [Google Scholar]
- Schoppa NE, Urban NN. Dendritic processing within olfactory bulb circuits. Trends Neurosci. 2003;26:501–506. doi: 10.1016/S0166-2236(03)00228-5. [DOI] [PubMed] [Google Scholar]
- Scott JW. Sniffing and spatiotemporal coding in olfaction. Chem Senses. 2006;31:119–130. doi: 10.1093/chemse/bjj013. [DOI] [PMC free article] [PubMed] [Google Scholar]
- Shao Z, Puche AC, Liu S, Shipley MT. Intraglomerular inhibition shapes the strength and temporal structure of glomerular output. J Neurophysiol. 2012;108:782–793. doi: 10.1152/jn.00119.2012. [DOI] [PMC free article] [PubMed] [Google Scholar]
- Shepherd GM, Chen WR, Greer CA. Olfactory bulb. In: Shepherd GM, editor. The synaptic organization of the brain. New York: Oxford UP; 2004. pp. 165–216. [Google Scholar]
- Shirley CH, Coddington EJ, Heyward PM. All-or-none population bursts temporally constrain surround inhibition between mouse olfactory glomeruli. Brain Res Bull. 2010;81:406–415. doi: 10.1016/j.brainresbull.2009.10.022. [DOI] [PubMed] [Google Scholar]
- Shusterman R, Smear MC, Koulakov AA, Rinberg D. Precise olfactory responses tile the sniff cycle. Nat Neurosci. 2011;14:1039–1044. doi: 10.1038/nn.2877. [DOI] [PubMed] [Google Scholar]
- Soucy ER, Albeanu DF, Fantana AL, Murthy VN, Meister M. Precision and diversity in an odor map on the olfactory bulb. Nat Neurosci. 2009;12:210–220. doi: 10.1038/nn.2262. [DOI] [PubMed] [Google Scholar]
- Spors H, Grinvald A. Spatio-temporal dynamics of odor representations in the mammalian olfactory bulb. Neuron. 2002;34:301–315. doi: 10.1016/s0896-6273(02)00644-x. [DOI] [PubMed] [Google Scholar]
- Spors H, Wachowiak M, Cohen LB, Friedrich RW. Temporal dynamics and latency patterns of receptor neuron input to the olfactory bulb. J Neurosci. 2006;26:1247–1259. doi: 10.1523/JNEUROSCI.3100-05.2006. [DOI] [PMC free article] [PubMed] [Google Scholar]
- Tan J, Savigner A, Ma M, Luo M. Odor information processing by the olfactory bulb analyzed in gene-targeted mice. Neuron. 2010;65:912–926. doi: 10.1016/j.neuron.2010.02.011. [DOI] [PMC free article] [PubMed] [Google Scholar]
- Uematsu M, Hirai Y, Karube F, Ebihara S, Kato M, Abe K, Obata K, Yoshida S, Hirabayashi M, Yanagawa Y, Kawaguchi Y. Quantitative chemical composition of cortical GABAergic neurons revealed in transgenic venus-expressing rats. Cereb Cortex. 2008;18:315–330. doi: 10.1093/cercor/bhm056. [DOI] [PubMed] [Google Scholar]
- Urban NN, Arevian AC. Computing with dendrodendritic synapses in the olfactory bulb. Ann N Y Acad Sci. 2009;1170:264–269. doi: 10.1111/j.1749-6632.2009.03899.x. [DOI] [PubMed] [Google Scholar]
- Urban NN, Sakmann B. Reciprocal intraglomerular excitation and intra- and interglomerular lateral inhibition between mouse olfactory bulb mitral cells. J Physiol. 2002;542:355–367. doi: 10.1113/jphysiol.2001.013491. [DOI] [PMC free article] [PubMed] [Google Scholar]
- Vucinić D, Cohen LB, Kosmidis EK. Interglomerular center-surround inhibition shapes odorant-evoked input to the mouse olfactory bulb in vivo. J Neurophysiol. 2006;95:1881–1887. doi: 10.1152/jn.00918.2005. [DOI] [PubMed] [Google Scholar]
- Wachowiak M. All in a sniff: olfaction as a model for active sensing. Neuron. 2011;71:962–973. doi: 10.1016/j.neuron.2011.08.030. [DOI] [PMC free article] [PubMed] [Google Scholar]
- Wachowiak M, McGann JP, Heyward PM, Shao Z, Puche AC, Shipley MT. Inhibition of olfactory receptor neuron input to olfactory bulb glomeruli mediated by suppression of presynaptic calcium influx. J Neurophysiol. 2005;94:2700–2712. doi: 10.1152/jn.00286.2005. [DOI] [PMC free article] [PubMed] [Google Scholar]
- Wellis DP, Scott JW, Harrison TA. Discrimination among odorants by single neurons of the rat olfactory bulb. J Neurophysiol. 1989;61:1161–1177. doi: 10.1152/jn.1989.61.6.1161. [DOI] [PubMed] [Google Scholar]
- Yokoi M, Mori K, Nakanishi S. Refinement of odor molecule tuning by dendrodendritic synaptic inhibition in the olfactory bulb. Proc Natl Acad Sci U S A. 1995;92:3371–3375. doi: 10.1073/pnas.92.8.3371. [DOI] [PMC free article] [PubMed] [Google Scholar]