Abstract
Network-based analysis is indispensable in analyzing high throughput biological data. Based on the assumption that the variation of gene interactions under given biological conditions could be better interpreted in the context of a large-scale and wide variety of developmental, tissue, and disease, we leverage the large quantity of publicly-available transcriptomic data > 40,000 HG U133A Affymetrix microarray chips stored in ArrayExpress (http://www.ebi.ac.uk/arrayexpress/) using MetaOmGraph (http://metnet.vrac.iastate.edu/MetNet_MetaOmGraph.htm). From this data, 18,637 chips encompassing over 500 experiments containing high quality data (18637Hu-dataset) were used to create a globally stable gene co-expression network (18637Hu-co-expression-network). Regulons, groups of highly and consistently co-expressed genes, were obtained by partitioning the 18637Hu-co-expression-network using an MCL clustering algorithm. The regulon were demonstrated to be statistically significant using a gene ontology (GO) term overrepresentation test combined with evaluation of the effects of gene permutations. The regulons include approximately 12% of human genes, interconnected by 31,471 correlations. All network data and metadata is publically available (http://metnet.vrac.iastate.edu/MetNet_MetaOmGraph.htm). Text mining of these metadata, GO term overrepresentation analysis, and statistical analysis of transcriptomic experiments across multiple environmental, tissue, and disease conditions, has revealed novel fingerprints distinguishing central nervous system (CNS)-related conditions. This study demonstrates the value of mega-scale network-based analysis for biologists to further refine transcriptomic data derived from a particular condition, to study the global relationships between genes and diseases, and to develop hypotheses that can inform future research.
Introduction
Gene transcripts with a similar pattern of accumulation across a vast array of organs, cell lines, environmental stimuli, diseases, and genetic conditions are likely to encode proteins that function in a common process, or are regulated by common transcriptional factors. Thus, analysis of transcriptomic data from multiple experiments provides a powerful avenue for identifying prevailing cellular processes, assigning postulated functions to unknown genes, and associating genes with particular biological processes [1–3]. Furthermore, analysis of the network derived from such data can reveal topological properties of the biological system as a whole [4–6].
Human gene co-expression networks to date have been constructed from a relatively small number of representative microarray experiments to achieve particular biological aims. For example, in order to identify genes that might provide useful markers for distinguishing among cancers, Choi et al. [7] analyzed data from ~600 microarray chips across 13 types of cancers. To evaluate the relationship between gene evolution and gene co-expression, human microarray data has also been combined with microarray data from other species. Jordan et al. [8] analyzed data from 63 human and 89 mouse microarray experiments, revealing that genes with multiple co-expression partners evolve more slowly than genes with fewer co-expression partners. Stuart et al. [2], using data of 29 experiments with humans, fly, worm and yeast, showed some gene co-expression networks can be conserved across wide lineages. The sample sizes of transcriptomic datasets in these co-expression network analyses are usually in the tens or hundreds. Given that gene pairs may be correlated in one set of conditions, but not under another, it can be difficult to extrapolate from one experiment to another.
Most previous statistical analyses of transcriptomic data have combined statistics from individual experiments [9]. However, pooling all the disparate samples together could provide a dataset that would enable researchers to view behavior of a gene or groups of genes across a wide variety of conditions. This could facilitate analyses of “fingerprint” of gene expression corresponding to particular conditions. It also could enable a biologist to better understand the genetic and environmental factors that are associated with expression of particular genes. So better interpretation of gene co-expression relationships can be obtained in the context of a larger background with a wide variety of developmental, environmental, disease and genetic conditions.
It is our contention that for increasingly large datasets, the inter-experimental variation will be minimized. Based on this assumption, and considering the significant advantage to having a dataset with co-normalized samples, we leveraged the large quantity of publicly-available transcriptomic data stored in ArrayExpress (http://www.ebi.ac.uk/arrayexpress/), together with versatile bioinformatics software [10], to develop a global human co-expression gene network (18637Hu-co-expression-network) based on co-normalization of data form all samples in all experiments. Three methods were evaluated for their ability to generate functionally cohesive clusters (regulons).
As proof of concept, we identified a regulon-based “fingerprint” associated with CNS-related samples. Of the almost ten thousand samples of varied tissues, cultures, and environmental conditions evaluated in the overall dataset, only those experiments involving the CNS show a high expression of genes in Regulon 56, and this expression is independent of disease state, environmental condition, or the region of CNS. The function of Regulon 56 genes in the CNS was cross-validated using a GO term overrepresentation test, a direct visualization of transcript levels, and the literature. This proof of concept illustrates how this global co-expression network can facilitate development of testable hypotheses about function and connectivity among human genes.
Results
Software development
For efficient analysis at the intended large scale, software capabilities including rapid data download, assessment of replicate quality, normalization, and text mining were required. To implement such data download and processing in a tool that others can use, we added functionality to the MetaOmGraph (MOG) software for omics data analysis [10]. The MOG interface enables a researcher to designate criteria (e.g., species, organ, stress) to select which experiments to download from the ArrayExpress Archive. From this data, MOG generates text files containing microarray gene expression data and XML files containing metadata about the experiments and samples. MOG then normalizes the data, and creates a symmetrical Pearson co-expression matrix for all genes on the microarray. At each step in this process, a user is able to evaluate various aspects of data quality by determining correlation of replicates, visualizing scatterplots of replicates, viewing information on missing probe sets, and generating box plots. Samples can be automatically removed that do not meet user-specified criteria for replicate quality or that have too many genes with missing values. The software also automatically checks for replicates within each experiment. In most cases, this automatic check gives accurate replicate assessment. However, proper identification of replicates depends on the quality of the metadata submission for each experiment. Thus, there is a second phase of manual examination. For those experiments in which the metadata that describes sample replicates is confusing or inaccurate, further manual replicate identification and quality control are required.
Data collection and processing to create the human co-expression network
Our goal was to obtain as much high-quality publicly available microarray data as possible to derive a gene co-expression network. Data from over 800 experiments (around 40,000 Affymetrix HG U133A microarray chips) including expression levels for each probeset and associated metadata describing experiments and samples were downloaded from the ArrayExpress database using MOG software. Data from 21,900 chips/samples in ArrayExpress had not been logarithm-transformed, and these were selected for possible incorporation into our dataset. Samples with poorly correlated replicates or with multiple genes with missing values were identified computationally and removed from the dataset using MOG. After these steps, 18,637 samples with high-quality data remained (we refer to these as the 18637Hu-dataset). Expression values for eight probesets that were consistently too low for reliable quantification [1] were filtered from the co-expression network. Based on this analysis, the genes corresponding to > 99.9% of the probesets on the Affymetrix HG U133A microarray chips are significantly activated and expressed under at least some of the diverse genetic, developmental, and environmental conditions represented in the public dataset.
Regulons derived using MCL partitioning show more significant GS-scores than regulons derived using K-means and H-cluster
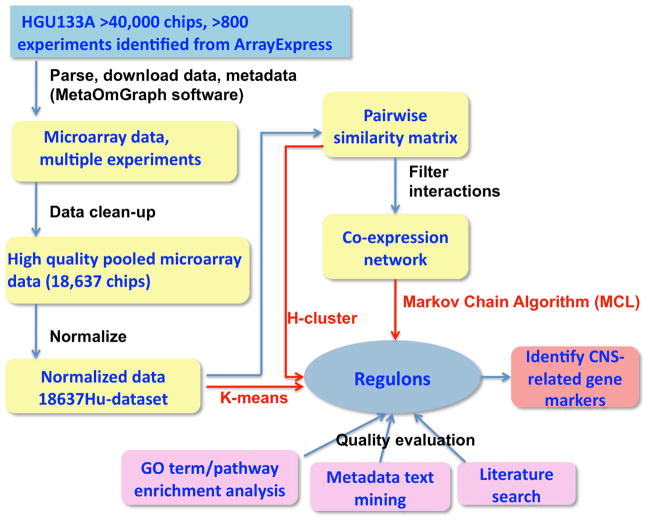
Regulons are groups of highly co-expressed genes with similar biological functions. A variety of clustering methods can be applied to find regulons to evaluate which methods would be optimal for large-scale pooled microarray data. We compared three major types: feature-based clustering (K-means), similarity matrix-based clustering (H-cluster), and graph-based clustering (MCL) (Fig. 1).
Fig. 1.
Flowchart for deriving regulons from large amounts of transcriptomic data. Microarray transcriptomic data from over 40,000 chips and associated metadata were downloaded using MetaOmGraph software (MOG). After data clean-up, normalization, and creation of a pairwise similarity matrix for all genes, K-means, H-cluster, and MCL clustering methods were applied to derive regulons (red arrows). The quality of the resultant regulons was evaluated by GO term or pathway enrichment analysis, metadata text mining, and literature search. Based on the low GS scores of the MCL derived regulons (Fig. 2) and further parameter optimization (Fig. 3 and 4), the 18637Hu-co-expression-network partitioned by MCL was selected for a proof of concept analysis.
To evaluate the computer-generated regulons generated by K-means, H-cluster, and MCL in light of their possible biological significance, we determined the best matches of overrepresentation of genes in Gene Ontology (GO) terms [1] [11] and metabolic and regulatory pathways [10]. To calculate overrepresentation, we used a hypergeometric distribution test [1] [12], followed by a Bonfferoni adjustment [13] [14] to compute adjusted p-values for each regulon. Although GO terms or pathways are not perfect in interpreting biological functions, they provide one of the few objective approaches that can be used to evaluate the functional associations of groups of genes [1] [15]. For the analysis shown in Fig. 2 and 3, pooled Arabidopsis microarray data was used [1]. This dataset has been highly curated by biologists for gene annotation, and thus provides a particularly rich source of metadata. Additionally, the computational time cost for the large amount of arrays in 18637Hu-dataset is very expensive. With these considerations, we used this smaller Arabidopsis dataset in determining an optimal clustering method and inflation factor for the MCL clustering algorithm (described below).
Fig. 2.
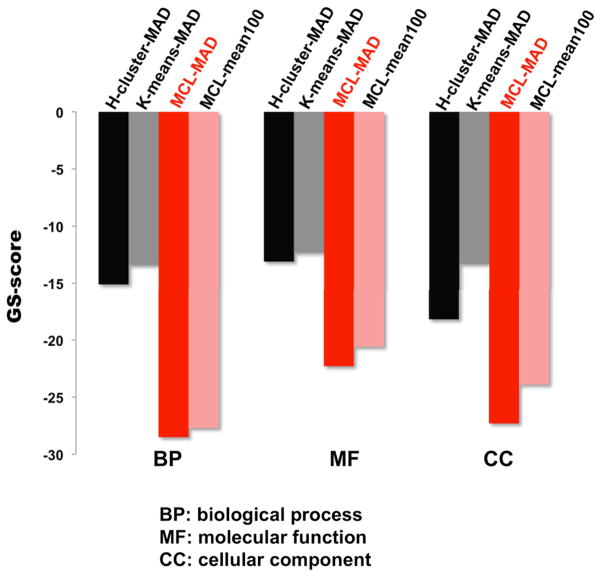
Global significance scores (GS-scores) of regulons derived using hierarchical-cluster (H-cluster), K-means, and Markov chain algorithm (MCL). The co-expression network was partitioned by H-cluster K-means, and MCL as detailed in Fig. 1 using median absolute deviation (MAD) normalized data. GS-scores were used to compare overrepresentation of regulons derived from MCL using data normalized by two methods: MAD and mean100. A lower GS-score indicates a higher relative ratio of functionally related genes in the regulons
Fig. 3.
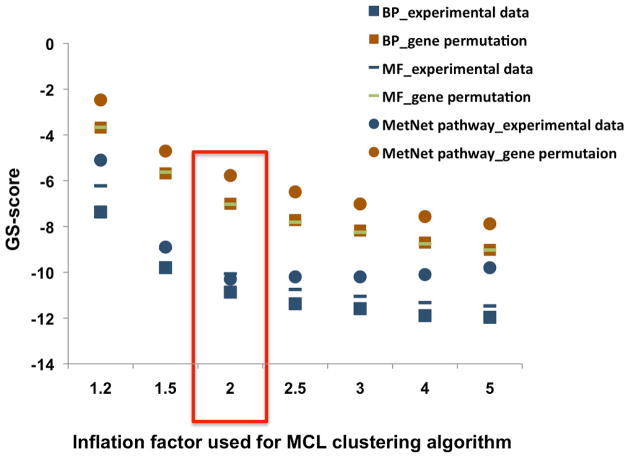
GS-scores from experimental data and gene permutation tests at inflation factors from 1.2 to 5. An inflation factor of 2 maximizes the difference between GS-scores of experimental data and the gene permutation tests. BP (biological process from Gene Ontology); MF (molecular function from Gene Ontology).
We define the global significance score (GS-score) as the average of logarithm transformed best adjusted p-values from GO term or pathway enrichment analysis for regulons or GO terms (see methods). A lower GS-score generally represents a higher ratio of matched genes in the regulons compared with the ratio of matched genes in the background. We used GS-score to evaluate the global quality of regulons derived by K-means, H-cluster, and MCL (Fig. 2). The MCL algorithm generates more functionally cohesive regulons than does K-means and H-cluster; therefore, our subsequent analysis is based on MCL partitioning. We further evaluated the global quality of MCL-derived regulons using two different normalization methods: MAD and mean100 (see methods). MAD leads to a slightly lower GS-score than mean100, which indicates that, in contrast to the selection of which clustering methods to use for data analysis, which has a tremendous effect on results, the choice of normalization methods has a much more minimal effect on the global quality (functional cohesiveness) of regulons. Based on these results, we selected MAD normalization to construct a human co-expression network (18637Hu-co-expression-network) and the MCL clustering algorithm to generate regulons from this network.
Identifying an optimal inflation factor for MCL
The inflation factor is an important parameter regulating cluster granularity for the MCL algorithm. Increasing the inflation factor will partition a co-expression network into more subnetworks, and thus will increase the number of regulons and decrease their size of the regulons. We tested the effect of seven inflation factors from 1.2 to 5 to partition the co-expression network. GS-scores were calculated for seven sets of regulons corresponding to seven inflation factors (Fig. 3). For each regulon, we permutated which genes were assigned to that regulon 30 times, and calculated GS-scores for these 30 randomly-generated sets of clusters. The minimal GS-scores for 30 randomly-generated sets of clusters at each inflation factor point are shown in Fig. 3. All GS-scores for regulons derived from the experimental data are orders of magnitude smaller than GS-scores of randomly-generated sets of clusters. At inflation factors of 1.5 and 2.0, the differences in GS-scores between experimental data regulons and randomly-generated clusters are maximized, which indicates an inflation factor in the range 1.5 to 2 is optimal. Based on these data, we chose an inflation factor of 2.0 in MCL to partition the 18637Hu-co-expression-network.
Identifying a correlation cutoff to build a co-expression network based on a Pearson correlation matrix for the 18,637 HGU133A dataset
In order to obtain a correlation matrix for the 18637Hu-dataset, we calculated the Pearson correlation for each possible pair of the 22,215 genes/probesets on the chip, using MOG (detailed in methods). We refer to the resulting 22,215 × 22,215 symmetric Pearson correlation matrix as 18673Hu-CorMatrix. In this matrix, all genes are connected to all other genes with Pearson correlations between -1 and 1.
We consider that a highly correlated expression pattern between two genes indicates these two genes are more likely to be co-regulated or functionally related [1] [16] [17]. To create a co-expression network for the 18673Hu-CorMatrix, we evaluated the global topography of the network density (Equation 5). This analysis was then used to determine a correlation cutoff value that would optimize generation of locally dense regions. An analysis of the density of networks derived from Pearson correlations cutoffs between 0.25 and 0.95 is shown in Fig. 4. For each cutoff, only nodes (genes) that are connected with another node at or above that cutoff are retained in the network. Network density depends on two variables: number of nodes and number of edges, in Equation 5. With the increase of Pearson correlation cutoff, the number of edges decreases, and the number of nodes also decreases because we removed isolated nodes (those not connecting with any other node). If all nodes in a network are fully connected, the density will be 1. This approach considers that the overall network density reflects how densely the nodes are linked in a graph [15] [18] [19]. Correlation densities of the networks derived from the 18673Hu-CorMatrix decrease with increasing cutoff until reaching a minimum density at a Pearson correlation value of 0.7, indicating that a network composed of genes with a Pearson correlation ≥ 0.7 would maximize retention of locally densely connected subnetworks.
Fig. 4.
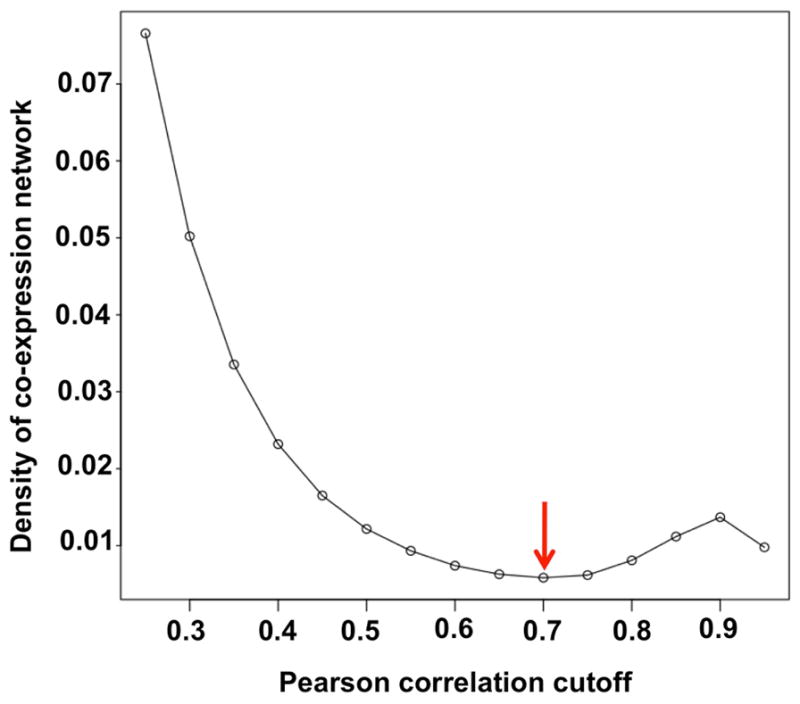
Density of the human transcriptomic co-expression network vs. Pearson correlation. A symmetrical Pearson correlation matrix was derived from the18637Hu-dataset. After filtering edges of the network with correlations less than the indicated Pearson correlation cutoff value, and removing isolated nodes, the resultant 18637Hu-co-expression-network retains locally dense connections. Network density is defined as the number of connections in the network divided by the possible number of connections in the network. Based on this analysis, to maximize locally dense connections, a Pearson correlation cutoff of 0.7, corresponding to the minimal density of the network (red arrow), was selected to construct the 18637Hu-co-expression-network.
Regulons derived by partitioning the 18637Hu-co-expression-network show high intra-regulon density and low inter-regulon density
Based on these analyses of the optimal Pearson correlation cutoff and inflation factor, we constructed a co-expression network from the MAD-normalized 18637Hu-dataset using a Pearson correlation cutoff of 0.7, and partitioned it using MCL at an inflation factor of 2. Nodes with < 0.7 Pearson correlation to any other node were removed from the 18673Hu-CorMatrix, yielding a co-expression network (18637Hu-co-expression-network) composed of 2,695 nodes (genes) and 31,471 edges (co-expression values).
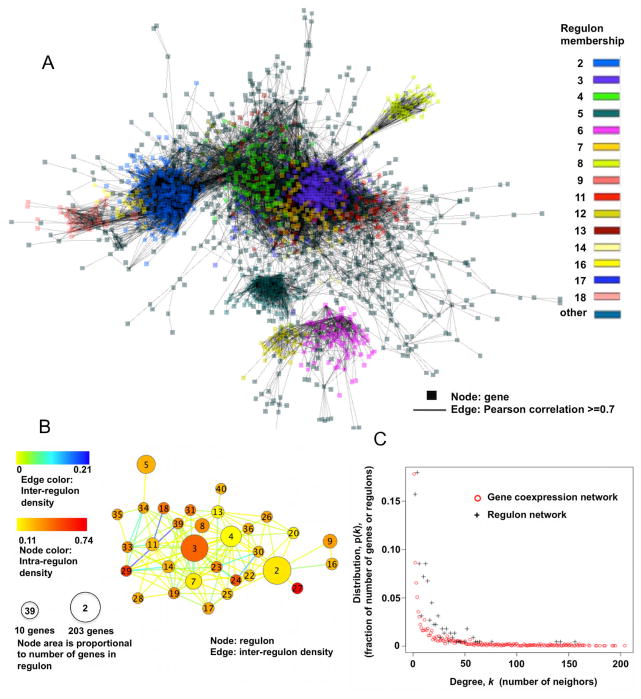
Application of the MCL algorithm to the18637Hu-co-expression-network yielded 359 clusters of genes based on overall co-expression of the genes across a wide range of conditions. Forty of these regulons contained ten or more genes; the largest had 332 genes. Of the 31,471 edges, only 7,201 (23%) interconnect regulons. In contrast, of the 2,695 genes in the network, 1,317 (49%) are fuzzy, i.e., they form part of a regulon but also interconnect (correlation ≥ 0.7) with genes in other regulons. An overall measure of the denseness of the regulons is visually reflected in the global visualization of the network in the largest component (naturally-connected subnetwork) of the 18637Hu-co-expression-network (Fig. 5 A). Fig. 5 B shows a similar plot for the regulon network of the largest 40 regulons; in this plot regulons are represented as nodes, and the connections between two genes in different regulons as edges. To compare the properties of inter-regulon connectivity to those of intra-regulon connectivity, we calculated the intra-regulon and inter-regulon densities for the 40 regulons with 10 or more nodes (see Methods, Equations 5 and 6). The average intra-regulon density is 0.31, whereas the average inter-regulon density is only 0.02, a further indication that MCL clustering partitions the network into locally dense clusters.
Fig. 5.
Human co-expression network.
(A) Gene to gene co-expression network (18637Hu-co-expression-network). The biggest connected component is shown. Nodes represent genes and edges represent co-expression (Pearson correlations ≥ 0.7). This figure provides a visual depiction of the 18637Hu-co-expression-network.
(B) Regulon to regulon co-expression network. Regulons from the 18637Hu-co-expression-network are represented as nodes, and the connections between genes in different regulons as edges (Pearson correlation ≥ 0.7). The 40 largest regulons contained in (A) are shown. Density is determined by Equations 5 and 6 (Methods). Regulon numbers, assigned in descending order of regulon size (genes/regulon), are written within nodes. This figure provides a visual depiction of regulon to regulon co-expression network.
(C) Number of neighbors versus size distribution for the gene co-expression and regulon networks. Both networks show power-law connectivity distribution, indicating that the co-expression network and the reduced regulon networks are both small-world networks.
The “degree” of a node in network terminology means the number of interactions this node has with other genes. The largest component in the 18637Hu-co-expression-network contains about 71% of the genes in the overall network. The degrees of all nodes were determined for this largest component. A plot of the probability distribution of degrees (Fig. 5 C) shows the co-expression network displays a power-law connectivity property, which indicates it has scale free connectivity and small world behavior. In small world networks, the small fraction of genes with the greatest number of neighbors dominates the topology of the network [22]. Interestingly, the corresponding plot for the regulon co-expression network shows a similar power law connectivity distribution (Fig. 5 C). The slight shift to the left of the gene co-expression network compared to the regulon co-expression network is likely caused by greater size of the former (1,913 nodes in the biggest component of the gene expression network compared to 223 nodes in the biggest component of regulon network).
GO term overrepresentation test and gene permutation analyses show the potential utility of using regulons to associate genes that have similar functions or participate in the same biological process
Many of the 359 regulons calculated from the 18637Hu-dataset are highly statistically significant in regards to GO term overrepresentation. For example, 73 of the 193 genes in Regulon 3 are classified as “structural constituents of ribosome”. Indeed, Regulon 3 contains 46% (73/159) of the genes in this GO classification; the adjusted p-value of Regulon 3 for “structural constituents of ribosome” is 3.1 × 10−108. Other regulons with highly significant adjusted p-values for cohesive functions include: Regulon 2, immune response; Regulon 4, actin cytoskeleton organization; Regulon 5, DNA replication, cell cycle related genes; Regulon 10, immunoglobulin; Regulon 11, mitochondrial electron transport chain; Regulon 12, organ development related genes; Regulon 15, muscle function; Regulon 18, oxidation reduction related. The GO overrepresentation results for the 40 largest regulons are detailed in (Table 1.).
Table 1.
Predominant physiological function of the 40 largest regulons as determined by analysis of overrepresentation of GO terms.
| Regulon | # of genes in regulon | Postulated physiological function | Best adjusted p-value* |
|---|---|---|---|
| 1 | 332 | Plasma membrane part | 8.7 × 10⁻⁷ |
| 2 | 203 | Immune response, signal transducer activity | 2.2 × 10⁻³⁵ |
| 3 | 193 | Structural constitute of ribosome, translation elongation | 1.5 × 10−140 |
| 4 | 120 | Regulation of actin cytoskeleton organization, protein binding | 2.9 × 10⁻¹¹ |
| 5 | 95 | DNA replication, cell cycle process, cell division, protein binding | 3.4 × 10−51 |
| 6 | 84 | Cell adhesion, extracellular matrix, cytoskeleton organization and biogenesis | 2.0 × 10⁻⁹ |
| 7 | 69 | Proteasome complex, anaphase-promoting complex-dependent proteasomal ubiquitin-dependent protein catabolic process, threonine-type endopeptidase activity | 2.2 × 10⁻⁹ |
| 8 | 48 | Not clear, protein amino acid phosphorylation | 1,5 × 10⁻² |
| 9 | 46 | Cell communication, signal transduction, immune response, T-cell receptor complex | 2.2 × 10⁻¹⁶ |
| 10 | 39 | Immunoglobulin, antigen binding, immune response | 1.4 × 10⁻¹⁰ |
| 11 | 36 | Mitochondrial inner membrane transporter, oxidation reduction, respiratory electron transport chain, nucleotide metabolic process | 6.6 × 10⁻²⁹ |
| 12 | 35 | Organ development, development process, lymphocyte mediated immunity, ion transport, cell adhesion, extracellular organization and biogenesis | 1.0 × 10⁻¹⁹ |
| 13 | 27 | Nuclear part, macromolecular complex assembly, mRNA transport, protein import into nucleus, biopolymer biosynthetic process | 2.8 × 10⁻⁸ |
| 14 | 25 | GTPase activity | 1.6 × 10⁻⁴ |
| 15 | 24 | Muscle cell development, muscle contraction, regulation of muscle contraction | 1.2 × 10⁻²⁴ |
| 16 | 22 | Immune response, defense response | 2.8 × 10⁻⁵ |
| 17 | 19 | Sphingolipid catabolic process, lysosome, vacuole | 1.6 × 10⁻⁵ |
| 18 | 18 | NADH dehydrogenase activity, oxidation reduction, phosphorus metabolic process, purine nucleotide metabolic process, mitochondrial envelope | 2.4 × 10⁻²⁴ |
| 19 | 16 | NADPH metabolic process, polyamine metabolic process, V-type ATPase | 2.7 × 10⁻⁵ |
| 20 | 16 | Oncosis, nuclear part | 2.4 × 10⁻³ |
| 21 | 15 | Regulation of transcription | 4.2 × 10⁻³ |
| 22 | 15 | Not clear, nitrogen fixation | 3.7 × 10⁻³ |
| 23 | 14 | RNA splicing, splicesomal complex, nuclear speck | 4.2 × 10⁻⁷ |
| 24 | 14 | Response to cAMP, negative regulation of myeloid cell differentiation, regulation of gene expression, methylation, transcription, protein kinase cascade | 4.7 × 10⁻⁷ |
| 25 | 14 | Not clear, pentose-phosphate shunt, non-oxidative branch | 5.5 × 10⁻³ |
| 26 | 14 | Cysteine-type endopetidase activity, protein kinase cascade, PML body | 2.1 × 10⁻⁴ |
| 27 | 14 | MHC class II protein complex, antigen processing and presentation | 1.3 × 10⁻²⁴ |
| 28 | 12 | Vesicle coating_mRNA splicing, transportation | 3.8 × 10⁻⁴ |
| 29 | 12 | RNA splicing, spliceosomal complex, nuclear speck | 1.8 × 10⁻¹¹ |
| 30 | 12 | Nuclear speck | 1.4 × 10⁻⁴ |
| 31 | 12 | Not Clear, polytene chromosome | 4.7 × 10⁻³ |
| 32 | 12 | Calcium-independent cell-cell adhesion, cell-cell junction | 8.2 × 10⁻⁷ |
| 33 | 11 | Cell cycle, negative regulation of ligase activity | 2.0 × 10⁻⁷ |
| 34 | 11 | Protein export from nucleus, splicesomal snRNP biogenesis, ribonucleoprotein complex | 2.3 × 10⁻⁵ |
| 35 | 11 | Translation | 1.6 × 10⁻⁵ |
| 36 | 11 | UDP catabolic process, MLL5-L complex | 1.0 × 10⁻³ |
| 37 | 11 | Response to hormone stimulus | 8.9 × 10⁻⁴ |
| 38 | 11 | Axon target recognition, neuron projection | 4.7 × 10⁻⁶ |
| 39 | 10 | mRNA processing, RNA splicing, nuclear body | 3.0 × 10⁻⁸ |
| 40 | 10 | Gene expression, U2 SnRNP | 2.0 × 10⁻³ |
Best adjusted p-value is the term for the lowest adjusted p-value associated with the most overrepresented GO term among all GO terms. The p-value adjustment is implemented using the Bonfferoni method, in R package “GOHyperGAll” [12].
Through gene permutation analysis, we further evaluated the statistical significance of the MCL-derived human regulons by calculating GS-scores for regulons generated from real data and from clusters to which genes had been assigned randomly. Specifically, we compared the overrepresentation of GO terms in the 40 largest regulons experimentally determined from the 18637Hu-dataset with the overrepresentation of GO terms in randomized clusters of the same size distribution (Fig. 6). To do this, all the genes presented in HGU 133A Affymetrix chip were randomly assigned to bins, maintaining the same number of clusters and genes/cluster as in the set of 40 largest regulons determined from experimental data. The best adjusted p-value was determined for each randomized cluster; the number obtained by averaging the best p-values for the 40 clusters in the set (Equation 7) is referred to as the GS-score [1]. Two hundred and sixty eight such randomized cluster sets were created and evaluated. The distribution of GS-scores is shown in Fig. 6. The GS-score for the 40 regulons is significantly better than that of any of the randomized cluster sets, indicating that the tendency of similar GO terms to be grouped in the same regulon is not random, and further implies a biological significance for the regulons derived from the 18637Hu-dataset.
Fig. 6.
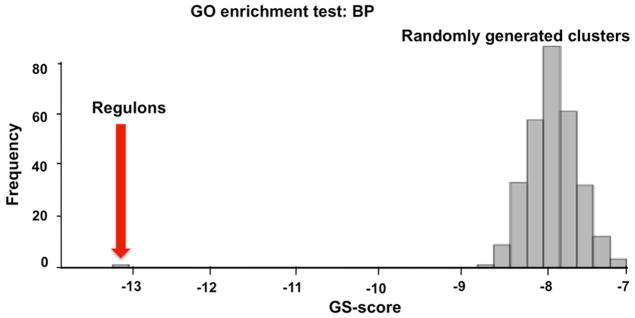
Statistical evaluation of MCL clustering. The GS-score here represents the mean of 40 log-transformed best adjusted p-values for the most overrepresented Gene Ontology (GO) terms in biological process branch corresponding to the 40 experimentally-based regulons with 10 or more gene members (red arrow). The GS-score for regulons derived from experimental data (red arrow) is compared to the analogous values for 268 randomly generated sets of 40 clusters (histogram). The GS-score of regulons from experimental data is better than any of the randomly obtained clusters. BP: biological process.
A closer view of two naturally connected regulons
An example of two interconnected regulons (Regulons 10 and 47) is shown in Fig. 7. The intra-regulon density for Regulon 10 is 0.49, and for Regulon 47 is 0.5. In contrast, the inter-regulon density is 0.006. The transcripts in Regulon 10 mostly do not correspond to single geneIDs or annotated exons. But most of them are related to human antibodies or immunoglobulins according to the Affymetrix annotation. The GO overrepresentation test for regulons shows highest significance for GO term “antigen binding”, with an adjusted p-value of 1.4 × 10⁻¹⁰. Two genes, CD19 and CD79A in Regulon 47, belong to the antigen receptor mediated signaling [23] [24]. CD19, CD79B, POU2AF1, CD79A, and CD22 are annotated by GO as being in the process of immune response. Regulon 47 has “B-cell receptor signaling pathway” as the most significantly overrepresented GO term, with an adjusted p-value of 3.5 × 10⁻⁵.
Fig. 7.
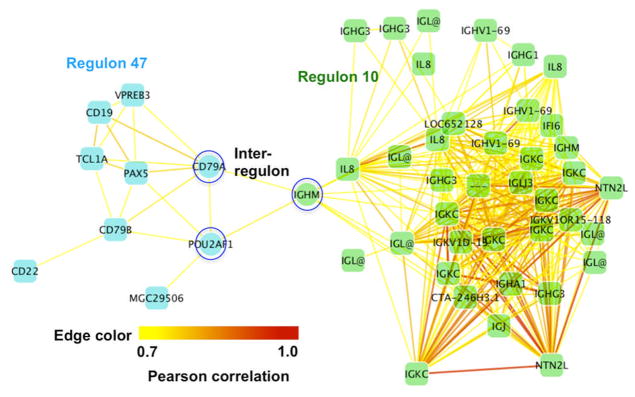
Naturally connected regulons. Regulon 10 is almost entirely composed of immunoglobulins, and the Regulon 47 contains predominantly genes associated with immune signaling pathways. The three genes highlighted by blue circles are fuzzy genes connecting Regulon 10 with Regulon 47. These genes could inform hypotheses by biologist about the genes important in integration of immunoglobulins and immune signaling. Edge color from yellow to red continuously maps to a Pearson correlation from 0.7 to 1.
In the Regulon 47 sub-network, POU2AF1 and CD79A are co-expressed with IGHM in Regulon 10, thus these 3 genes can be considered as fuzzy genes. These data suggest the testable hypothesis that these three genes (POU2AF1, CD79A, and IGHM) work as a bridge connecting the transcriptional events of human antibodies and the antigen receptor mediated signaling pathway.
The most densely connected regulon: 48 (metallothionein antioxidant genes)
The metallothionein antioxidant (MT) MT1 and MT2 genes are clustered on chromosome 16 [25] and are co-transcribed under many specific experimental conditions [26–28]. For example, MT1A, MT2A, MT1E, and MT1X are similarly up-regulated by genistin and its glycosides in HepG2 cells [26], MT1B, MT1E, MT1F and MT1H are reported to have robust transcriptional response and be induced in histone deacetylase inhibitors (HDACi) sensitive colon cancer cells [27], the transcription of MT1A, MT2A, MT1E, and MT1X are induced after zinc pretreatment and sodium nitroprusside exposure [28]. A MT subnetwork has been noted in a bioinformatics analysis by Huang et. al. [29], who determined that a subnetwork constructed by five of these genes, MT1E, MT1F, MT1L, MT1H and MT1X, has the highest recurrence of co-expression links across an analysis of 65 microarray experiments; specifically, six links occurred among these five MT1 genes. This contrasts with the fuller interconnectivity among the 8 MT genes in the more targeted experiments [26–28].
To evaluate the inter-connectivity among MT genes across the over 500 experiments in our large dataset, we evaluated the distribution of the MT genes in our gene co-expression network and found that all eight are in a single regulon, Regulon 48. Indeed, Regulon 48 contains eight genes, each of which encodes one of the eight metallothioneins: MT2A, MT1E, MT1M, MT1P2, MT1G, MT1H, MT1F, and MT1X. This is an isolated regulon (i.e., no genes within this regulon have a Pearson correlation of ≥0.7 with any other genes). However, each of the eight MT genes is fully inter-connected with each of the others. The average of 28 correlations within this regulon: 0.87 is much higher than the average of all 31,471 correlations in 18637Hu-co-expression-network: 0.75 (Fig. 8).
Fig. 8.
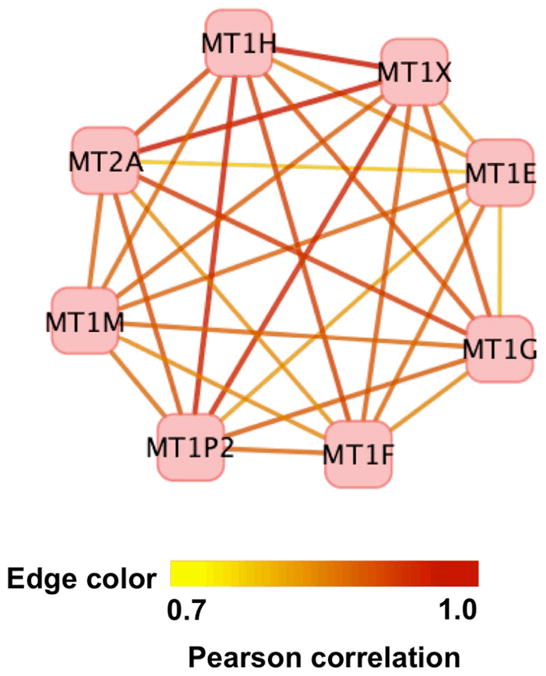
Regulon 48: metallothionein antioxidant genes. This highly dense regulon contains all eight of the metallothionein (MT) antioxidant genes in the human genome, and these are fully connected with high correlation. This analysis extends our understanding of the global interconnectivity of the metallothionein antioxidant genes. Edge color is continuously mapped to a Pearson correlation from 0.7 to 1.
Proof of concept: utility of regulons in identifying molecular markers using two CNS-related regulons as a case study
We have demonstrated the statistical significance of regulons in associating functionally similar genes using GO overrepresentation tests (Table 1) and permutation tests (Fig. 6). Here, the extremely large volume of microarray data we used enables us to evaluate the possible usefulness and function of regulons by searching the meta-data in addition to GO term overrepresentation study. The metadata associated with MOG includes the following information: experiment name, biosource provider, cell type, clinical history, developmental stage, organism, and organism part. We decided to try to identify a regulon that might play a role in the central nervous system. Two regulons, 56 and 83, have been identified.
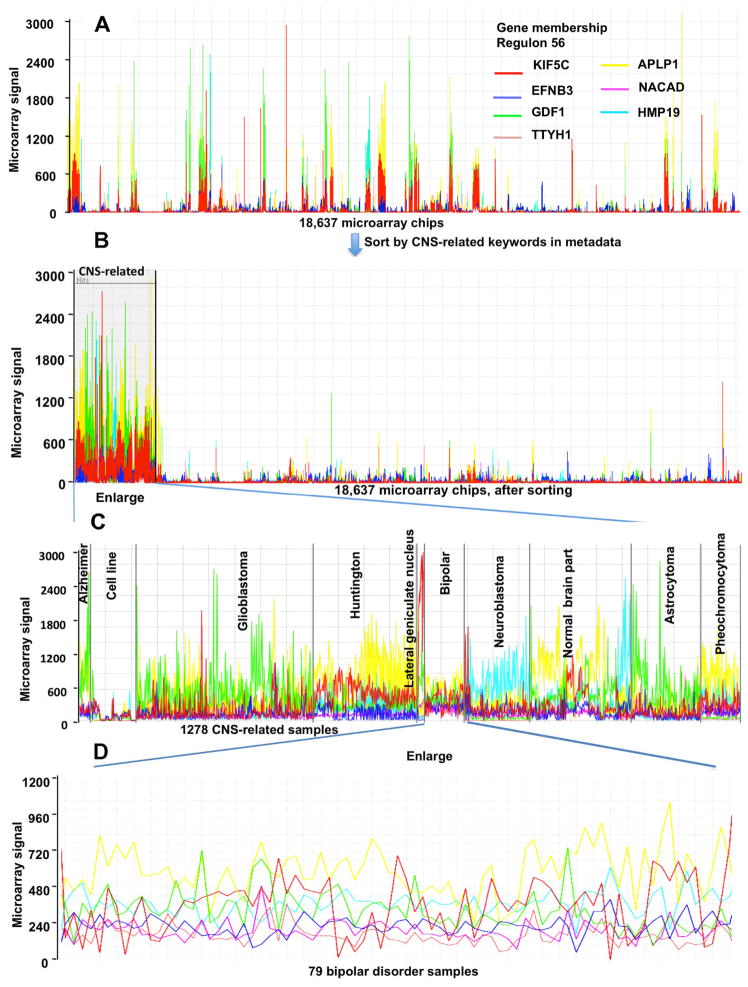
Regulon 56 is significant in a GO overrepresentation test with the best adjusted p-value 0.0008 for the GO term “axon guidance”, a biological process in neural development [30] [31]; this indicates a function of Regulon 56 might be related to neurons. We checked the expression pattern of genes in Regulon 56 across the 18637Hu-dataset and found high expression in a number of samples (Fig. 9 A) all of which are related to the central nervous system (CNS). Using text-mining functionality for filtering microarray chips based on keywords in the metadata in MOG software, in combination with the experimental metadata, we identified a broad subset of experiments relating to CNS-function. We selected 25 key words associated with brain/CNS parts and brain/CNS diseases (e.g., Huntington, neuroblastoma, glioblastoma) for this search, and grouped ~ 2,000 samples based on this keyword search together. The expression values of genes in Regulon 56 are much higher in most of the 2000 key-word based samples than in other samples in the dataset. We manually read through the metadata for each of the 2000 keyword based samples, and found that some of the samples did not represent the CNS. After filtering out these non-CNS samples, 1,278 samples (CNS-subset) remained (Fig. 9 B). We used the metadata to further classify this CNS-subset according to disease, brain part, or cell line (Fig. 9 C).
Fig. 9.
The microarray signal of genes in Regulon 56 across 18,637 HGU133A chips, and within the subset of the 1,278 CNS-related chips. Analyzed and visualized using MetaOmGraph (MOG) software. The MOG software and associated human co-expression data is publicly available at (http://metnet.vrac.iastate.edu/MetNet_MetaOmGraph.htm). This global analysis using interactive software illustrates the potential of visualization of regulons in the context of a large transcriptomic network derived from high quality co-normalized data for hypothesis development.
Interestingly, expression of Regulon 56 genes is lowest in these RNA samples isolated from cell lines, such as glioblastoma cell lines, neuroblastoma tumor cell line (SH-SY5Y), and neuroblastoma cell line IMR32 and SHEP-SF. (Fig. 9 C). This is likely a reflection of the general dedifferentiation that cell lines undergo over generations in culture [26]. Regulon 56 genes are highly expressed in both neuronal and glial cells and tissues, regardless of disease condition.
Thus, the results of meta-analysis of the large-scale microarray data imply that genes of Regulon 56 are involved in CNS function. This finding is consistent with, and broadens, previous understanding of these genes. All genes in Regulon 56 have either been shown experimentally to be implicated in brain disease or function, or have been reported to be specifically expressed in the nervous system.
Gliomas are tumors derived from glial cells from brain. Glioblastoma is the most aggressive form (grade IV) of gliomas [32]. Astrocytoma specifies glioma tumors of an astrocytic lineage, of which, again, glioblastoma is the most aggressive form [32]. In the CNS-subset of samples, glioblastoma is separated from astrocytoma in order to distinguish the most aggressive tumors (glioblastoma) from all others (less aggressive gliomas). The nascent polypeptide-associated complex (NAC) alpha domain containing (NACAD) has been reported to be associated with glioma [33]. GDF1 (growth differentiation factor 1), a member of the bone mophorgenetic protein (BMP) family, is expressed in normal nervous systems [34] [35]. Our data show that GDF1 is highly expressed in glioblastoma and astrocytoma. Although no publication supports whether GDF1 is involved in glioblastoma or astrocytoma, Yamada et. al. show that BMPs play a functional role in gliomas [35] which may suggest that GDF1, as a member of BMP, is important for gliomas. In the CNS-subset of transcriptomic data, the Tweety homolog 1 (TTYH1) transcript is almost absent in neuroblastoma and pheocytoma samples, but highly expressed in gliomas; this finding extends and is consistent with experimental results that indicate TTYH1 may be involved in some aspect of glial-CNS signaling/regulation [36]. This obvious expression difference of TTYH1 expression between glial brain tumors and a vast array of other types of brain tumors and non-CNS-related tumors further supports the testable hypothesis that TTYH1 is important in oncogenesis and progression of gliomas.
APLP1, a mammalian member of the conserved gene family encodes the amyloid precursor protein (APP), which can be abnormally cleaved and forms the cerebral plaque associated with Alzheimer disease [37]. Interestingly, transcript of APLP1 is also highly accumulated in samples related to huntington, pheochromocytoma, and normal brain parts besides Alzheimer samples (Fig. 9 C). This finding indicates the importance of post-translational modification for the molecular function of APLP1.
Ephrin-B3 (EFNB3) interacts with other synaptic receptors to regulate synapse density and the formation of dendritic spines [38], and has been reported to be highly expressed in neuroblastoma [39]. The expression of EFNB3 is not as much exclusively expressed in CNS-related samples as other six genes in Regulon 56. We observed that EFNB3 was also highly expressed in Wilm’s tumor, Synovial sarcoma, and lung cancer cell line (Fig. 9 B), which indicates the possible function of EFNB3 in cancerogenesis.
KIF5C (a member of kinesin family) has been designated as a motor neuron-specific transcript [40]. KIF5C has higher mRNA accumulation in samples related to huntington and lateral geniculate nucleus than other samples (Fig. 9 C).
HMP19, or protein p19, is designated as specifically expressed in brain and is involved in dopamine receptor signaling [41]. Our results showed that HMP19 was highly expressed in neuroblastoma and fetal cerebrum samples in normal brain part (Fig. 9 C), which indicates that HMP19 may be important to neuroblastoma and brain development.
The approach of combining meta-analysis results and meta-transcriptomic data is a powerful tool to develop hypotheses about genes of unknown function. Regulon 83 genes, like those of Regulon 56, are preferentially expressed in CNS-related samples. One gene in Regulon 83 (represented by probe set 213841_at) has no known function. Based on our finding that this regulon is expressed in a CNS-preferential manner, we predict that this gene (213841_at) is related to CNS function.
Discussion
In this study, we compute a mega human gene co-expression network using the huge number of publicly available high-quality microarray chips in ArrayExpress. This network derived from 18,637 samples provides a large background for gene co-expression analysis to enable better understanding of the variation of gene expression and co-expression under tens of thousands of different genetic conditions, developmental stages and environmental perturbations. The meta-analysis combining multiple experiments in this study differs from the traditional meta-analysis in which the summary statistics of single experiments are combined in meta-analysis [9]. Instead, we derived a co-expression network based on co-normalization of all samples before analysis. Statistical methods demonstrate the highly significant functional cohesiveness of clusters obtained from this network. The importance of this combined sample approach is that it facilitates cross-experimental comparisons for hypothesis development.
In the course of this analysis, we have developed novel functionality within our preexisting software MOG [10]. This software is publically available to researchers for use with a variety of data-types. We have mined the experimental metadata in combination with the co-expression network.
These studies demonstrate the utility of extending meta-analysis to data mining of large-scale microarray data and text mining of the associated meta-data. Regulons 56 and 83 illustrate the concept of the combination of the data mining and metadata text mining to elucidate CNS-related biology. In doing so, we compared data mining and text mining, with results from biological experiments, revealing that the flow work of meta-analysis developed in this study provides an effective approach to identify and enhance the understanding of biologically meaningful groups of co-regulated genes.
The regulons described herein were derived from >18,000 samples and over 500 experiments, genes in a given regulon are highly co-expressed across many conditions; Conversely, the regulons may not be highly correlated in subsets of the data. Regulons derived from a small dataset designed to elucidate a particular topic are likely to differ greatly from the global regulons derived in this study to reflect overall biology. Regulon 56 provides an example, in that genes in this regulon are highly expressed in CNS-related samples as compared to the entire dataset, but these genes are not as highly correlated within the subset of CNS-related related samples. Such subset could be further analyzed using the MOG software.
In summary, these analyses indicate that the 18637Hu-co-expression-network and corresponding regulons provides rich information for experimental biologists to design experiments, interpret experimental results, and develop novel hypothesis on gene function. Network based large-scale transcriptomic data analysis in combination with drill-down analysis of specific experiments create a powerful approach in the study of a wide variety of human diseases and conditions.
Methods
Data download, initial normalization, and selection criteria for retention in final dataset
Data and metadata from over 40,000 Affymetrix HG U133A chips including over 800 microarray experiments at ArrayExpress were downloaded using MetOmGraph. We identified 21,900 samples containing data that had not been pre-treated; these data were selected for possible incorporation into the dataset. For each sample, data were normalized to a mean of 100 [1]. All negative values were treated as missing values, and chips with over 1,000 probesets with missing values were discarded from the dataset. Replicate chips were identified according to the hybridization name given in the sdrf files at ArrayExpress. Some experiments provided incomplete or unclear metadata, requiring us to manually identify technical replicate samples to guarantee replicate accuracy. Replicates were removed if the correlations among them were less than 0.86. After these steps, high quality data from 18,637 chips remained.
Low expression genes, defined as probesets whose expression values were less than the mean value of 100 across all assays [1], were identified by and removed, resulting in the removal of 8 probesets in the network analysis. Control probesets were removed before normalization.
Data normalization and gene-pair Pearson correlations
Logarithm base 2 transformation was performed on all data. We designate xoij to represent the original expression signal value of probeset i in sample j. For all samples, we did median centering as per Equation 1:
| (Equation 1) |
xmij is the log2 transformed and median centered expression signal value. Then, the median absolute deviation (MAD) based scale normalization method was applied to scale the data [1]. The expression signal values on sample j were multiplied by the scale factor C/MADj. C and MADj are defined as following:
| (Equation 2) |
| (Equation 3) |
When calculating the Pearson correlation for a pair of genes, all missing values and negative values were not considered for both genes. The formula of Equation 4 was then used to calculate the Pearson correlation between pairs of genes. The Pearson correlation matrix calculated by this method using 18,673 Samples is denoted as 18673Hu-CorMatrix. The human co-expression network (18637Hu-co-expression-network) described in this paper is based on 18673Hu-CorMatrix.
| (Equation 4) |
The 18673Hu-CorMatrix can be calculated by MOG if the computer has enough memory. MOG has default heap size of 512 Mb. The heap size of MOG was set to 2,048 Mb due to the large volume of microarray datasets. A Mac computer with a 2.8 GHz Intel Core 2 Duo processor takes about 6 hours to finish the calculation of the 18673Hu-CorMatrix.
Network density
The density of a network is defined as number of edges in a network divided by the number of all possible edges [15], described in the following equations.
| (Equation 5) |
In Equation 5, N is the number of the nodes within the regulon, and E is the number of edges within the regulon.
| (Equation 6) |
Here, N1 and N2 are the numbers of nodes in two regulons. The number of edges between two regulons is denoted as E. The density of inter-regulons defined by Equation 6 is based on that the number of N1 multiplying N2 is the maximal possible edges between two regulons.
GS-scores for evaluation of the global significance of regulons
A hypergeometric distribution test was applied to calculate the p-value for the overrepresentation of each regulon by GO terms or pathways, or each GO term or pathway by regulons [1] [42]. We define the global significance scores (GS-scores) in Equation 7.
| (Equation 7) |
Here, n is the number of regulons, GO terms or pathways. The minimal p-value: Pmin j is the best adjusted p-value for overrepresentation of jth regulon by the best matched GO term or pathway, or jth GO term or pathway by the best matched regulon.
Removal of duplicate probesets
In some cases, several probesets correspond to the same gene in the HG U133A array (http://www.affymetrix.com). However, these probesets might represent the transcriptional variants of the gene, and may be translated into different proteins to perform different molecular function due to the complexity of mRNA splicing in human. If the Pearson correlation between the experimental values for the duplicate probesets is larger than 0.9, we consider the probesets are redundant and only one should be retained as a representative for the gene. According to the technical notes of Affymetrix Company, a probeset annotated with a “_x_” suffix might hybridize with transcripts other than the one being intentionally measured. So if a probeset designated with an “_x_” suffix and a probeset without an “_x_” suffix both represent a single gene, and the Pearson correlation between co-expression of these is more than or equal to 0.9, we choose the probeset without “_x_” suffix to represent the gene. If the probesets for a gene all have an “_x_” suffix, we will choose the one having biggest interquantile range (IQR) value. If the probesets for a same gene are all not with “_x_” suffix, we retain all the probesets. This processing results in 295 nodes (probesets) being removed from the network.
Acknowledgments
We thank the National Center for Complementary, Alternative Medicine (NCCAM), the Office of Dietary Supplements (ODS), and National Institutes of Health (NIH) for providing financial support (grant 9P50AT004155-06). We also thank the National Science Foundation Engineering Research Center for Biorenewable Chemicals financial support (grant EEC-0813570).
References
- 1.Mentzen WI, Wurtele ES. BMC Plant Biol. 2008;8:99. doi: 10.1186/1471-2229-8-99. [DOI] [PMC free article] [PubMed] [Google Scholar]
- 2.Stuart JM, Segal E, Koller D, Kim SK. Science. 2003;302:249. doi: 10.1126/science.1087447. [DOI] [PubMed] [Google Scholar]
- 3.Prieto C, Risueno A, Fontanillo C, De Las Rivas J. PLoS One. 2008;3:e3911. doi: 10.1371/journal.pone.0003911. [DOI] [PMC free article] [PubMed] [Google Scholar]
- 4.Chung WY, Albert R, Albert I, Nekrutenko A, Makova KD. BMC Bioinformatics. 2006;7:46. doi: 10.1186/1471-2105-7-46. [DOI] [PMC free article] [PubMed] [Google Scholar]
- 5.Aggarwal A, Guo DL, Hoshida Y, Yuen ST, Chu KM, So S, Boussioutas A, Chen X, Bowtell D, Aburatani H, Leung SY, Tan P. Cancer Res. 2006;66:232. doi: 10.1158/0008-5472.CAN-05-2232. [DOI] [PubMed] [Google Scholar]
- 6.Pereira-Leal JB, Enright AJ, Ouzounis CA. Proteins: Structure Function and Genetics. 2004;54:49. doi: 10.1002/prot.10505. [DOI] [PubMed] [Google Scholar]
- 7.Choi JK, Yu US, Yoo OJ, Kim S. Bioinformatics. 2005;21:4348. doi: 10.1093/bioinformatics/bti722. [DOI] [PubMed] [Google Scholar]
- 8.Jordan IK, Marino-Ramirez L, Wolf YI, Koonin EV. Mol Biol Evol. 2004;21:2058. doi: 10.1093/molbev/msh222. [DOI] [PubMed] [Google Scholar]
- 9.Ma SG, Huang J. BMC Bioinformatics. 1997;10:1. [Google Scholar]
- 10.Nikolau BJ, Wurtele ES. Concepts in Plant Metabolomics. Springer; 2007. p. 145. [Google Scholar]
- 11.Montaner D, Minguez P, Al-Shahrour F, Dopazo J. BMC Genomics. 2009;10:197. doi: 10.1186/1471-2164-10-197. [DOI] [PMC free article] [PubMed] [Google Scholar]
- 12.Horan K, Jang C, Bailey-Serres J, Mittler R, Shelton C, Harper JF, Zhu JK, Cushman JC, Collery M, Girke T. Plant Physiol. 2008;147:41. doi: 10.1104/pp.108.117366. [DOI] [PMC free article] [PubMed] [Google Scholar]
- 13.Dunnett CW. Biometrics. 1964;20:482. [Google Scholar]
- 14.Dunnett CW. Journal of the American Statistical Association. 1955;50:1096. [Google Scholar]
- 15.Mao LY, Van Hemert JL, Dash S, Dickerson JA. BMC Bioinformatics. 2009;10:346. doi: 10.1186/1471-2105-10-346. [DOI] [PMC free article] [PubMed] [Google Scholar]
- 16.Ding W, Wang LQ, Qiu P, Kostich M, Greene J, Hernandez M. BMC Genomics. 2002;3:32. doi: 10.1186/1471-2164-3-32. [DOI] [PMC free article] [PubMed] [Google Scholar]
- 17.Srivastava GP, Qiu J, Xu D. IEEE International Conference on Bioinformatics and Biomedicine Proceedings; 2008. p. 367371. [Google Scholar]
- 18.Aoki K, Ogata Y, Shibata D. Plant and Cell Physiol. 2007;48:381. doi: 10.1093/pcp/pcm013. [DOI] [PubMed] [Google Scholar]
- 19.van Dongen S. PhD thesis. University of Utrecht; 2000. Graph clustering by flow simulation; p. 112. [Google Scholar]
- 20.Schwarz E, Leweke FM, Bahn S, Lio P. BMC Bioinformatics. 2009;10:S6. doi: 10.1186/1471-2105-10-S12-S6. [DOI] [PMC free article] [PubMed] [Google Scholar]
- 21.Enright AJ, Van Dongen S, Ouzounis CA. Nucleic Acids Res. 2002;30:1575. doi: 10.1093/nar/30.7.1575. [DOI] [PMC free article] [PubMed] [Google Scholar]
- 22.Oldham MC, Horvath S, Geschwind DH. Proc Natl Acad Sci USA. 2006;103:17973. doi: 10.1073/pnas.0605938103. [DOI] [PMC free article] [PubMed] [Google Scholar]
- 23.Hashimoto S, Chiorazzi N, Gregersen PK. Mol Immunol. 1995;32:651. doi: 10.1016/0161-5890(95)00023-8. [DOI] [PubMed] [Google Scholar]
- 24.Chalupny NJ, Kanner SB, Schieven GL, Wee SF, Gilliland LK, Aruffo A, Ledbetter JA. EMBO J. 1993;12:2691. doi: 10.1002/j.1460-2075.1993.tb05930.x. [DOI] [PMC free article] [PubMed] [Google Scholar]
- 25.Karin M, Eddy RL, Henry WM, Haley LL, Byers MG, Shows TB. Proc Natl Acad Sci USA. 1984;81:5494. doi: 10.1073/pnas.81.17.5494. [DOI] [PMC free article] [PubMed] [Google Scholar]
- 26.Chung MJ, Kang AY, Lee KM, Oh E, Jun HH, Kim SY, Auh JH, Moon TW, Lee SJ, Park KH. J Agricult Food Chem. 2006;54:3819. doi: 10.1021/jf060510y. [DOI] [PubMed] [Google Scholar]
- 27.Wilson AJ, Chueh AC, Togel L, Corner GA, Ahmed N, Goel S, Byun DS, Nasser S, Houston MA, Jhawer M, Smartt HJ, Murray LB, Nicholas C, Heerdt BG, Arango D, Augenlicht LH, Mariadason JM. Cancer Res. 2010;70:609. doi: 10.1158/0008-5472.CAN-09-2327. [DOI] [PMC free article] [PubMed] [Google Scholar]
- 28.Chung MJ, Hogstrand C, Lee SJ. Exp Biol Med. 2006;231:1555. doi: 10.1177/153537020623100916. [DOI] [PubMed] [Google Scholar]
- 29.Huang Y, Li HF, Hu HY, Yan XF, Waterman MS, Huang HY, Zhou XJ. Bioinformatics. 2007;23:I222. doi: 10.1093/bioinformatics/btm222. [DOI] [PubMed] [Google Scholar]
- 30.Nadar VC, Ketschek A, Myers KA, Gallo G, Baas PW. Curr Biol. 2008;18:1972. doi: 10.1016/j.cub.2008.11.021. [DOI] [PMC free article] [PubMed] [Google Scholar]
- 31.Andersen SS, Bi GQ. Bioessays. 2000;22:172. doi: 10.1002/(SICI)1521-1878(200002)22:2<172::AID-BIES8>3.0.CO;2-Q. [DOI] [PubMed] [Google Scholar]
- 32.Carro MS, Lim WK, Alvarez MJ, Bollo RJ, Zhao XD, Snyder EY, Sulman EP, Anne SL, Doetsch F, Colman H, Lasorella A, Aldape K, Califano A, Iavarone A. Nature. 2010;463:318. doi: 10.1038/nature08712. [DOI] [PMC free article] [PubMed] [Google Scholar]
- 33.Kroes RA, Jastrow A, McLone MG, Yamamoto H, Colley P, Kersey DS, Yong VW, Mkrdichian E, Cerullo L, Leestma J, Moskal JR. Cancer Lett. 2000;156:191. doi: 10.1016/s0304-3835(00)00462-6. [DOI] [PubMed] [Google Scholar]
- 34.Wang B, Shi G, Fu Y, Xu X. DNA Seq. 2007;18:92. doi: 10.1080/10425170601060947. [DOI] [PubMed] [Google Scholar]
- 35.Yamada N, Kato M, tenDijke P, Yamashita H, Sampath TK, Heldin CH, Miyazono K, Funa K. Br J Cancer. 1996;73:624. doi: 10.1038/bjc.1996.108. [DOI] [PMC free article] [PubMed] [Google Scholar]
- 36.Matthews CA, Shaw JE, Hooper JA, Young IG, Crouch MF, Campbell HD. J Neurochem. 2007;100:693. doi: 10.1111/j.1471-4159.2006.04237.x. [DOI] [PubMed] [Google Scholar]
- 37.Kuan YH, Gruebl T, Soba P, Eggert S, Nesic I, Back S, Kirsch J, Beyreuther K, Kins S. J Biol Chem. 2006;281:40114. doi: 10.1074/jbc.M605407200. [DOI] [PubMed] [Google Scholar]
- 38.McClelland AC, Hruska M, Coenen AJ, Henkemeyer M, Dalva MB. Proc Natl Acad Sci USA. 2010;107:8830. doi: 10.1073/pnas.0910644107. [DOI] [PMC free article] [PubMed] [Google Scholar]
- 39.Tang XX, Zhao H, Robinson ME, Cohen B, Cnnan A, London W, Cohn SL, Cheung NV, Brodeur GM, Evans AE, Ikegaki N. Proc Natl Acad Sci USA. 2000;97:10936. doi: 10.1073/pnas.190123297. [DOI] [PMC free article] [PubMed] [Google Scholar]
- 40.Schafer B, Gotz C, Montenarh M. Biochem Biophys Res Commun. 2008;375:179. doi: 10.1016/j.bbrc.2008.07.107. [DOI] [PubMed] [Google Scholar]
- 41.Liu S, Tian ZM, Zheng GQ, Wu HT, Jin YB, Ma X, Fan WH, Fan M. Zhonghua Yi Xue Yi Chuan Xue Za Zhi. 2007;24:182. [PubMed] [Google Scholar]
- 42.Boyle EI, Weng SA, Gollub J, Jin H, Botstein D, Cherry JM, Sherlock G. Bioinformatics. 2004;20:3710. doi: 10.1093/bioinformatics/bth456. [DOI] [PMC free article] [PubMed] [Google Scholar]


