

Abstract
Background
Hyperglycemia in acutely ill patients is well described and correcting this hyperglycemia improves outcomes. It has been generally attributed to endogenous factors, specifically decreased secretion of insulin or increased secretion of anti-insulin hormones, and cytokines, or both. Norepinephrine is the most commonly used vasopressor in critically ill patients. When titrated, it has anecdotally been found to cause wide swings in blood glucose. We tested the hypothesis that norepinephrine, a plausible exogenous, iatrogenic cause of hyperglycemia, causes resistance to insulin action with the hyperinsulinemic-euglycemic (HE) clamp method.
Methods
Hyperinsulinemic euglycemic (about 100 mg/dL) clamps were performed before and then during infusion of norepinephrine, in doses of 110 ng·kg-1·min-1, which raised mean arterial pressure from 82 ± 7 to 94 ± 8 mmHg (p<0.01) in eleven healthy adults.
Results
The glucose infusion rate required to maintain euglycemia during the clamps, a marker of whole-body insulin sensitivity, decreased from 11.2 ± 3.7 mg·kg-1·min-1at baseline to 9.0 ± 2.6 mg·kg-1·min-1 (p=0.015) during the norepinephrine infusion. Steady-state insulin and C-peptide levels did not significantly change. Cortisol levels showed diurnal variation at the beginning and were also different at steady state.
Conclusions
Infusion of pressor doses of norepinephrine causes resistance to insulin action in humans.
Keywords: Hyperglycemia, Critical Care, Hyperinsulinemic-Euglycemic Clamp, Vasopressors, Insulin Resistance
Introduction
Hyperglycemia is a well-described occurrence in acutely ill patients [1]. It has been observed in multiple classes of critically ill patients, including after trauma [2], stroke [3], acute myocardial infarction (MI) [4], post-coronary artery bypass grafting (CABG) [5], and sepsis [6] Inpatient hyperglycemia is a poor prognostic factor for in-hospital mortality and overall survival. In the post-MI [7] and post-acute ischemic stroke [8] populations, admission hyperglycemia is a predictor of increased mortality and costs of care. Achievement of glycemic control intraoperatively and post-operatively in CABG [9], after acute MI [10], and in the surgical ICU population [6] improve morbidity. Preventing hypoglycemia and its associated higher mortality [11] though remains a great clinical problem.
The etiology of hyperglycemia in severe illness is multi-factorial [12]. Cytokines, including TNF-α and interleukin 1 and -6, released during acute illness, particularly sepsis, are potent inducers of insulin resistance in liver and skeletal muscle through unclear changes in post-insulin receptor pathways [13]. Counterregulatory hormones, such as cortisol, epinephrine, norepinephrine, and glucagon, contribute to hepatic insulin resistance, demonstrated as an impaired ability of insulin to suppress gluconeogenesis [14]. Stress-induced peripheral, primarily skeletal muscle, insulin resistance also occurs through down-regulation of the glucose transporter [15] and various post-insulin receptor mechanisms that have also been implicated in the pathogenesis of type 2 diabetes mellitus [14]. Some of the reasons are simpler, such as excess provision of dextrose-rich fluids during enteral and parenteral feeding [16] and also with hemodialysis [17]. Bed rest also results in decreased insulin sensitivity, primarily at skeletal muscle [18].
The hyperglycemia observed in critically ill patients can be extremely labile. This lability seems particularly prominent during titration of vasopressors. The temporal relationship between titration of pressors and degree of hyperglycemia implies a medication or iatrogenic effect. The most widely used pressor is norepinephrine (NE), due to its effectiveness and lower adverse event profile compared to dopamine [19]. Norepinephrine, at the lowest doses (less than 2 μg/min), has predominant beta adrenergic effects with ionotropy and chronotropy. At usual therapeutic doses (greater than 4 μg/min), alpha adrenergic effects predominate with vasoconstriction leading to increased peripheral vascular resistance, increased blood pressure, and vagally-mediated reflex bradycardia. A previous study showed decreased insulin sensitivity during three-hour NE infusion as assessed by intravenous glucose tolerance test [20]. No study to date, however, has studied changes in insulin sensitivity with acute infusion of NE in humans using the gold standard technique for measuring insulin sensitivity, the hyperinsulinemic-euglycemic (HE) clamp. Insulin sensitivity, as defined by the HE clamp method, is represented by the glucose infusion rate needed to keep the blood glucose level at steady state given a set and stable insulin infusion [21]. Previous clamp studies with acute epinephrine infusion showed the development of insulin resistance that was blunted by concomitant beta-receptor blockade with propanolol [22]. These previous reports supported our hypothesis that acute NE infusion would decrease insulin sensitivity, as measured by the HE clamp method. This hypothesis was tested in healthy subjects.
Materials and Methods
Eleven lean subjects without a history of diabetes or hypertension gave written informed consent to participate in the study. The study was approved by the Human Research Protection Office of Washington University School of Medicine. Initial screening included a history and physical, collection of vital data (height, weight, waist circumference, blood pressure, and pulse), and fasting chemistries including glucose and lipids. All subjects were asked to consume a weight-maintaining diet containing at least 200 grams per day of carbohydrate for at least 3 days before the study day.
Insulin sensitivity was determined by the hyperinsulinemic-euglycemic clamp technique as previously described [23]. Each subject attended a single day of study with two HE clamps performed at the Clinical Research Unit. After an overnight fast (water permitted), participants were placed in a supine rest position and baseline blood pressure and pulse rate were measured. Two venous cannulas were inserted in one arm and another in a retrograde fashion in a dorsal hand or wrist vein of the contralateral arm for blood sampling. This hand was rested in a heated box (53-55°) to arterialize venous blood [24]. A primed constant rate infusion of insulin (40 mU/m2 surface area per minute) was administered. A variable rate of 20% dextrose was administered, through the same venous cannula, to maintain euglycemia (100 mg/dL). The initial clamp was infusion of insulin and 20% dextrose only. There was then a 1.5 hour rest period where insulin infusion was discontinued, and 20% dextrose infusion was down-titrated and stopped. The above procedure was then repeated with addition of norepinephrine (NE) infusion (8 mg diluted in 250 mL 0.9% saline) through a separate venous cannula, starting at time of insulin and 20% dextrose infusions. It was titrated to achieve an elevation of blood pressure of at least 15/7 mmHg but no greater than 160 mmHg systolic or 10 μg/min of NE. During NE infusion, blood pressure and pulse rate were monitored every 10 minutes using a semi-automatic sphygmomanometer with careful monitoring of venous cannula site. During each clamp, at 10 minute intervals, 1 mL blood samples were collected for bedside glucose measurement. At baseline, one hour, and every 10 minutes for the last 40 minutes of each clamp, blood samples were collected for serum insulin, C-peptide, cortisol, and plasma catecholamines. The total amount of blood withdrawn was less than 180 mL during each study. After all blood samples were collected in the second clamp, the insulin infusion was discontinued, NE was downtitrated over 30 minutes, and the subject was served a meal. Blood glucose, blood pressure, and pulse rate were monitored and 20% dextrose was titrated down and discontinued. Venous cannulas were removed and the subject was discharged to home.
Analytical Procedures
Plasma glucose concentration was measured by a glucose oxidase method (Yellow Springs Instruments, YSI) at the bedside. Insulin, C-peptide, and cortisol were measured by radioimmunoassay method. Plasma catecholamines were measured by high performance chromatography method.
Statistical Analysis
Whole body insulin sensitivity (M) in mg·kg-1·min-1 was calculated under steady-state conditions during the last 40 minutes of each HE clamp procedure. To calculate the steady state plasma glucose and insulin concentrations, the mean values during the last 40 minutes of each clamp were used. All data are presented as mean ± SD. Whole-body insulin sensitivity (M) and glucose at steady state were compared by the Student’s t test for paired data analysis. Insulin, C-peptide, cortisol, and catecholamine data are compared for inter-clamp variation by repeated-measures ANOVA. Calculated from previously published data, this study has 80% power to detect a 15% difference in insulin sensitivity [25]. Differences were considered to be statistically significant for p<0.05.
Results
The study group consisted of six men and five women. Characteristics of the subjects are shown in Table 1. Hemodynamic parameters during the baseline and norepinephrine HE clamps are detailed in table 2. NE infusion (mean infusion rate of 110 ± 24 ng·kg-1·min-1) achieved a significant rise in mean arterial pressure (MAP) and both systolic and diastolic blood pressure. All blood pressure measurements did not change significantly during clamp with insulin-glucose infusion only. Heart rate did not change significantly during either clamp study or in the norepinephrine clamp as compared to the baseline clamp.
Table 1.
Study Participant Characteristics
| Age | 27 ± 7 years |
| Gender | |
| Male | 6 |
| Female | 5 |
| Weight | 69 ± 11 kg |
| BMI | 23.3 ± 1.5 kg/m2 |
| Waist Circumference | |
| Male | 80 ± 3 cm |
| Female | 68 ± 2 cm |
| Blood Pressure | 119 ± 8/72 ± 7 mmHg |
| Pulse Rate | 71 ± 10 bpm |
| Fasting Glucose | 83 ± 7 mg/dL |
All values are mean ± standard deviation.
Table 2.
Hemodynamic Parameters
| Baseline HE Clamp | Norepinephrine HE Clamp | |||
|---|---|---|---|---|
| Time 0’ | Steady State | Time 0’ | Steady State | |
| SBP, mmHg* | 118 ± 9 | 117 ± 8 | 118 ± 9 | 137 ± 8** |
| DBP, mmHg* | 68 ± 6 | 65 ± 9 | 65 ± 7 | 75 ± 8** |
| MAP, mmHg* | 85 ± 7 | 82 ± 7 | 82 ± 7 | 94 ± 8** |
| Heart Rate, bpm | 69 ± 6 | 71 ± 9 | 65 ± 11 | 64 ± 9 |
All values are mean ± standard deviation.
SBP=Systolic Blood Pressure, DBP = Diastolic Blood Pressure, MAP = Mean Arterial Pressure.
p<0.05.
Whole-body insulin sensitivity (M, mg·kg-1·min-1 glucose) significantly decreased from the insulin-glucose clamp as compared to the insulin-glucose-norepinephrine clamp, as shown in Figure 1. Average glucose at steady state euglycemia was 103 ± 8 mg/dL in the baseline clamp and 107 ± 13 mg/dL in the NE clamp (p=0.02). Insulin and C-peptide measurements were overall not statistically significant between the baseline and norepinephrine clamps by repeated measures ANOVA (see Table 3).
Figure 1. Altered Insulin Sensitivity with Pressor-Dose Norepinephrine Infusion.
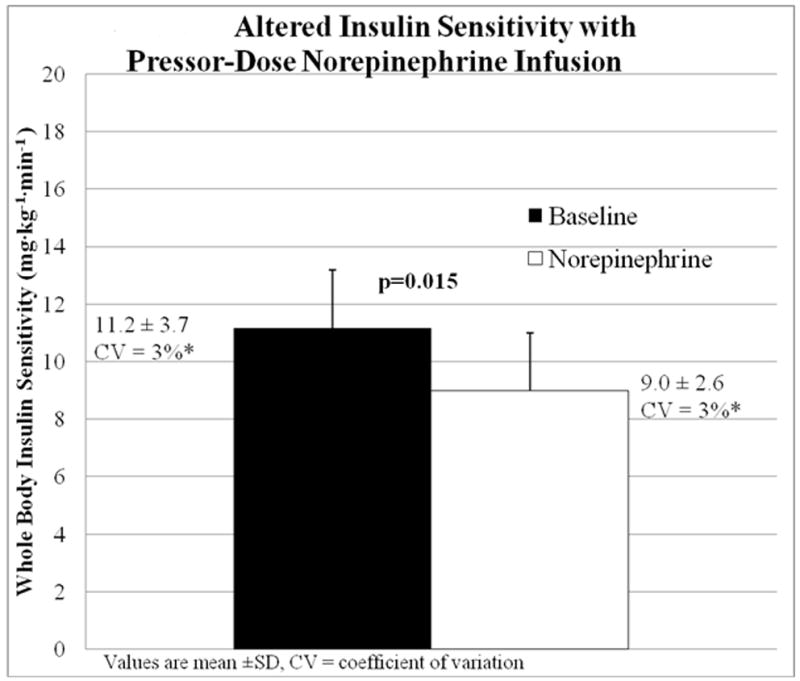
Mean ± SD of whole body insulin sensitivity (mg·kg-1·min-1 dextrose) during Baseline (■, insulin-glucose infusion) and Norepinephrine (□, insulin-glucose-norepinephrine infusion) hyperinsulinemic-euglycemic clamp studies compared by Student’s t-test.
Table 3.
Insulin, C-Peptide, Cortisol, and Catecholamine Trends during Study. Values are compared by repeated-measures ANOVA to detect inter-clamp variation between baseline (insulin -glucose infusion) and norepinephrine (insulin-glucose-norepinephrine infusion) clamp.
| Baseline | Norepinephrine | |
|---|---|---|
| Insulin (μIU/mL) | ||
| Time 0 | 6 ± 4 | 19 ± 12 |
| Time 1:00 | 51 ± 25 | 48 ± 17 |
| Steady State (2:00-3:00) | 57 ± 19 | 50 ± 16 |
| C-Peptide (ng/mL) | ||
| Time 0 | 1.4 ± 0.4 | 2.4 ± 0.8 |
| Time 1:00 | 1.9 ± 1.0 | 1.1 ± 0.5 |
| Steady State (2:00-3:00) | 1.9 ± 1.2 | 0.7 ± 0.5 |
| Cortisol (μg/dL)* | ||
| Time 0 | 14.7 ± 7.4 | 10 ± 4 |
| Time 1:00 | 10.2 ± 2.6 | 7 ± 2.4 |
| Steady State (2:00-3:00) | 7.1 ± 2.5 | 8.1 ± 3.2 |
| Epinephrine (pg/mL) | ||
| Time 0 | 23 ± 13 | 21 ± 12 |
| Time 1:00 | 20 ± 11 | 15 ± 0 |
| Steady State (2:00-3:00) | 19 ± 14 | 18 ± 6 |
| Norepinephrine (pg/mL)* | ||
| Time 0 | 189 ± 53 | 242 ± 125 |
| Time 1:00 | 193 ± 54 | 1230 ± 459 |
| Steady State (2:00-3:00) | 199 ± 56 | 2306 ± 736 |
All values are mean ± standard deviation.
p value < 0.05 by repeated-measures ANOVA.
Epinephrine values did not vary significantly between the two clamps at any time point, largely remaining undetectable by the assay used. As expected due to concomitant NE infusion, norepinephrine levels were significantly higher during this study period than during the baseline clamp. Cortisol levels were significantly greater (p = 0.042) in the morning baseline clamp than in the afternoon NE clamp. This significant value is likely due to the large difference at baseline measurements due to early morning glucocorticoid surge because values were remarkably similar by the time steady-state euglycemia was achieved in both groups (baseline clamp, 7.1 ± 2.5 μg/dL versus norepinephrine clamp, 8.1 ± 3.2 μg/dL).
Discussion
In this study, altered insulin sensitivity with acute norepinephrine infusion was studied using the gold-standard hyperinsulinemic-euglycemic clamp methodology. We demonstrate that NE infusion significantly decreases insulin sensitivity in lean adults without a history of diabetes mellitus or hypertension. The amount of NE needed to achieve the desired rise in blood pressure varied little among subjects (SD = 0.24 mg·kg-1·min-1), indicating a fairly uniform response to the study intervention. The methodology seems sound as the degree of hyperinsulinemia achieved during the baseline and NE portions of the study were similar.
It is difficult, however, to discount an “order effect” – all clamps were performed with a baseline clamp first in the morning followed by the norepinephrine clamp. This could result in falsely positive results if insulin sensitivity is less later on in the day or the effects of norepinephrine could have been reduced if subjects were more sensitive after an initial clamp. On closer examination of the data, three subjects had increased insulin sensitivity during NE infusion. These subjects were older than the mean and median age of subjects though they did not have significantly worse fasting glucose, cholesterol, or blood pressure values.
Multiple researchers have studied the effects of norepinephrine infusion on carbohydrate metabolism. Proposed mechanisms include altered hepatic glucose output, altered insulin secretion, and altered glucose utilization at skeletal muscle. The body of research thus far indicates that NE alters insulin sensitivity primarily at the hepatocyte through increased glycogenolysis and gluconeogenesis [26],[27], to a lesser extent at skeletal muscle [20],[26], and possibly not at all through altered insulin secretion [20],[28]. As this study did not utilize tracers to identify endogenous glucose production from infused dextrose or to track glucose uptake into muscle tissue, it is difficult to fully elucidate the mechanisms responsible for the decrement in insulin sensitivity with NE infusion.
This research is a preliminary study about the clinically challenging topic of hyperglycemia associated with critical illness. Like previous studies of human metabolism and physiology, we have started by studying the phenomenon in healthy adults. Determining if a similar result occurs in a model of a critically ill adult with fixed-dose infusions of various counter-regulatory hormones, such as cortisol, glucagon, or growth hormone, would be elucidating and is an avenue for future research. We believe, though, that our preliminary study still has clinical implications in the management of hyperglycemia. This study demonstrates a reduction in insulin sensitivity occurring with NE administration, suggesting that insulin infusion rates will need to increase during times of hemodynamic support, and decrease as these therapies are weaned and discontinued. If hyperglycemia on lower doses of NE is treated based on insulin requirements on higher doses of NE, hypoglycemia could occur. Intravenous insulin protocols do not typically account for changes in commonly used therapeutics in the intensive care setting. This puts the patient at risk for hypoglycemia that could be prevented with better understanding of the metabolic effects of drugs used for other purposes. While the magnitude of this effect will vary from patient to patient, an informed caretaker will be able to manage patients with changing clinical status more effectively, preventing extremes in blood glucose as a consequence of insulin infusion regimens that do not adapt to changing pharmacologic therapies.
Acknowledgments
The authors would like to acknowledge the staff of the Washington University School of Medicine Intensive Research Unit, Core Laboratory, and Diabetes Research and Training Center for their assistance.
Funding Support: Mentors in Medicine Program at Washington University School of Medicine, Department of Internal Medicine and Diabetes Research Training Center Grant #5 P60 DK020579-32
References
- 1.Cely CM, Arora P, Quartin AA, Kett DH, Schein RM. Relationship of baseline glucose homeostasis to hyperglycemia during medical critical illness. Chest. 2004;126(3):879–887. doi: 10.1378/chest.126.3.879. [DOI] [PubMed] [Google Scholar]
- 2.Yang SY, Zhang S, Wang ML. Clinical significance of admission hyperglycemia and factors related to it in patients with acute severe head injury. Surg Neurol. 1995;44(4):373–377. doi: 10.1016/0090-3019(96)80243-6. [DOI] [PubMed] [Google Scholar]
- 3.Gray CS, Taylor R, French JM, Alberti KG, Venables GS, James OF, Shaw DA, Cartlidge NE, Bates D. The prognostic value of stress hyperglycaemia and previously unrecognized diabetes in acute stroke. Diabet Med. 1987;4(3):237–240. doi: 10.1111/j.1464-5491.1987.tb00870.x. [DOI] [PubMed] [Google Scholar]
- 4.Capes SE, Hunt D, Malmberg K, Gerstein HC. Stress hyperglycaemia and increased risk of death after myocardial infarction in patients with and without diabetes: a systematic overview. Lancet. 2000;355(9206):773–778. doi: 10.1016/S0140-6736(99)08415-9. [DOI] [PubMed] [Google Scholar]
- 5.Thourani VH, Weintraub WS, Stein B, Gebhart SS, Craver JM, Jones EL, Guyton RA. Influence of diabetes mellitus on early and late outcome after coronary artery bypass grafting. Ann Thorac Surg. 1999;67(4):1045–1052. doi: 10.1016/s0003-4975(99)00143-5. [DOI] [PubMed] [Google Scholar]
- 6.van den Berghe G, Wouters P, Weekers F, Verwaest C, Bruyninckx F, Schetz M, Vlasselaers D, Ferdinande P, Lauwers P, Bouillon R. Intensive insulin therapy in the critically ill patients. N Engl J Med. 2001;345(19):1359–1367. doi: 10.1056/NEJMoa011300. [DOI] [PubMed] [Google Scholar]
- 7.Malmberg K, Norhammar A, Wedel H, Rydén L. Glycometabolic state at admission: important risk marker of mortality in conventionally treated patients with diabetes mellitus and acute myocardial infarction : long-term results from the Diabetes and Insulin-Glucose Infusion in Acute Myocardial Infarction (DIGAMI) study. Circulation. 1999;99(20):2626–2632. doi: 10.1161/01.cir.99.20.2626. [DOI] [PubMed] [Google Scholar]
- 8.Williams LS, Rotich J, Qi R, Fineberg N, Espay A, Bruno A, Fineberg SE, Tierney WR. Effects of admission hyperglycemia on mortality and costs in acute ischemic stroke. Neurology. 2002;59(1):67–71. doi: 10.1212/wnl.59.1.67. [DOI] [PubMed] [Google Scholar]
- 9.Furnary AP, Gao G, Grunkemeier GL, Wu Y, Zerr KJ, Bookin SO, Floten HS, Starr A. Continuous insulin infusion reduces mortality in patients with diabetes undergoing coronary artery bypass grafting. J Thorac Cardiovasc Surg. 2003;125(5):1007–1021. doi: 10.1067/mtc.2003.181. [DOI] [PubMed] [Google Scholar]
- 10.Malmberg K, Rydén L, Hamsten A, Herlitz J, Waldenström A, Wedel H. Effects of insulin treatment on cause-specific one-year mortality and morbidity in diabetic patients with acute myocardial infarction DIGAMI Study Group Diabetes Insulin-Glucose in Acute Myocardial Infarction. Eur Heart J. 1996;17(9):1337–1344. doi: 10.1093/oxfordjournals.eurheartj.a015067. [DOI] [PubMed] [Google Scholar]
- 11.The NICE-SUGAR Study Investigators. Finfer S, Chittock DR, Su SY, Blair D, Foster D, Dhingra V, Bellomo R, Cook D, Dodek P, Henderson WR, Hébert PC, Heritier S, Heyland DK, McArthur C, McDonald E, Mitchell I, Myburgh JA, Norton R, Potter J, Robinson BG, Ronco JJ. Intensive versus conventional glucose control in critically ill patients. N Engl J Med. 2009;360(13):1283–1297. doi: 10.1056/NEJMoa0810625. [DOI] [PubMed] [Google Scholar]
- 12.McCowen KC, Malhotra A, Bistrian BR. Stress-induced hyperglycemia. Crit Care Clin. 2001;17(1):107–124. doi: 10.1016/s0749-0704(05)70154-8. [DOI] [PubMed] [Google Scholar]
- 13.Hotamisligil GS, Spiegelman BM. Tumor necrosis factor alpha: a key component of the obesity-diabetes link. Diabetes. 1994;43(11):1271–1278. doi: 10.2337/diab.43.11.1271. [DOI] [PubMed] [Google Scholar]
- 14.Mizock BA. Alterations in carbohydrate metabolism during stress: a review of the literature. Am J Med. 1995;98(1):75–84. doi: 10.1016/S0002-9343(99)80083-7. [DOI] [PubMed] [Google Scholar]
- 15.Kuroda M, Honnor RC, Cushman SW, Londos C, Simpson IA. Regulation of insulin-stimulated glucose transport in the isolated rat adipocyte. cAMP-independent effects of lipolytic and antilipolytic agents. J Biol Chem. 1987;262(1):245–253. [PubMed] [Google Scholar]
- 16.Schloerb PR, Henning JF. Patterns and problems of adult total parenteral nutrition use in US academic medical centers. Arch Surg. 1998;133(1):7–12. doi: 10.1001/archsurg.133.1.7. [DOI] [PubMed] [Google Scholar]
- 17.Frankenfield DC, Reynolds HN, Badellino MM, Wiles CE., 3rd Glucose dynamics during continuous hemodiafiltration and total parenteral nutrition. Intensive Care Med. 1995;21(12):1016–1022. doi: 10.1007/BF01700664. [DOI] [PubMed] [Google Scholar]
- 18.Stuart CA, Shangraw RE, Prince MJ, Peters EJ, Wolfe RR. Bed-rest-induced insulin resistance occurs primarily in muscle. Metabolism. 1988;37(8):802–806. doi: 10.1016/0026-0495(88)90018-2. [DOI] [PubMed] [Google Scholar]
- 19.De Backer D, Biston P, Devriendt J, Madl C, Chochrad D, Aldecoa C, Brasseur A, Defrance P, Gottignies P, Vincent J-L SOAP II Investigators. Comparison of dopamine and norepinephrine in the treatment of shock. N Engl J Med. 2010;362(9):779–789. doi: 10.1056/NEJMoa0907118. [DOI] [PubMed] [Google Scholar]
- 20.Marangou AG, Alford FP, Ward G, Liskaser F, Aitken PM, Weber KM, Boston RC, Best JD. Hormonal effects of norepinephrine on acute glucose disposal in humans: a minimal model analysis. Metabolism. 1988;37(9):885–891. doi: 10.1016/0026-0495(88)90124-2. [DOI] [PubMed] [Google Scholar]
- 21.Ferrannini E, Mari A. How to measure insulin sensitivity. J Hypertens. 1998;16(7):895–906. doi: 10.1097/00004872-199816070-00001. [DOI] [PubMed] [Google Scholar]
- 22.Deibert DC, DeFronzo RA. Epinephrine-induced insulin resistance in man. J Clin Invest. 1980;65(3):717–721. doi: 10.1172/JCI109718. [DOI] [PMC free article] [PubMed] [Google Scholar]
- 23.DeFronzo RA, Tobin JD, Andres R. Glucose clamp technique: a method for quantifying insulin secretion and resistance. Am J Physiol. 1979;237(3):E214–E223. doi: 10.1152/ajpendo.1979.237.3.E214. [DOI] [PubMed] [Google Scholar]
- 24.Liu D, Moberg E, Kollind M, Lins P-E, Adamson U, Macdonald IA. Arterial, arterialized venous, venous and capillary blood glucose measurements in normal man during hyperinsulinaemic euglycaemia and hypoglycaemia. Diabetologia. 1992;35(3):287–290. doi: 10.1007/BF00400932. [DOI] [PubMed] [Google Scholar]
- 25.Morris AD, Petrie JR, Ueda S, Connell JM, Elliott HL, Small M, Donnelly R. Pressor and subpressor doses of angiotensin II increase insulin sensitivity in NIDDM. Dissociation of metabolic and blood pressure effects. Diabetes. 1994;43(12):1445–1449. doi: 10.2337/diab.43.12.1445. [DOI] [PubMed] [Google Scholar]
- 26.Sacca L, Morrone G, Ciacala M, Corso G, Ungaro B. Influence of epinephrine, norepinephrine, and isoproterenol on glucose homeostasis in normal man. J Clin Endocrinol Metab. 1980;50(4):680–684. doi: 10.1210/jcem-50-4-680. [DOI] [PubMed] [Google Scholar]
- 27.James DE, Burleigh KM, Kraegen EW. In vivo glucose metabolism in individual tissues of the rat. Interaction between epinephrine and insulin. J Biol Chem. 1986;261(14):6366–6374. [PubMed] [Google Scholar]
- 28.Silverberg AB, Shah SD, Haymond MW, Cryer PE. Norepinephrine: hormone and neurotransmitter in man. Am J Physiol. 1978;234(3):E252–E256. doi: 10.1152/ajpendo.1978.234.3.E252. [DOI] [PubMed] [Google Scholar]