

Abstract
Glutamate transporters catalyze concentrative uptake of the neurotransmitter into glial cells and neurons. Their transport cycle involves binding and release of the substrate on the extra- and intracellular sides of the plasma membranes, and translocation of the substrate-binding site across the lipid bilayers. The energy of the ionic gradients, mainly sodium, fuels the cycle. Here, we used a cross-linking approach to trap a glutamate transporter homologue from Pyrococcus horikoshii in key conformational states with substrate-binding site facing either the extracellular or intracellular sides of the membrane to study their binding thermodynamics. We show that the chemical potential of sodium ions in solution is exclusively coupled to substrate binding and release, and not to substrate translocation. Despite the structural symmetry, the binding mechanisms are distinct on the opposite sides of the membrane and more complex than the current models suggest.
Introduction
Ion-coupled active transporters move their substrates against concentration gradients using the energy of ionic gradients. To achieve this, the coupled ions drive cycles of conformational changes, which entail the transporter binding its substrate on one side of the membrane, translocating and releasing it on the other side, and finally returning to the initial conformation (Fig. 1a). Despite the wealth of the functional and structural data supporting this view, the role of ions in this process remains incompletely understood, and several mechanisms of coupling have been proposed1. Some of them suggest that the ions control the substrate binding affinity on the opposite sides of the membrane, while others focus on their role in modulating the kinetics of the translocation steps1,2.
Figure 1. Constraining GltPh in the outward and inward facing states.

(a) Schematic representation of the transport cycle. The dashed boxes highlight the substrate (S) binding/unbinding equilibria on the extracellular and intracellular sides of the membrane. (b) The crystal structures of single protomers of GltPhout (top) and GltPhin (bottom) cross-linked with Hg2+. Trimerization domains are shown in surface representation and colored wheat. Interfacial regions of the transport domains are shown as ribbons with the remainder of the transport domain omitted for clarity. TMs 7 and 8 are colored blue, HP1 yellow and HP2 red. Bound substrates are shown as sticks and ions are emphasized as spheres with Na+ colored green and Hg2+ black. (c) ITC analysis of Hg2+ binding at 25 °C to GltPh L66C S300C (top) and GltPh K55C A364C (bottom). Shown are Hg2+ titrations of the apo transporters in the presence of 1 mM Na+ (open symbols) and Asp-bound transporters in the presence of 10 mM Na+ and 0.2 mM Asp (solid symbols) transporters. The black lines through the data are the best fits to the independent binding sites model with parameters listed in Supplementary Table 2. The Hg2+ binding thermal powers are shown in the upper (Asp-bound) and lower insets (apo) with the bar scales indicating 0.1 μcal/sec and 500 sec in vertical and horizontal directions, respectively.
The paucity of the confirmed coupling mechanisms is largely due to the experimental challenges of dissecting the role of ions in substrate binding and in translocation reactions. To circumvent these difficulties and to probe the role of ions in the isolated steps of a transport cycle, we have developed a novel experimental approach, using a prokaryotic homologue of the glutamate transporter family, GltPh, as a model system. GltPh originates from a hyper-thermophilic archaeon Pyrococcus horikoshii, and symports aspartate and sodium with a 1:3 substrate to ion stoichiometry3,4. It is the only member of the family with known high-resolution structures5–8. The crystallographic studies have shown that the translocation of the substrate-binding site across the membrane involves a 15–18 Å trans-membrane movement of a peripheral transport domain relative to a central trimerization domain (Fig. 1b)5–8. The latter mediates the inter-subunit contacts within the trimeric GltPh, while the former coordinates sodium (Na+) ions and substrate l-aspartate (Asp). The Asp and two Na+ binding sites have been identified crystallographically; the location of the third Na+ site is still debated6,9–15. Na1 site is located deep in the core of the transport domain, while Na2 site is on the surface and is formed in part by the helical hairpin (HP) 2 (Fig.1b). Notably, bound Asp does not contribute directly to either of the sites. The structures of the unbound transporter and hence, the mechanisms by which the substrate and ions are released remain unknown. However, a clue is provided by a structure of GltPh in the outward facing state in complex with a competitive blocker, l-threo-β-benzyloxyaspartate (l-TBOA)6, in which the blocker is bound in the substrate-binding pocket with its benzyl group propping HP2 in an open conformation and disrupting Na2 binding site, suggesting that HP2 serves as the extracellular gate of the transporter6,16–18.
To dissect the mechanism of the energetic coupling between binding of Na+ ions and Asp to the isolated outward and inward facing states of GltPh, we introduced pairs of cysteine mutations, one in the transport domain and the other in the trimerization domain, which upon cross-linking trapped the transporter in either of these states and disallowed the translocation steps (Fig. 1b). Using this approach, we show that in both the outward and inward facing states binding of Asp is coupled to binding of all 3 co-transported Na+ ions and that binding of the ligands is highly cooperative. Hence, essentially all available chemical potential of Na+ ions is coupled to substrate binding, while further conformational changes, including the trans-membrane movements of the transport domains, occur independently of the ions. Furthermore, based on the experimentally determined heat capacity changes upon binding, we conclude that despite similar structure of the substrate and ion binding sites in the outward and inward facing states, the molecular events underlying binding, particularly of the first 2 Na+ ions, are distinct in these states and are more complex than available crystal structures would suggest.
Results
Trapping GltPh in the outward and inward facing states
To characterize the binding properties of the main conformational states of GltPh, we “stapled” together the transport and trimerization domains in either the outward or inward facing states using mercury (Hg2+)-mediated cross-linking of double cysteine mutants. Previous studies showed that in Hg2+-crosslinked GltPh K55C A364C (GltPhin), the transport domain is trapped in the inward-facing position7. By analogy, we engineered a double cysteine mutant GltPh L66C S300C based on the outward facing structure of the wild type (WT) GltPh6. Following crosslinking, we confirmed the outward orientation of the transport domain by crystallography (GltPhout, Fig. 1b, Table 1, Supplementary Fig. 1). Like GltPhin, GltPhout shows peaks in the anomalous difference Fourier maps adjacent to the sulfur atoms of the cysteine residues (Supplementary Fig. 1b), revealing Hg2+ ions in the expected positions and distant from the substrate and ion binding sites (Fig. 1b). Structures of GltPhout and GltPhin (ref. 5 and this study) were similar to those obtained in the absence of cross-links6,8 (with root mean squared deviations of ~0.9 Å). Isothermal titration calorimetery (ITC) experiments showed that Hg2+ binds to the GltPh L66C S300C and GltPh K55C A364C protomers with 1:1 stoichiometry and nanomolar affinity both in the substrate bound and free states (Fig. 1c and Supplementary Table 1). These results confirm that Hg2+-crosslinking traps the mutant transporters in the outward and inward facing states, respectively, regardless of whether they are bound to the substrate or not.
Table 1.
Data collection and refinement statistics
| GltPhin | |
|---|---|
| Data collection | |
| Space group | P61 |
| Cell dimensions | |
| a, c (Å) | 119.7, 333.7 |
| α, β, γ (°) | 90.0, 90.0, 120.0 |
| Resolution (Å) | 50.0–4.5 (4.58–4.50)* |
| Rsym or Rmerge | 9.7 (NA) |
| I / σI | 14.4 (2.3) |
| Completeness (%) | 100 (100) |
| Redundancy | 12.6 (12.7) |
| Refinement | |
| Resolution (Å) | 30 – 4.5 |
| No. reflections | 15,950 |
| Rwork / Rfree | 26.8/29.9 |
| No. atoms | 8,727 |
| Protein | 8,694 |
| Ligand/ion | 33 |
| Water | 0 |
| B-factors | 227.7 |
| Protein | 227.7 |
| Ligand/ion | 215.3 |
| r.m.s. deviations | |
| Bond lengths (Å) | 0.004 |
| Bond angles (°) | 0.8 |
Values in parentheses are for highest-resolution shell.
Ions drive substrate binding to the isolated states
Using ITC, we showed that Asp binds with 1:1 stoichiometry and similar affinities to GltPhout, GltPhin and the unconstrained WT transporter in the presence of 10 mM Na+ (Fig. 2a). The dissociation constants (KDs) were 240 ± 50, 290 ± 30 and 480 ± 10 nM, respectively. Hence, the transporter has similar intrinsic affinities for its substrate on the opposite sides of the membrane at 25 °C. Similar results have been obtained in other families of ion-coupled transporters2.
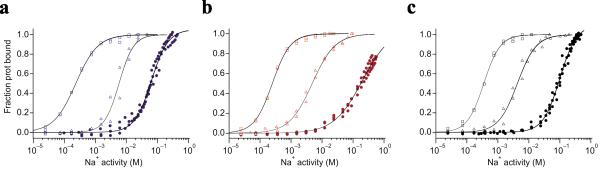
Figure 2. Na+-coupled binding to the outward and inward facing states.

Binding data at 25 °C for GltPhout, GltPhin in and WT transporter are shown in blue (left), red (center) and black (right), respectively. (a) Asp binding isotherms derived from the ITC experiments conducted in the presence of 10 mM Na+. Solid black lines through the data are the fits to independent binding sites model with the following parameters for the three constructs, respectively: KDs, 220, 211 and 493 nM; ΔHs, −16.4, −17.8, −12.3 kcal mol−1; and apparent number of binding sites, n, 0.8, 0.8 and 1.0. Insets show the Asp binding thermal powers with the corresponding scales. (b) Asp titrations derived from fluorescence-based assays in the presence of 1 mM Na+ at 25 C°. Solid black lines through the data are fits to the single-site quadratic equation with KDs of 125, 232 and 457 μM for GltPhout, GltPhin and WT, respectively. Insets show the percentage of the fluorescence change of RH421 dye as a function of time. The vertical lines mark additions of Asp aliquots. (c) Logarithmic plots of the Asp (circles) and TBA (squares) KDs as functions of Na+ activities. Data were obtained from ITC (solid symbols) and fluorescence-based (open symbols) experiments. Solid lines represent the best fits of the data to equation (1) with the parameters shown next to the graphs. The y-axis on the right shows corresponding binding free energies.
Binding of Asp to WT GltPh was shown to be coupled to binding of Na+ ions6. We asked whether this coupling is a property intrinsic to the outward and inward facing states or whether it requires unrestrained movements of the transport domain. To explore a wide range of binding constants, we optimized a fluorescence-based assay, developed by the Apell laboratory19,20. A voltage sensitive amphipathic dye, RH421, is incorporated into the protein/detergent particles and reports on binding of ligands that alter the local electric field21. Coupled Na+ and Asp binding was measured by detecting the decrease in the emission intensity of the probe (Fig. 2b, Supplementary Fig. 2a). The KDs, obtained by fitting the normalized fluorescence changes, were in excellent agreement with those obtained in ITC experiments (Fig. 2c).
The Asp KDs of all transporter variants were strongly Na+-dependent, and the logarithmic plots of the affinities as a function of Na+ activity yielded straight lines with slopes of 2.6, 2.6 and 2.9 for GltPhout, GltPhin and WT, respectively. These slopes represent the apparent numbers of Na+ ions coupled to binding of each substrate molecule. Hence, Asp binding is thermodynamically linked to binding of all three transported Na+ ions in WT GltPh. Moreover, in the constrained mutants the coupling efficiencies are similar, showing that transport domain movements are not necessary. We conclude that essentially all chemical potential of Na+ ions is transformed into substrate binding energy. These results contrast with the coupling mechanisms proposed for other families of secondary active transporters, in which the coupled ions do not change the affinity for the substrate2 or the substrate can bind in the absence of coupled ions22.
Functional studies on the mammalian glutamate transporters showed that, like in GltPh, 3 Na+ ions are co-transported with each substrate23–25. Because of the high degree of conservation of residues involved in Na+ and substrate coordination between GltPh and the mammalian homologues, it is likely that the efficient coupling between substrate and ions is also conserved. However, glutamate Km decreases approximately linearly with the increase of Na+ concentration12,26, corresponding to the slope of ~1 on the logarithmic plot. The relative insensitivity of the glutamate Km values to Na+ concentrations likely reflects the significant contributions from other steps in the cycle following binding, in particular the dissociation of the substrate on the opposite side of the membrane.
Inhibitor captures early events of the binding reaction
In parallel, we examined binding of inhibitors, L-threo-β-benzylaspartate (TBA)27, and DL-TBOA28. In these experiments, we focused on TBA rather than on the commonly used and structurally similar DL-TBOA because the latter is a mixture of stereoisomers, binding to the transporters with different affinities29 and complicating the analysis. TBA inhibits Asp transport by GltPh (Supplementary Fig. 2b) and binds to the constrained variants and WT GltPh with similar affinities (Fig. 2c). The Na+ dependence of TBA binding affinity was also similar for GltPhout, GltPhin and WT, and was weaker than that for Asp with slopes of 1.9, 2.2, and 1.6, respectively (Fig. 2c).
To confirm that TBA binds to the same site as Asp, we first saturated the transporters with TBA and then titrated them with Asp using ITC. As expected for the competitive binding, the free energies and enthalpies of Asp binding to TBA-loaded transporters agree with the values calculated for TBA replacement by Asp using the individually measured binding parameters (Supplementary Fig. 3, Supplementary Table 1). We conclude that TBA binds to both the outward and inward facing states in the substrate binding pockets, disrupting one of the Na+ binding sites. These results are in excellent agreement with previous studies, showing that L-TBOA binds to the outward facing GltPh with its backbone in the substrate binding site and the benzyl group preventing HP2 from occluding the site and forming Na2 site6. Based on this, we hypothesize that the TBA-bound states can be viewed as intermediates of the binding reactions, in which two Na+ ions and Asp are already bound but not yet occluded. If so, TBA offers a tool to gain insights into the energetics of the two processes: the initial binding of the substrate coupled to two Na+ ions, and its occlusion coupled to the third Na+ ion. The latter process is represented by the TBA replacement with Asp.
Na+ binding and allosteric coupling
Using the fluorescence-based assay, we also examined Na+ binding to GltPh variants in the absence of Asp and TBA. Na+ binds weakly to the WT and constrained transporters with KDs above 50 mM, corresponding to the binding free energy of approximately −1 kcal mol−1 (Fig. 3). In the case of GltPhin, we were unable to reach saturation due to nonspecific effects of Na+ concentrations above 500 mM on the fluorescent probe. In this case, the estimation of Na+ KD was not significantly affected, but an accurate determination of the Hill coefficient was not possible. In contrast, both GltPhout and WT transporter yielded reproducible Hill coefficients of 1.6, suggesting that the transporters bind at least 2 sodium ions in the absence of other ligands. Because the architecture of Na+ binding sites is similar in the inward and outward facing states, we tentatively conclude that 2 Na+ ions bind to both states. Additions of Asp and TBA shift the Na+ binding isotherms to lower concentrations in all cases as expected for cooperative binding (Fig. 3 and Supplementary Fig. 4). The ability of the transporter to bind Na+ in the absence of substrate may account for a previously reported weaker coupling between binding of Asp and Na+ ions to the WT GltPh6. In this earlier study, measurements of Asp binding in the presence of Na+ concentrations of up to 200 mM have been included; under these conditions some of the sodium ion binding sites are already occupied.
Figure 3. Na+ binding.
Na+ binding isotherms at 25 °C derived from the fluorescence-based assays using RH421 dye for (a) GltPhout, (b) GltPhin and (c) WT in the absence of other ligands (solid circles), and in the presence of 1 mM Asp (open squares) or 1 mM TBA (open triangles). Solid black lines are fits to Hill equations. The fitted KD values in mM and Hill coefficients were, respectively, in (a): 64.2, 1.6 (no Asp); 0.2, 1.2 (1 mM Asp); 5.8, 1.8 (1 mM TBA); listed in the same order in (b): 198.0, 0.9; 0.2, 1.5; 4.8, 1.2; and in (c): 99.3, 1.6; 0.4, 1.6; 4.3, 1.4. The normalization points for the fits of the data in solid circle were obtained by adding 1 mM Asp to the cuvette after the Na+ titrations to ensure saturation of the Na+ binding sites.
To evaluate the standard free energies, ΔG0, of the coupled binding of 3 Na+ and Asp or 2 Na+ and TBA, we note that the observed free energy, ΔGapp can be expressed as:
| (1) |
where μNa is the chemical potential of Na+ ions and α is the apparent number of Na+ ions coupled to binding of the ligand (Supplementary Note). From the linear fits in Fig. 2c, we obtain ΔG0 of 3 Na+ and Asp and 2 Na+ and TBA binding to GltPh of ~ −16 and ~ −10 kcal mol−1, respectively, for both the outward and inward facing states. Importantly, only small fractions of these large favorable free energies originate from binding of Na+ ions, inhibitor or substrate alone, and the majority comes from coupling between the ligands. To the extent of our current knowledge, the substrate does not directly coordinate Na+ ions, and the observed cooperativity must arise from allosteric interactions.
The thermodynamic mechanisms
The magnitude of the heat capacity changes upon binding, ΔCP, is a unique experimental readout of the complexity of the underlying reaction, which can often be related to the extent of the protein conformational changes30–33. Hence, we determined ΔCPs associated with overall binding of 3 Na+ and Asp and key intermediate steps: binding of the first 2 Na+ ions, binding of TBA, mimicking initial substrate binding, and TBA displacement by Asp, mimicking substrate occlusion and binding of the third Na+ ion.
To obtain ΔCp of the overall reaction, we determined the temperature dependence of the enthalpy (ΔH) of Asp binding in the presence of Na+ concentrations below 50 mM. Under these conditions, there is little ion binding alone, and only the coupled binding of 3 Na+ and Asp is observed. The reaction ΔH decreased linearly with temperature, yielding very large negative ΔCPs, constant within the tested temperature range (Fig. 4). Unexpectedly, we found that ΔCPs were significantly larger in the inward (−600 cal mol−1 K−1) compared to the outward facing state (−300 cal mol−1 K−1). This is in a sharp contrast with the structures, picturing nearly identical ion- and substrate-binding sites, and with the similar observed KD-s at 25 °C. In reactions dominated by protein conformational changes, ΔCP scales linearly with the buried polar and apolar surface areas31. If so, the observed ΔCPs would require burial of ~2000 and ~4000 Å2 of the protein surface in the outward and inward facing states, respectively31. The current models suggest that the release of the substrate from the outward and inward facing states is associated with the openings of the local gates: HP2 in the former and a structurally symmetric HP1 in the latter6,7,16–18,34. However, we estimate that HP2 closure buries only ~200 Å2, expected to give ΔCp of approximately −30 cal mol−1 K−1. In fact, the experimental ΔCPs are so large that they cannot be explained by protein conformational changes alone. Previously, unexpectedly large ΔCPs have been attributed to the entrapment of structured waters in the protein core during binding35, to heterogeneous apo state36 and to protein rigidification37 or folding coupled to binding38. Although we cannot distinguish between these possibilities, it is clear that binding involves more complex events in addition to the local conformational changes, and that these events are more extensive in the inward facing state.
Figure 4. Binding heat capacity changes.

Binding isotherms and enthalpies derived from ITC for (a) GltPhout and (b) GltPhin. Left panels, thermal powers and heats measured at 15 (solid circles and upper insets, respectively) and 35 °C (solid triangles and lower insets, respectively) are shown. The solid lines are the best fits to independent binding sites model. The fitted ΔH in kcal/mol, KD values in nM and n values were, respectively, in (a): −13.5, 154, 1.0 at 15 °C and −19.4, 1278 and 1.1 at 35 °C; and (b): −12.3, 373, 0.7 at 15 °C and −25.2, 540 and 0.8 at 35 °C. Right panels, temperature dependencies of the binding enthalpies for Asp in the presence of: 10 mM Na+ (solid circles), 1 M Na+ (open circles), and 30 mM Na+, 0.6 mM TBA (solid squares). The data were fitted to straight lines with the slopes corresponding to the ΔCps of binding: −297, −131, −171 cal mol−1 K−1, respectively, for GltPhout and −608, −184, −198 cal mol−1 K−1, respectively, for GltPhin.
Na+ binds too weakly to be measured by ITC directly. Instead, we measured ΔH and ΔCP of Asp binding to GltPhout and GltPhin the presence of 1 M Na+ (Fig. 4). Under these conditions all sites, to which Na+ ions bind in the absence of Asp, are occupied (Fig. 3). We observed that Asp binds to Na+-saturated transporter with 1:1 stoichiometry and KDs in the nM range or lower (Supplementary Fig. 5A). To obtain ΔCPs of Na+ binding, we calculated the differences between ΔCPs of Asp binding in the presence and in the absence of 1 M Na+ (Supplementary Note and Supplementary Fig. 5B). From this analysis, we found that binding of Na+ ions alone is already associated with large negative ΔCPs and that the differences between the ΔCPs of the coupled binding of 3 Na+ and Asp in the outward and inward facing states are almost entirely due to the differences in ion binding.
The ΔH and ΔCP values of TBA displacement by Asp were measured directly (Supplementary Fig. 3b). The ΔCPs of TBA binding to Na+-saturated transporter were then calculated as differences between the corresponding values for Asp binding in 1 M Na+ and TBA displacement (Supplementary Note and Supplementary Fig. 5B). From these calculations, the ΔCPs of TBA binding to Na+-saturated transporter were close to 0 in the outward and inward facing states (Fig. 5). As expected, similar small ΔCPs were calculated for D,L-TBOA (Supplementary Fig. 6). These measurements suggest that binding of the substrate backbone, mimicked by the inhibitor, occurs with little ΔCP as is typical for a small molecule binding to a pre-formed site39. The ΔCP values of Asp replacement of TBA, which mimics substrate occlusion and binding of the last Na+, were also similar in the outward and inward facing states (Fig 5). Notably, TBA is not likely to bind similarly in the two states: in the outward facing transport domain, the benzyl group is expected to prop HP2 in an open state, a conformation, which would be sterically prohibited when the domain is facing inward. Interestingly, the ΔCPs were again significantly larger than expected for HP2 closure, suggesting that during these steps of the binding reactions, events other than gate closures dominate the processes.
Figure 5. The thermodynamic scheme of the transport cycle and binding.
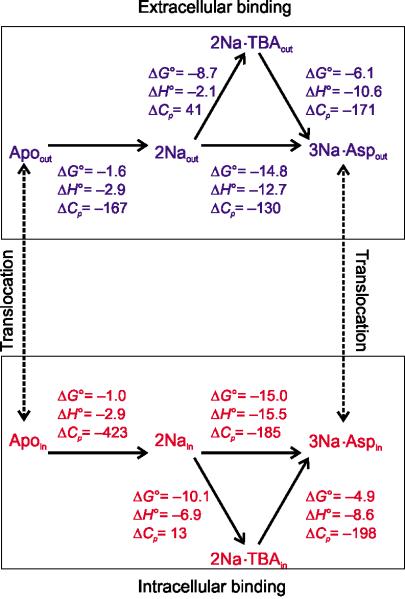
Top and bottom show the thermodynamic schemes of Na+, Asp and TBA binding reactions with corresponding thermodynamic parameters for the outward and inward facing states, respectively. The signs of the parameters correspond to the direction of the reactions indicated by the arrowheads. The broken lines represent the isomerization reactions between the outward and inward facing states. The ΔH0s, ΔG0s the ΔCPs were either obtained experimentally or calculated as described in Supplementary Figure 6. The units are kcal mol−1 for ΔH0s and ΔG0s, and cal mol−1 K−1 for ΔCPs.
Extrapolations to physiological temperatures
Our experiments were conducted at 25 °C, below the physiologic temperatures of ~100 °C, at which GltPh normally operates. At 25 °C, GltPh has a very high affinity for Asp making it an inefficient enzyme. Because the affinity is strongly dependent on Na+ concentration the transporter is functional, albeit slow, when reconstituted into proteo-liposomes with the internal Na+ near 03,6. In contrast, GltPh should be largely inactive when expressed in mesophilic cells: considering the intracellular concentrations of Na+ and Asp on the order of 10 and 1 mM, respectively, only 0.05 % of the inward facing transporters will be substrate-free, rendering them highly inefficient.
Many enzymes from thermophilic organisms are either completely inactive or very slow at ambient temperatures40, but when assayed at their physiological temperatures closely mimic their mesophilic counterparts41. To extrapolated the binding free energies to 100 °C, we used the standard thermodynamic equation:
| (2) |
where ΔGref is the free energy change measured at Tref = 25 °C (Supplementary Note). Such extrapolation is valid when ΔCP does not change significantly with temperature. It is possible that this assumption does not hold and hence, the obtained values reflect the general trend rather than precise estimates. Because the heat capacities differ significantly in the outward and inward facing state, the Asp affinities diverge at higher temperatures and are estimated to be 6.3 and 1400 μM, respectively, at 100 mM Na+ and 100 °C. The affinity for TBA in the outward-facing states is also about 50 times higher than in the inward-facing (Fig. 6). The decreased affinities at elevated temperatures are mostly due to the progressively less favorable free energy of Na+ binding. In fact, the extrapolations suggest that the transporter does not bind the ions without substrate at all, at least in the absence of the electric field. Approximately an order of magnitude higher Km values and two orders of magnitude higher inhibition constants in the inward facing state have been also measured for glutamate and dl-TBOA, respectively, in a mammalian homologue26. Lower intracellular affinity for the substrate in both the mammalian and archaeal transporters may reflect an evolutionary conserved mechanism to optimize the efficiency of substrate transport into the cytoplasm.
Figure 6. Temperature dependence of the binding energies.
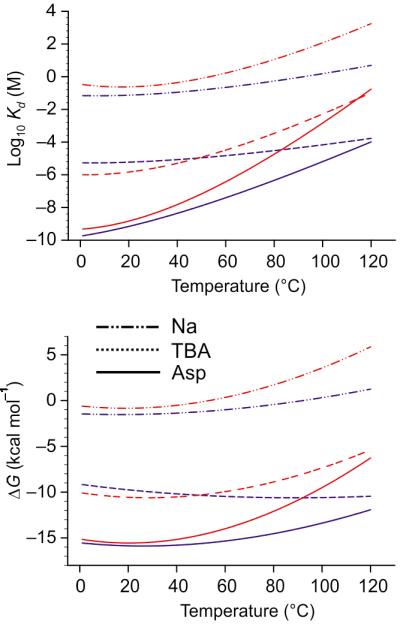
Shown are the temperature extrapolations of the binding free energies (top) and dissociation constants (bottom) for the outward (blue) and inward (red) facing states. Shown are the extrapolations for binding of 3 Na+/Asp (solid lines) and 2 Na+/TBA (broken lines) and for Na+ (dotted line). The KDs for binding of Asp and TBA were calculated at 100 mM Na+.
Discussion
Here, we have shown that binding of Asp to GltPh is strictly coupled to binding of all 3 co-transported Na+ ions and that all Na+ ions are bound before trans-membrane movement of the transport domain takes place. Hence, Na+ ions facilitate transport by driving substrate binding and unbinding on the opposite sides of the membrane, and not by, for example, binding to a translocation intermediate. Furthermore, while Asp does not bind to the transporter with a measurable affinity in the absence of Na+, 2 Na+ ions do bind alone, albeit weakly. Similarly, the mammalian glutamate transporters bind 1 or 2 Na+ ions weakly in a step that precedes binding of the substrate and the last Na+ ion42. Hence, we suggest that binding of the first 2 Na+ ions is a prerequisite for the consequent binding steps. The high cooperativity of Asp and Na+ binding, which is allosteric in nature, suggests that binding of the first 2 Na+ ions is associated with remodeling of the transporter core to form a competent substrate binding site, for which the ions pay large energetic penalty. Consistently, these early steps in the substrate binding reactions are associated with very large decreases of the protein heat capacity, which cannot be explained solely by the local conformational changes such as openings or closures of the gates. Instead, large ΔCPs suggest that the conformational changes are more extensive and/or are accompanied by rigidification of the protein or the involvement of water molecules. Consequent binding of the substrate backbone occurs with little additional conformational changes, while occlusion of the binding pocket and binding of the third Na+ ion is again associated with large ΔCPs, indicative of complex processes. It is interesting that the reaction steps associated with Na+ binding, and not with complexation of the substrate backbone, produce unexpectedly large heat capacity changes. To the best of our knowledge, the ΔCPs associated with ion binding to transport proteins have not been previously reported. However, large ΔCPs have been observed in studies of Na+ binding to serine proteases and attributed to rigidification of a flexible autolysis loop37. By analogy, we suggest that the large ΔCPs associated with Na+ binding to GltPh are due to diminished protein flexibility and that the apo inward facing state is more dynamic compared to the outward facing state. We conclude that Na+ ions do not bind to preformed sites, but instead trigger conformational changes within the protein and may also have global effects on the dynamic properties of the transporter.
In conclusion, the ability to isolate and study key conformational states of a transporter offers means to deconstruct the complex transport cycle into simple reactions amenable to quantitative analysis. Using this approach, we show that the outward and inward facing states of GltPh are similar in their ability to couple binding of all three Na+ ions to binding of the substrate. However, the molecular events underlying these coupled reactions are distinct and are more complex than expected for a simple ligand binding process accompanied by local conformational changes. Although further crystallographic studies of the apo states of GltPh will resolve the structural re-arrangements associated with ion-coupled substrate binding, the complementary thermodynamic data highlights the importance of the ensemble properties of these dynamic molecules.
Online Methods
DNA manipulations, protein preparation, concentration determination and activity assays
Double cysteine mutations were introduced within hepta-histidine cysteine-less mutant GltPh5 using QuickChange. Each protein was expressed as carboxyl terminal (His)8 fusion and purified as described previously5. Briefly, isolated crude membranes from DH10α E. coli over-expressing the protein variants were solubilized in n-dodecyl-ß-d-maltopyranoside (DDM) and applied to immobilized metal affinity resin in buffer containing in mM: 10 HEPES/KOH, 100 NaCl, 0.1 Asp and 0.4 DDM. The resin was washed in the same buffer supplemented with 40 mM imidazole, and proteins eluted in the presence of 250 mM imidazole. The (His)8 tag was removed by thrombin digestion and proteins were further purified by size exclusion chromatography (SEC)5 in appropriate buffers as indicated below. Protein concentration was determined by absorbance at 280 nm. The extinction coefficient was determined by conducting quantitative amino acid analysis (Keck Biotechnology Resource Laboratory, Yale University). GltPh L66C S300C, GltPh K55C A364C and WT GltPh showed similar results and the final extinction coefficient used was an average from the three proteins with a value of 57,400 M−1 cm−1. Importantly, this value is ~2 times higher than the value estimated from sequence (http://web.expasy.org/protparam/). For activity assays, GltPh was reconstituted into liposomes composed of total polar lipid extract: egg phosphatidylcholine 3:1 (w:w) at 1:50 protein to lipid ratio as described previously6. The proteo-liposomes were loaded with 20 mM HEPES/Tris, pH 7.4, 300 mM choline chloride and the uptake was measured at 30 °C in buffer containing 20 mM HEPES/Tris, pH 7.4, 200 mM choline chloride, 100 mM NaCl, 0.1 μM 3H Asp and increasing concentration of TBA or dl-TBOA as described6.
Protein crystallization and structure determination
Prior to crystallization, GltPh L66C S300C mutant was purified by SEC in buffer containing in mM: 10 HEPES/KOH, pH 7.4, 100 NaCl, 0.1 Asp and 7 n-decyl-β,d-maltopyranoside. Samples were concentrated to over 5 mg/ml and cross-linked with 10-fold molar excess of HgCl2. Cross-linked protein samples were dialyzed overnight against SEC buffer, and crystallized and cryo-protected as described previously5. The diffraction data were collected at 1.075 Å wavelength and cryogenic temperatures at the National Synchrotron Light Source beam line X29. Data were scaled using HKL200043 and further processed using CCP4 suite of programs44. The initial crystallographic phases were determined in Phaser45 using the trimeric trimerization domain and the three transport domains as independent search models. The protein model was further refined in Refmac5 with TLS46 and the electron density maps were examined in Coot47. Following refinement, 57.8, 39.8 and 2.4 % of the backbone dihedral angles were within core, allowed and disallowed regions of the Ramachandran plot, respectively. All structural figures were prepared using Pymol48.
Isothermal titration calorimetry
For ITC experiments, GltPh K55C A364C and GltPh L66C S300C were cross-linked following thrombin digest. To avoid chelation of Hg2+ ions by imidazole, proteins were exchanged into a buffer containing in mM: 10 HEPES/KOH pH 7.4, 50 NaCl, 50 KCl and 0.4 DDM, using 15 ml filters (Amicon, Inc.) with a molecular weight cutoff of 100 kDa. Proteins were concentrated to over 5 mg/ml, incubated with 10-fold molar excess of HgCl2, and purified by SEC using the following buffer in mM: 10 HEPES/KOH, pH 7.4, 1 NaCl, 99 KCl, and 0.4 DDM. For the binding experiments in 1 M NaCl, concentration of DDM was increased to 1 mM. WT GltPh was prepared in the same way except without buffer exchange and HgCl2 addition. Quantitative amino acid analysis of the non-hydrolyzed protein samples showed no detectable Asp or other free amino acids in the samples, showing that this protocol generates protein completely unbound from its substrate. Protein samples diluted to 15–40 μM in buffer supplemented with appropriate concentrations of NaCl were loaded into the reaction cell of a small volume NANO ITC (TA Instruments, Inc.). Appropriate titrant was loaded into the syringe and aliquots of 1.5 μl were injected every 3–5 minutes at constant temperature. For the competition experiments, the syringe was loaded with 200–300 μM Asp, 600 μM TBA and 30 mM NaCl and the cell with 40 μM protein, 600 μM TBA and 30 mM NaCl. Binding isotherms were analyzed using NanoAnalyze data analysis software using the independent binding site model (TA Instruments, Inc.).
Fluorescence-based binding assays
For fluorescence-based binding assays, GltPh samples were prepared as above and diluted to final concentration of 0.5–1 μM in the same buffer as for the ITC experiments, but using 0.2 instead of 0.4 mM DDM. The binding assays were performed at 25°C in the presence of 200 nM of RH421 dye (Invitrogen, Inc.). The fluorescence was excited and the emission detected at 532 nm and 628 nm, respectively, using a QuantaMaster 40 (Photon International Technology, Inc.). The protein solutions with dye were allowed to equilibrate under illumination for ~15 minutes until the fluorescence signal was stable. Aliquots of NaCl, Asp or TBA were added to the protein and the reaction mixtures were incubated until no additional fluorescence signal change could be detected. Binding isotherms were analyzed with SigmaPlot 12 (Systat Software, Inc.). For each ligand addition, the fluorescence signal acquired during the last 10 seconds of equilibration was averaged. The maximum signal change was determined by addition of 1 mM aspartate to the samples at the end of each titration. The fractional fluorescence change was calculated as the difference between measured and initial fluorescence normalized by the maximum fluorescence change. Asp or TBA titrations were fitted to the quadratic binding equation to take into account substrate depletion at low KDs, while Na+ titrations were fitted to Hill equation. When using the latter, care was taken that the measured KDs were at least 100-fold higher than the protein concentration used. Na+ activities were calculated as Activity = γ × [Na+], where γ is the activity coefficient calculated using Debye-Huckel equation
where A and B are empirical coefficients with values 0.51 and 1.5, respectively and I is the ionic strength of the solution.
Supplementary Material
Acknowledgements
Rockefeller high throughput screening facility is acknowledged for the use of their ITC instrument, contributing to the ITC studies. National Institute of Health grants R01 NS064357 (O.B.) and S10 RR026970 (O.B.) are acknowledged for supporting the research and providing funding for ITC instrumentation, respectively. National Synchrotron Light Source X29 beam line was used for data collection and we thank the staff for help and continuous support. We thank H. J. Appel for his advice on the use RH421 dye. We also thank Alessio Accardi for critical reading of the manuscript.
Footnotes
Author contributions N.R. and O.B. designed the experiments. N.R. and S.O. conducted the experiments, and N.R. and O.B. analyzed the data and wrote the manuscript.
References
- 1.Forrest LR, Kramer R, Ziegler C. The structural basis of secondary active transport mechanisms. Biochim Biophys Acta. 2011;1807:167–88. doi: 10.1016/j.bbabio.2010.10.014. [DOI] [PubMed] [Google Scholar]
- 2.Guan L, Kaback HR. Binding affinity of lactose permease is not altered by the H+ electrochemical gradient. Proc Natl Acad Sci U S A. 2004;101:12148–52. doi: 10.1073/pnas.0404936101. [DOI] [PMC free article] [PubMed] [Google Scholar]
- 3.Ryan RM, Compton EL, Mindell JA. Functional characterization of a Na+-dependent aspartate transporter from Pyrococcus horikoshii. J Biol Chem. 2009;284:17540–8. doi: 10.1074/jbc.M109.005926. [DOI] [PMC free article] [PubMed] [Google Scholar]
- 4.Groeneveld M, Slotboom DJ. Na+: aspartate coupling stoichiometry in the glutamate transporter homologue GltPh. Biochemistry. 2010;49:3511–3513. doi: 10.1021/bi100430s. [DOI] [PubMed] [Google Scholar]
- 5.Yernool D, Boudker O, Jin Y, Gouaux E. Structure of a glutamate transporter homologue from Pyrococcus horikoshii. Nature. 2004;431:811–8. doi: 10.1038/nature03018. [DOI] [PubMed] [Google Scholar]
- 6.Boudker O, Ryan RM, Yernool D, Shimamoto K, Gouaux E. Coupling substrate and ion binding to extracellular gate of a sodium-dependent aspartate transporter. Nature. 2007;445:387–93. doi: 10.1038/nature05455. [DOI] [PubMed] [Google Scholar]
- 7.Reyes N, Ginter C, Boudker O. Transport mechanism of a bacterial homologue of glutamate transporters. Nature. 2009;462:880–5. doi: 10.1038/nature08616. [DOI] [PMC free article] [PubMed] [Google Scholar]
- 8.Verdon G, Boudker O. Crystal structure of an asymmetric trimer of a bacterial glutamate transporter homolog. Nat Struct Mol Biol. 2012;19:355–7. doi: 10.1038/nsmb.2233. [DOI] [PMC free article] [PubMed] [Google Scholar]
- 9.Teichman S, Qu S, Kanner BI. A conserved asparagine residue located in the binding pocket controls cation selectivity and substrate interactions in a neuronal glutamate transporter. J Biol Chem. doi: 10.1074/jbc.M112.355040. [DOI] [PMC free article] [PubMed] [Google Scholar]
- 10.Huang Z, Tajkhorshid E. Identification of the third Na+ site and the sequence of extracellular binding events in the glutamate transporter. Biophys J. 99:1416–25. doi: 10.1016/j.bpj.2010.06.052. [DOI] [PMC free article] [PubMed] [Google Scholar]
- 11.Larsson HP, et al. Evidence for a third sodium-binding site in glutamate transporters suggests an ion/substrate coupling model. Proc Natl Acad Sci U S A. 107:13912–7. doi: 10.1073/pnas.1006289107. [DOI] [PMC free article] [PubMed] [Google Scholar]
- 12.Tao Z, et al. Mechanism of cation binding to the glutamate transporter EAAC1 probed with mutation of the conserved amino acid residue Thr101. J Biol Chem. 2010;285:17725–33. doi: 10.1074/jbc.M110.121798. [DOI] [PMC free article] [PubMed] [Google Scholar]
- 13.Rosental N, Bendahan A, Kanner BI. Multiple consequences of mutating two conserved beta-bridge forming residues in the translocation cycle of a neuronal glutamate transporter. J Biol Chem. 2006;281:27905–15. doi: 10.1074/jbc.M600331200. [DOI] [PubMed] [Google Scholar]
- 14.Holley DC, Kavanaugh MP. Interactions of alkali cations with glutamate transporters. Philos Trans R Soc Lond B Biol Sci. 2009;364:155–61. doi: 10.1098/rstb.2008.0246. [DOI] [PMC free article] [PubMed] [Google Scholar]
- 15.Bastug T, et al. Position of the third Na+ site in the aspartate transporter GltPh and the human glutamate transporter, EAAT1. PLoS One. 7:e33058. doi: 10.1371/journal.pone.0033058. [DOI] [PMC free article] [PubMed] [Google Scholar]
- 16.Huang Z, Tajkhorshid E. Dynamics of the extracellular gate and ion-substrate coupling in the glutamate transporter. Biophys J. 2008;95:2292–300. doi: 10.1529/biophysj.108.133421. [DOI] [PMC free article] [PubMed] [Google Scholar]
- 17.Shrivastava IH, Jiang J, Amara SG, Bahar I. Time-resolved mechanism of extracellular gate opening and substrate binding in a glutamate transporter. J Biol Chem. 2008;283:28680–90. doi: 10.1074/jbc.M800889200. [DOI] [PMC free article] [PubMed] [Google Scholar]
- 18.Focke PJ, Moenne-Loccoz P, Larsson HP. Opposite movement of the external gate of a glutamate transporter homolog upon binding cotransported sodium compared with substrate. J Neurosci. 2011;31:6255–62. doi: 10.1523/JNEUROSCI.6096-10.2011. [DOI] [PMC free article] [PubMed] [Google Scholar]
- 19.Habeck M, Cirri E, Katz A, Karlish SJ, Apell HJ. Investigation of electrogenic partial reactions in detergent-solubilized Na,K-ATPase. Biochemistry. 2009;48:9147–55. doi: 10.1021/bi901148k. [DOI] [PubMed] [Google Scholar]
- 20.Pedersen M, et al. Detection of charge movements in ion pumps by a family of styryl dyes. J Membr Biol. 2002;185:221–36. doi: 10.1007/s00232-001-0125-y. [DOI] [PubMed] [Google Scholar]
- 21.Clarke RJ, Zouni A, Holzwarth JF. Voltage sensitivity of the fluorescent probe RH421 in a model membrane system. Biophys J. 1995;68:1406–15. doi: 10.1016/S0006-3495(95)80313-9. [DOI] [PMC free article] [PubMed] [Google Scholar]
- 22.Weyand S, et al. Structure and molecular mechanism of a nucleobase-cation-symport-1 family transporter. Science. 2008;322:709–13. doi: 10.1126/science.1164440. [DOI] [PMC free article] [PubMed] [Google Scholar]
- 23.Zerangue N, Kavanaugh MP. Flux coupling in a neuronal glutamate transporter. Nature. 1996;383:634–7. doi: 10.1038/383634a0. [DOI] [PubMed] [Google Scholar]
- 24.Levy LM, Warr O, Attwell D. Stoichiometry of the glial glutamate transporter GLT-1 expressed inducibly in a Chinese hamster ovary cell line selected for low endogenous Na+-dependent glutamate uptake. J Neurosci. 1998;18:9620–8. doi: 10.1523/JNEUROSCI.18-23-09620.1998. [DOI] [PMC free article] [PubMed] [Google Scholar]
- 25.Owe SG, Marcaggi P, Attwell D. The ionic stoichiometry of the GLAST glutamate transporter in salamander retinal glia. J Physiol. 2006;577:591–9. doi: 10.1113/jphysiol.2006.116830. [DOI] [PMC free article] [PubMed] [Google Scholar]
- 26.Zhang Z, et al. Transport direction determines the kinetics of substrate transport by the glutamate transporter EAAC1. Proc Natl Acad Sci U S A. 2007;104:18025–30. doi: 10.1073/pnas.0704570104. [DOI] [PMC free article] [PubMed] [Google Scholar]
- 27.Mavencamp TL, Rhoderick JF, Bridges RJ, Esslinger CS. Synthesis and preliminary pharmacological evaluation of novel derivatives of L-beta-threo-benzylaspartate as inhibitors of the neuronal glutamate transporter EAAT3. Bioorg Med Chem. 2008;16:7740–8. doi: 10.1016/j.bmc.2008.07.001. [DOI] [PMC free article] [PubMed] [Google Scholar]
- 28.Shimamoto K, et al. DL-threo-beta-benzyloxyaspartate, a potent blocker of excitatory amino acid transporters. Mol Pharmacol. 1998;53:195–201. doi: 10.1124/mol.53.2.195. [DOI] [PubMed] [Google Scholar]
- 29.Shimamoto K, et al. Syntheses of optically pure beta-hydroxyaspartate derivatives as glutamate transporter blockers. Bioorg Med Chem Lett. 2000;10:2407–10. doi: 10.1016/s0960-894x(00)00487-x. [DOI] [PubMed] [Google Scholar]
- 30.Gomez J, Hilser VJ, Xie D, Freire E. The heat capacity of proteins. Proteins. 1995;22:404–12. doi: 10.1002/prot.340220410. [DOI] [PubMed] [Google Scholar]
- 31.Robertson AD, Murphy KP. Protein Structure and the Energetics of Protein Stability. Chem Rev. 1997;97:1251–1268. doi: 10.1021/cr960383c. [DOI] [PubMed] [Google Scholar]
- 32.Loladze VV, Ermolenko DN, Makhatadze GI. Heat capacity changes upon burial of polar and nonpolar groups in proteins. Protein Sci. 2001;10:1343–52. doi: 10.1110/ps.370101. [DOI] [PMC free article] [PubMed] [Google Scholar]
- 33.Prabhu NV, Sharp KA. Heat capacity in proteins. Annu Rev Phys Chem. 2005;56:521–48. doi: 10.1146/annurev.physchem.56.092503.141202. [DOI] [PubMed] [Google Scholar]
- 34.DeChancie J, Shrivastava IH, Bahar I. The mechanism of substrate release by the aspartate transporter GltPh: insights from simulations. Mol Biosyst. 2011;7:832–42. doi: 10.1039/c0mb00175a. [DOI] [PMC free article] [PubMed] [Google Scholar]
- 35.Bergqvist S, Williams MA, O'Brien R, Ladbury JE. Heat capacity effects of water molecules and ions at a protein-DNA interface. J Mol Biol. 2004;336:829–42. doi: 10.1016/j.jmb.2003.12.061. [DOI] [PubMed] [Google Scholar]
- 36.Horn JR, Brandts JF, Murphy KP. van't Hoff and calorimetric enthalpies II: effects of linked equilibria. Biochemistry. 2002;41:7501–7. doi: 10.1021/bi025626b. [DOI] [PubMed] [Google Scholar]
- 37.Pozzi N, Chen R, Chen Z, Bah A, Di Cera E. Rigidification of the autolysis loop enhances Na(+) binding to thrombin. Biophys Chem. 2011;159:6–13. doi: 10.1016/j.bpc.2011.04.003. [DOI] [PMC free article] [PubMed] [Google Scholar]
- 38.Myszka DG, et al. Energetics of the HIV gp120-CD4 binding reaction. Proc Natl Acad Sci U S A. 2000;97:9026–31. doi: 10.1073/pnas.97.16.9026. [DOI] [PMC free article] [PubMed] [Google Scholar]
- 39.Olsson TS, Williams MA, Pitt WR, Ladbury JE. The thermodynamics of protein-ligand interaction and solvation: insights for ligand design. J Mol Biol. 2008;384:1002–17. doi: 10.1016/j.jmb.2008.09.073. [DOI] [PubMed] [Google Scholar]
- 40.Feller G. Protein stability and enzyme activity at extreme biological temperatures. J Phys Condens Matter. 22:323101. doi: 10.1088/0953-8984/22/32/323101. [DOI] [PubMed] [Google Scholar]
- 41.Wolf-Watz M, et al. Linkage between dynamics and catalysis in a thermophilic-mesophilic enzyme pair. Nat Struct Mol Biol. 2004;11:945–9. doi: 10.1038/nsmb821. [DOI] [PubMed] [Google Scholar]
- 42.Watzke N, Bamberg E, Grewer C. Early intermediates in the transport cycle of the neuronal excitatory amino acid carrier EAAC1. J Gen Physiol. 2001;117:547–62. doi: 10.1085/jgp.117.6.547. [DOI] [PMC free article] [PubMed] [Google Scholar]
- 43.Otwinowski Z, Minor W. Processing of X-ray diffraction data collected in oscillation mode. Methods Enzymol. 1997;276:308–326. doi: 10.1016/S0076-6879(97)76066-X. [DOI] [PubMed] [Google Scholar]
- 44.The CCP4 suite: programs for protein crystallography. Acta Crystallogr D Biol Crystallogr. 1994;50:760–3. doi: 10.1107/S0907444994003112. [DOI] [PubMed] [Google Scholar]
- 45.McCoy AJ, et al. Phaser crystallographic software. J. Appl. Cryst. 2007;40:658–674. doi: 10.1107/S0021889807021206. [DOI] [PMC free article] [PubMed] [Google Scholar]
- 46.Winn MD, Isupov MN, Murshudov GN. Use of TLS parameters to model anisotropic displacements in macromolecular refinement. Acta Crystallogr D Biol Crystallogr. 2001;57:122–33. doi: 10.1107/s0907444900014736. [DOI] [PubMed] [Google Scholar]
- 47.Emsley P, Cowtan K. Coot: model-building tools for molecular graphics. Acta Crystallogr D Biol Crystallogr. 2004;D60:2126–2132. doi: 10.1107/S0907444904019158. [DOI] [PubMed] [Google Scholar]
- 48.DeLano WL. The PyMOL Molecular Graphics System. DeLano Scientific LLC; Palo Alto, CA, USA: 2008. [Google Scholar]
Associated Data
This section collects any data citations, data availability statements, or supplementary materials included in this article.