Abstract
Insulin resistance, hyperglycemia, and type 2 diabetes are among the sequelae of metabolic syndromes that occur in 60–80% of human immunodeficiency virus (HIV)-positive patients treated with HIV-protease inhibitors (PIs). Studies to elucidate the molecular mechanism(s) contributing to these changes, however, have mainly focused on acute, in vitro actions of PIs. Here, we examined the chronic (7 wk) in vivo effects of the PI indinavir (IDV) in male Zucker diabetic fatty (fa/fa) (ZDF) rats. IDV exposure accelerated the diabetic state and dramatically exacerbated hyperglycemia and oral glucose intolerance in the ZDF rats, compared with vehicle-treated ZDF rats. Oligonucleotide gene array analyses revealed upregulation of suppressor of cytokine signaling-1 (SOCS-1) expression in insulin-sensitive tissues of IDV rats. SOCS-1 is a known inducer of insulin resistance and diabetes, and immunoblotting analyses revealed increases in SOCS-1 protein expression in adipose, skeletal muscle, and liver tissues of IDV-administered ZDF rats. This was associated with increases in the upstream regulator TNF-α and downstream effector sterol regulatory element-binding protein-1 and a decrease in IRS-2. IDV and other PIs currently in clinical use induced the SOCS-1 signaling cascade also in L6 myotubes and 3T3-L1 adipocytes exposed acutely to PIs under normal culturing conditions and in tissues from Zucker wild-type lean control rats administered PIs for 3 wk, suggesting an effect of these drugs even in the absence of background hyperglycemia/hyperlipidemia. Our findings therefore indicate that induction of the SOCS-1 signaling cascade by PIs could be an important contributing factor in the development of metabolic dysregulation associated with long-term exposures to HIV-PIs.
Keywords: metabolic syndrome, insulin-signaling pathways, human immunodeficiency virus
over the past two decades, the number of people living with human immunodeficiency virus (HIV)/acquired immunodeficiency syndrome (AIDS) worldwide has risen to nearly 40 million (4) and continues to rise. The beneficial effects of HIV-protease inhibitors (PIs) in combination with nucleoside and nonnucleoside reverse transcriptase inhibitors (NRTIs/NNRTIs) are evidenced by the dramatic decreases in HIV plasma viremia, marked reductions in opportunistic infections, and mortality and morbidity among HIV-positive patients (8, 43). However, PI-based highly active antiretroviral therapy (HAART) has been associated with insulin resistance, hyperglycemia, overt type 2 diabetes mellitus, peripheral lipoatrophy, visceral adiposity, and hyperlipidemia (10, 49). These complications, analogous to “the Metabolic Syndrome” (38), have been attributed to several factors, including genetic background, age, ethnicity, environmental/behavioral factors, anti-HIV medication exposure, host-inflammatory factors, and other medications (21, 38). However, they are reported to occur in 60–80% of HIV-positive patients treated with PIs and are associated with a significant risk for cardiovascular disease in these patients (18).
Several studies implicate PIs as having a prominent role in precipitating metabolic abnormalities in people living with HIV. Oral glucose tolerance and hyperinsulinemic/euglycemic clamp procedures revealed glucose intolerance and insulin resistance in HIV-positive patients treated with a PI-based HAART (7, 14, 25, 30). These metabolic abnormalities were found to be associated with PI use but less frequently associated with NRTI or NNRTI use (45), demographic, and virologic factors (36). Further, insulin resistance can be induced in HIV-seronegative people acutely exposed to indinavir (IDV) or ritonavir/lopinavir (RTV/LPV; Refs. 28, 42). These and other findings (35, 37, 48) demonstrate a clear link between PI use, insulin resistance, and diabetes.
Although multifactorial (3), one mechanism proposed for PI-induced insulin resistance and diabetes is related to inhibition of GLUT4 activity. Skeletal muscle and adipose tissue are the major sites of insulin-stimulated glucose disposal (11), which is primarily mediated through GLUT4 transporters (3, 11). Exposing skeletal muscle (35), 3T3-L1 adipocytes (33), or primary adipocytes (32) to PIs, including IDV, has been reported to inhibit GLUT4 transport function but not its translocation or any component of the insulin signaling cascade. A limitation of these studies is that they involved acute exposure to PIs under in vitro conditions, as opposed to chronic or in vivo exposure to PIs.
Other proposed mechanism(s) for the development of PI-induced insulin resistance and diabetes include decreased conversion of proinsulin to insulin (6); increases in soluble type 2 TNF-α receptors (34) reflecting activation of the TNF system by TNF-α, a known inducer of insulin resistance (17); reductions in the release of adipocyte-derived adiponectin, which enhances insulin-stimulated suppression of hepatic glucose production and increases in peripheral glucose disposal (39) and altered sterol regulatory element-binding protein-1 (SREBP-1) nuclear localization (9). Further, “lipotoxicity” due to 1) increased subcutaneous fat loss that results in increases in circulating fatty acids, which when taken up by muscle and liver inhibit insulin signaling (20, 22); 2) inhibition of adipogenesis leading to suppression of lipogenesis and stimulation of lipolysis (29); 3) dysregulation of CD36, a facilitator of fatty acid uptake (13), or 4) decreases in adipocyte-derived perilipin, a regulator of lipid metabolism, leading to stimulation of lipolysis (40) is also recognized to act in concert with other metabolic perturbations to promote PI-induced insulin resistance and type 2 diabetes.
Collectively, these studies suggest that the manifestation of insulin resistance and diabetes during PI treatment is associated with dysregulation of cellular factors and pathways in addition to alterations in GLUT4. This is also supported by the finding that selective knockout of GLUT4 in adipocytes can cause insulin resistance in muscle and liver (1) and that short-term PI exposure reduces GLUT4 transporter recruitment but longer exposures inhibit preadipocyte differentiation (5).
In an effort to elucidate potential mechanism(s) by which chronic exposure to PIs induces insulin resistance in vivo, we examined the effects of 7-wk IDV administration to Zucker diabetic fatty (fa/fa) (ZDF) rats. Our studies reveal for the first time that IDV exacerbates diabetes and insulin resistance in these rats and that this is accompanied by induction of the suppressor of cytokine signaling-1 (SOCS-1) signaling cascade in insulin-sensitive tissues. The SOCS family contains eight members (2), of which SOCS-1 and -3 are strong promoters of insulin resistance (44). Of particular relevance is that the metabolic profile resulting from dysregulation of SOCS-1 is similar to the phenotype of HIV-positive patients on PI therapy.
RESEARCH DESIGN AND METHODS
Materials
IDV and other PIs were supplied by the pharmacy at the AIDS Clinical Trials Unit at Washington University School of Medicine (St. Louis, MO) or the AIDS Research and Reference Reagent Program, Division of AIDS, National Institute of Allergy and Infectious Diseases (NIAID), and National Institutes of Health (NIH; http://www.aidsreagent.org/). Zucker wild-type lean (ZWT) and ZDF rats were purchased from Charles River Laboratories (Wilmington, MA). Other materials were obtained from the following: rat genome 230 2.0 chips (Affymetrix, Santa Clara, CA); SDS gel supplies (Bio-Rad Laboratories, Hercules, CA); rat insulin ELISA kit (Crystal Chem, Downers Grove, IL); chemiluminescent horseradish peroxidase substrate and immoblolin-P polyvinylidene difluoride membranes (Millipore, Bedford, MA); RNeasy mini kit, RNeasy fibrous tissue mini kit, and RNeasy lipid tissue mini kit (Qiagen, Valencia, CA); primary and secondary antibodies (Santa Cruz Biotechnology, Santa Cruz, CA); triglyceride kit (Pointe Scientific, Lincoln Park, MI); and common reagents (Sigma, St. Louis, MO). 3T3-L1 and L6 cells were purchased from ATCC (Manassas, VA).
Animals
Five-week-old ZWT lean (n = 15) and ZDF (n = 24) rats were housed in standard cages in a 12:12-h light-dark cycle. Rats were weighed daily and fed commercial chow (25% protein, 9.0% fat, and 66% carbohydrate; Ralston-Purina, St. Louis, MO) with free access to water. Food consumption was measured 2–4 days/wk, and rats were pair-fed to equalize food consumption among all groups. ZWT lean rats (n = 5 in each group) were randomly separated into three groups: group 1 was killed at 5 wk; group 2 was administered placebo for 7 wk from 5 to 12 wk of age and killed at 12 wk; and group 3 was administered a combination of ritonavir and lopinavir (RTV = 42.5 mg•kg•−1•day−1; LPV = 127.5 mg•kg•−1•day−1, bid, po) for 3 wk from 9 to 12 wk and killed at 12 wk. RTV/LPV was suspended in vehicle (sterile water) and administered by oral gavage to mimic the route of administration in humans. All animal procedures were approved by the Animal Studies Committee at Washington University School of Medicine (St. Louis, MO).
Placebo and PI Administration to ZWT and ZDF Rats
Five-week-old ZDF rats (n = 8 in each group) were randomly separated into three groups: group 1 was killed at 5 wk (5F), group 2 received vehicle for 7 wk from 5 to 12 wk of age and killed at 12 wk (12F); and group 3 received IDV (170 mg/kg, bid, po) for 7 wk from 5 to 12 wk and killed at 12 wk (12F + IDV). Sixteen 5-wk-old ZWT rats were randomly assigned to two control groups: group 1 (n = 8) was killed at 5 wk (5L) and group 2 (n = 8) was killed at 12 wk (12L). IDV powder was suspended in vehicle (sterile water) and administered by oral gavage to mimic the route of administration in humans. PI dose and route of administration were based on rodent studies (12, 19) and the high metabolic rate of rodents.
Whole Body Composition
Body weight (BW), percent fat mass, and percent lean mass were determined at 5 and 12 wk of age for the ZDF rats using dual energy X-ray absorptiometry analyses (Hologic 2000, rat body composition software v.1.3, Bedford, MA).
Fasting and Oral Glucose Tolerance Test and Blood Chemistries
At weekly intervals starting at 5 wk of age, plasma glucose, insulin (ZDF and ZWT lean), and triglyceride concentrations were determined in blood samples obtained from the tail vein of 16-h overnight-fasted ZDF rats. To examine the response to an oral glucose challenge, oral glucose tolerance tests (OGTTs) were performed at baseline (day 0) and after 4 and 7 wk of IDV or vehicle administration for the ZDF rats and after 3 wk of RTV/LPV administration for the ZWT lean rats. After obtaining a fasting blood sample, glucose (2 g/kg BW) was administered by oral gavage and tail vein blood samples (~20 μl) were collected at 30, 60, 90, and 120 min. Plasma glucose concentration was determined using an automated glucose analyzer (Yellow Springs Instruments, Yellow Springs, Ohio). Plasma insulin and triglyceride concentrations were determined using kits, according to manufacturer’s instructions.
Affymetrix Gene Array Analysis in Insulin-Sensitive Tissues
To gain insight into potential targets of IDV, total RNA was prepared from skeletal muscle, subcutaneous adipose tissue, and liver tissue isolated from 12F and 12F + IDV ZDF rats using RNeasy mini kits (Qiagen, Valencia, CA). The RNA was then subjected to gene array analysis using Affymetrix rat genome 230 2.0 chips. Affymetrix GeneChips were processed according to manufacturer’s standard protocol. The data were analyzed using the standard MAS5 algorithm by Affymetrix (http://www.affymetrix.com/support/technical/technotes/statistical_reference_guide.pdf) followed by ANOVA analysis. Routine array quality checks (such as scale factor, 3′/5′ ratio, and noise level) were performed and all arrays were in the normal range.
Culture of L6 Myoblasts and 3T3-L1 Adipocytes
L6 rat myotubes and 3T3-L1 fibroblasts were grown in a growth medium (GM1) consisting of DMEM supplemented with 10% (v/v) FBS in a humidified atmosphere of 95% O2-5% CO2 for L6 myotubes and 90% O2-10% CO2 for 3T3-L1 adipocytes at 37°C.
L6 myobalst differentiation
For differentiation into myotubes, and subsequent experiments, the GM1 was supplemented with 2% FBS (DM1) for 7 days. Both 10% GM1 and 2% DM were supplemented with 4 mM glutamine, 1.5 g/l sodium bicarbonate, 1.5 g/l glucose, 100 U/ml penicillin, and 100 μg/ml streptomycin. Growth medium was changed every 72 h until confluence was achieved at which time it was removed and replaced with DM1, which was changed every 48 h. Once myotubes were formed (~6 days), cells were treated with the following PIs alone: RTV, LPV, and atazanavir (ATV) each at 1, 10, and 20 μM; or in combination: 5 μM RTV + 1, 10, or 20 μM LPV or 5 μM RTV + 1, 10, or 20 μM ATV for 48 h in DM1, with DM1 changed every 12 h. Cells were washed twice in ice-cold PBS and harvested in cell lysis buffer for protein assay and immunoblotting (in mM: 50 HEPES, pH 7.5, 15 NaCl, 1 MgCl2, 1 CaCl2, and 2 EDTA; added fresh: 10% glycerol and 1% Triton X-100; and 5 μl/ml protease inhibitor cocktail and 3 mg/ml benzamadine hydrochloride).
3T3-L1 adipocyte differentiation
As described previously (46), fibroblasts were cultured for 2 days in a differentiation medium consisting of DMEM supplemented with 10% FBS (DM2). The cells were then cultured and maintained in a second growth medium consisting of DMEM supplemented with 10% FBS and 175 nmol/l insulin (GM2). Media (DM2) used for adipocyte differentiation were supplemented with 4 mmol/l glutamine, 1.5 g/l sodium bicarbonate, 1.5 g/l glucose, 100 U/ml penicillin, and 100 μg/ml streptomycin. Fully differentiated adipocytes were maintained in DM2 for 48 h. Twenty-four hours before PI treatment, insulin was removed from the media. Cells were then treated for 48 h with 1, 10, or 20 μM of IDV. Cells were washed twice with ice-cold PBS and harvested in cell lysis buffer (described above) for protein assay and immunoblotting.
Western Blot Analysis
Skeletal muscle, subcutaneous adipose tissue, and liver tissues were isolated from ZWT and ZDF rats and prepared for immunoblot analyses in homogenation buffer (in mM: 50 HEPES, EDTA, 10 NaF, 150 NaPO4, 1 DTT, 10 μl/ml protease inhibitor, 10 μl/ml phosphatase inhibitor I, and 10 μl/ml phosphatase inhibitor II; pH 7.4). The homogenates were separated by SDS-PAGE (15% gels), and resolved proteins were transferred onto electroblots. The blots were then prepared for probing with primary antibodies directed against rat SOCS-1 (1:200), TNF-α (1:200) SREBP-1 (1:200), IRS-2 (1:400), and GAPDH (1:500). After subsequent exposure to secondary antibodies (1:5,000), immunoreactive protein bands were visualized via chemiluminescent horseradish peroxidase substrate (Millipore, Bedford, MA). To verify that protein content was similar in each lane, GAPDH was used as loading control.
Statistical Analysis
Data are expressed as mean ± SE. Statistical analyses were performed using Statistical Package for the Social Sciences (SPSS, v.14.0, Chicago, IL). A two-way repeated measures ANOVA was used to identify interactions or main effects for the dependent variables. The level of significance was set at P ≤ 0.05.
RESULTS
Effects of IDV on Whole Body Composition and Food Consumption in ZWT and ZDF Rats
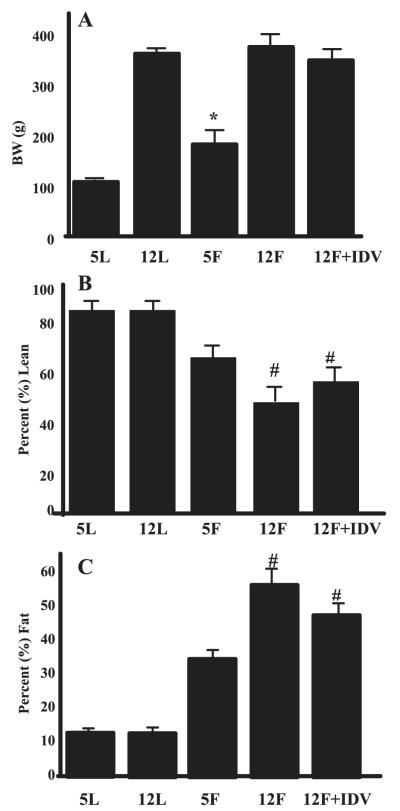
BW, percent lean mass, and percent fat mass were assessed by dual-energy X-ray absorptiometry in the ZWT rats at 5 wk (5L) and 12 wk (12L) of age and in the ZDF rats at 5 wk (5F), 12 wk + placebo (12F), and 12 wk + IDV (12F + IDV). BW in the 5F group was greater than in the 5L group (Fig. 1A). At 12 wk of age, BWs in the 12L, 12F, and 12F + IDV groups were similar. The percent lean mass (Fig. 1B) was significantly lower, and percent fat mass (Fig. 1C) was significantly higher in the 12F and 12F + IDV groups relative to the ZWT animals, reflecting the expected increase in adiposity in the ZDF rats. At 12 wk, percent lean and percent fat mass were not different between placebo and IDV-administered ZDF rats.
Fig. 1.
Whole body composition in Zucker wild-type lean (ZWT) and Zucker diabetic fatty (fa/fa) (ZDF) rats. Body weight (A), %lean (B), and %fat (C) mass were assessed by dual-energy X-ray absorptiometry scanning in ZWT rats at 5 (5L) and 12 (12L) wk of age, in ZDF rats at 5 wk (5F) of age, and in ZDF rats at 12 wk of age after administration of either placebo (12F) or indinavir (IDV; 12F + IDV) for 7 wk. Results are mean ± SE (n = 8 in each group). *P ≤ 0.05, 5F group significantly different from 5L group. #P ≤ 0.05, 12F and 12F + IDV groups significantly different from other groups.
BWs in the ZWT + RTV/LPV rats were not significantly different at 5 wk (149.6 ± 5.6 and 148.9 ± 5.3 g) or 12 wk (250.0 ± 6.0 and 252.3 ± 3.5 g) of age. There were also no significant differences in food consumption between ZWT ± RTV/LPV groups at 5 wk (41.5 ± 4.5 and 36.1 ± 4.3 g/day) or 12 wk (37.3 ± 4.1 and 38.2 ± 2.9 g/day) of age. There was also no difference in food consumption between the ZDF and ZDF ± IDV groups, respectively, at 5 and 12 wk (28.2 ± 3.1 and 26.1 ± 4.2; 41.5 ± 2.1 and 45.6 ± 3.1 g) of age.
Effects of IDV on Plasma Glucose and Triglyceride Levels in ZDF Rats
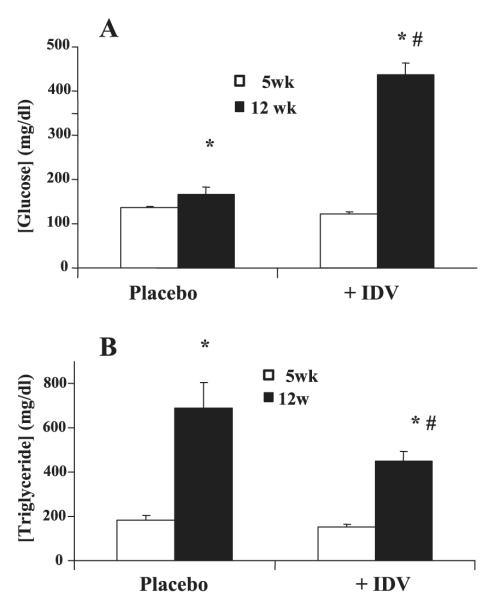
Fasting glucose levels increased in both the placebo and IDV groups between 5 and 12 wk of age; however, the increase was significantly greater in the IDV group (Fig. 2A). Fasting serum triglyceride levels also increased between 5 and 12 wk of age (Fig. 2B) but to a lesser extent in the IDV group. For comparison, nonfasted plasma glucose and triglyceride levels were unchanged in the ZWT rats (BG: 158 ± 8 and 161 ± 5 mg/dl; TG: 131 ± 6 and 135 ± 4 mg/dl, at 5 and 12 wk of age, respectively). Fasting plasma glucose levels in ZWT lean rats exposed to placebo or RTV/LPV did not change in either group from baseline to 3 wk of PI exposure (83.1 ± 2.5 and 75.2 ± 3.7 and 74.6 ± 5.2 and 75.3 ± 2.5 mg/dl, placebo and RTV/LPV, respectively).
Fig. 2.
Effects of IDV on plasma glucose and triglyceride levels in ZDF rats. Blood was collected from ZDF rats before administration of placebo or IDV and at the end of the study period for glucose (A) and triglycerides (B) measurements. Results are mean ± SE (n = 8 in each group). *P ≤ 0.05, 12-wk groups significantly different from 5-wk groups. #P ≤ 0.01 (A) and P ≤ 0.05 (B), 12-wk placebo group significantly different from 12-wk IDV groups.
IDV Exacerbates Hyperglycemia in ZDF Rats
To determine the temporal effects of IDV on plasma glucose and insulin levels, blood was collected from overnight-fasted placebo- and IDV-administered rats at weekly intervals during the 7-wk study period. Fasting glucose levels in the placebo and IDV groups were similar during the initial 4 wk of exposure (Fig. 3A). However, during the final 3 wk, fasting glucose levels were significantly higher in the IDV group than in the placebo group. Fasting insulin levels in the placebo and IDV groups were unchanged and similar during the initial 2 wk of exposure and increased in parallel during the next wk. During the final 5 wk, insulin levels in the IDV group declined and were significantly lower than the persistently elevated levels observed in the placebo group (Fig. 3B). PIs, including IDV, have been reported to impair glucose-stimulated insulin secretion (27, 35). Nevertheless, insulin levels in the IDV group were higher than in age-matched ZWT rats (data not shown).
Fig. 3.
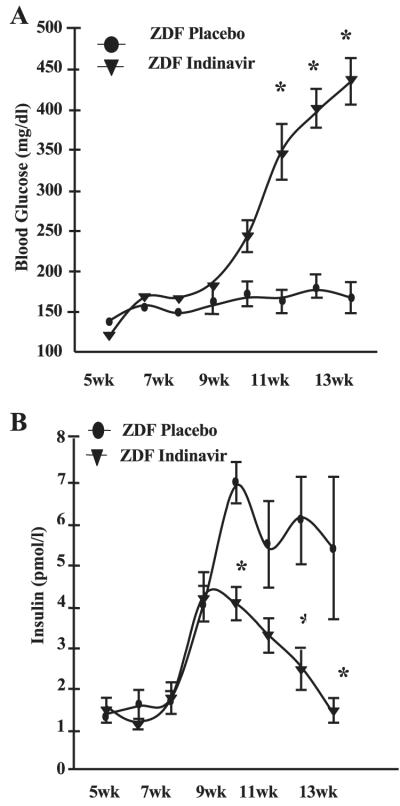
IDV exacerbates hyperglycemia in ZDF rats. Blood was collected at weekly intervals from ZDF rats before and during administration of placebo and for glucose (A) and insulin (B) measurements. Results are mean ± SE (n = 8 in each group). *P ≤ 0.05, IDV groups significantly different from placebo group.
Chronic IDV Administration Impairs Glucose Tolerance in ZDF Rats
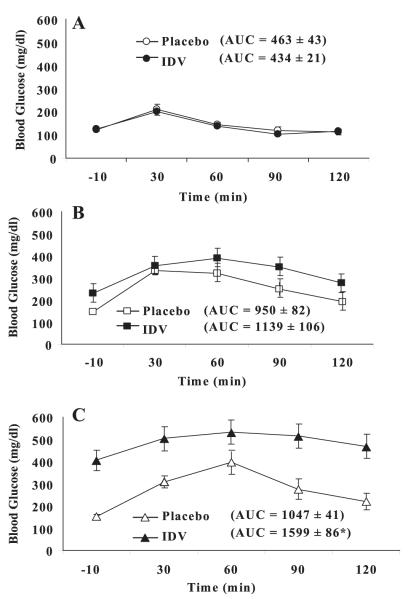
To determine if glucose tolerance was affected by IDV, OGTTs were performed in ZDF rats at baseline and after 4 and 7 wk of placebo or IDV administration. At baseline, oral glucose tolerance [glucose area under the curve (AUC)] was similar in IDV and placebo groups (Fig. 4A). At 4 wk, oral glucose tolerance worsened in both groups compared with baseline, but glucose AUC was not different between placebo and IDV groups (Fig. 4B). By 7 wk, oral glucose tolerance worsened further in both groups (Fig. 4C), but glucose AUC was significantly greater in the IDV group than placebo group (P < 0.0005).
Fig. 4.
IDV impairs glucose tolerance in ZDF rats. Oral glucose tolerance tests were performed in overnight-fasted ZDF rats before and after 4 and 7 wk administration of placebo or IDV; day 0 (A), 4 wk (B), and 7 wk (C). Results are mean ± SE (n = 4 in each group). *P ≤ 0.05, IDV groups significantly different from placebo group.
IDV Induces SOCS-1 Gene Expression
To identify potential cellular targets of PIs that might explain perturbed glucose tolerance in the IDV group, total RNA was prepared from adipose tissue isolated from 12F and 12F + IDV treated rats and used in gene array analyses using Affymetrix rat genome 230 2.0 chips. As we were interested in the effects of the PI, lean counterparts were not included in these initial analyses. These analyses revealed a three- to fourfold increase in SOCS-1 gene expression in adipose tissue from IDV-exposed rats, relative to the placebo group. SOCS-3 gene expression was not different between IDV and placebo groups, despite reports (15) that SOCS-3 can also disrupt insulin signaling. It is well known that TNF-α can induce SOCS-1 (44) and that SOCS-1 can induce expression of the nuclear transcription factor SREBP-1 (43). To examine if the higher SOCS-1 gene expression in the IDV group was associated with higher SOCS-1 or TNF-α or SREBP-1 protein expression, we performed immunoblotting analyses in skeletal muscle, adipose, and liver tissue homogenates from ZDF rats.
IDV Induces SOCS-1, TNF-α, and SREBP-1 Protein Levels in Adipose Tissue and Skeletal Muscle of ZDF Rats
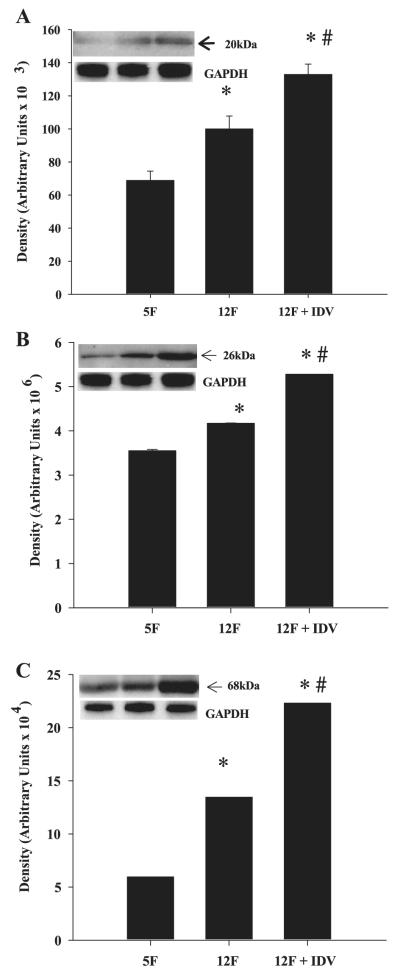
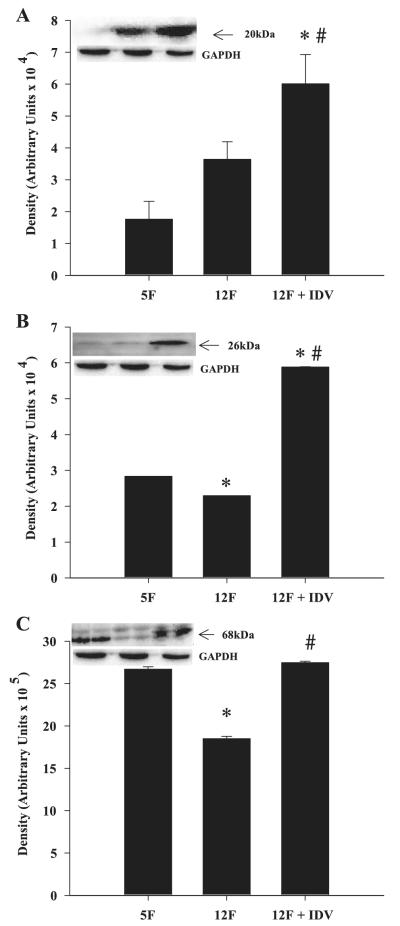
Adipose tissue SOCS-1 (Fig. 5A), TNF-α (Fig. 5B), and SREBP-1 (Fig. 5C) protein levels increased between 5 and 12 wk of age, and IDV exposure further increased the expression levels for these three proteins. In the skeletal muscle, SOCS-1(Fig. 6A) protein expression was not altered between 5 and 12 wk, but TNF-α (Fig. 6B) and SREBP-1 (Fig. 6C) protein expression decreased between 5 and 12 wk of age. IDV administration resulted in significantly greater SOCS-1, TNF-α, and SREBP-1 protein expression levels, compared with the placebo group. In both skeletal muscle and adipose tissue, the TNF-α-immunoreactive band migrated with an apparent molecular mass of 26 kDa, which corresponds to the transmembrane form of TNF-α. The ZWT 5L and 12L groups had similar SOCS-1, TNF-α, and SREBP-1 protein expression levels in adipose tissue and skeletal muscle (data not shown).
Fig. 5.
Suppressor of cytokine signaling-1 (SOCS-1), TNF-α, and sterol regulatory element-binding protein-1 (SREBP-1) expression in adipose tissue of placebo- and IDV-administered ZDF fa/fa rats. Adipose tissue homogenates were prepared from ZDF rats after placebo or IDV administration for 7 wk and processed for immunoblotting analyses of SOCS-1 (A), TNF-α (B), and SREBP-1 (C). A–C: quantified data; each bar is mean ± SE (n = 4 in each group) of the respective protein. Insets: representative immunoblots for each protein and corresponding GAPDH control. *P ≤ 0.05, significantly different from 5F group. #P ≤ 0.05, significantly different from 12F group.
Fig. 6.
SOCS-1, TNF-α, and SREBP-1 expression in skeletal muscle of placebo- and IDV-administered ZDF fa/fa rats. Skeletal muscle homogenates were prepared from ZDF rats after placebo or IDV administration for 7 wk and processed for immunoblotting analyses of SOCS-1 (A), TNF-α (B), and SREBP-1 (C). A–C: quantified data; each bar is mean ± SE (n = 4 in each group) of the respective protein. Insets: representative immunoblots for each protein and corresponding GAPDH control. *P ≤ 0.05, significantly different from 5F group. #P ≤ 0.05, significantly different from 12F group.
IDV Increases SOCS-1 and SREBP-1 Protein in Liver of ZDF Rats
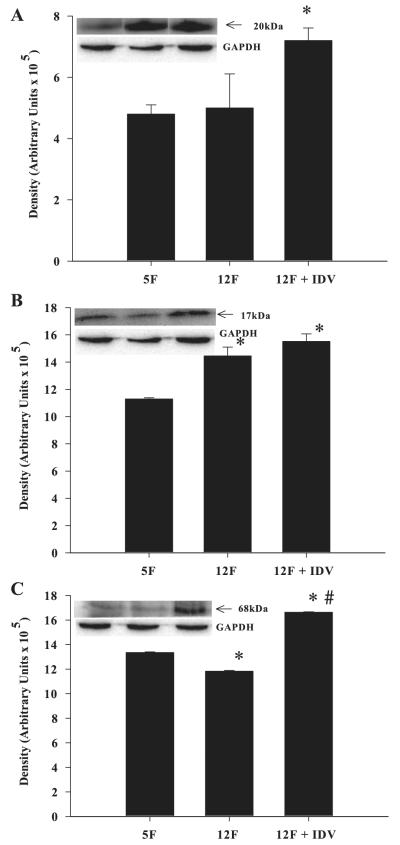
In the liver there was no change in SOCS-1 (Fig. 7A), an increase in TNF-α (Fig. 7B), and a decrease in SREBP-1 (Fig. 7C) between 5 and 12 wk of age. The IDV group had significantly higher SOCS-1 and SREBP-1 expression than the placebo group, but IDV exposure did not further increase liver TNF-α expression. Curiously, the TNF-α-immunoreactive band migrated with an apparent molecular mass of 17kDa, which corresponds to the soluble form of TNF-α. The ZWT 5L and 12L groups had similar SOCS-1, TNF-α, and SREBP-1 protein expression levels in the liver (data not shown).
Fig. 7.
SOCS-1, TNF-α, and SREBP-1 expression in liver tissue of placebo- and IDV-administered ZDF rats. Liver tissue homogenates were prepared from ZDF rats after placebo or IDV administration for 7 wk and processed for immunoblotting analyses of SOCS-1 (A), TNF-α (B), and SREBP-1 (C). A–C: quantified data; each bar is mean ± SE (n = 4 in each group) of the respective protein. Insets: representative immunoblots for each protein and corresponding GAPDH control. *P ≤ 0.05, significantly different from 5F group. #P ≤ 0.05, significantly different from 12F group.
IDV Decreases IRS-2 in Adipose Tissue and Skeletal Muscle of ZDF Rats
A potential mechanism by which SOCS-1 is thought to induce insulin resistance is by promoting degradation of IRS-1. Consistent with this possibility, a twofold decrease in IRS-2 was evident in adipose tissue and skeletal muscle from IDV-administered ZDF rats, relative to ZDF rats at 5 wk of age and vehicle-administered ZDF rats at 12 wk of age (Fig. 8).
Fig. 8.

IRS-2 expression in adipose tissue and skeletal muscle of placebo- and IDV-adminstered ZDF rats. Adipose tissue and skeletal muscle homogenates were prepared from ZDF rats after placebo or IDV administration for 7 wk and processed for immunoblotting analyses of IRS-2. Shown are 5F (n = 5), 12F (n = 5), and 12F + I (n = 5) placebo- and IDV-administered ZDF rats. Corresponding GAPDH control bands in each tissue are shown below.
Protease Inhibitors Induce SOCS-1 Signaling Cascade in 3T3-L1 Adipocytes and L6 Myotubes
To examine whether PIs induce SOCS-1 in the absence of background hyperglycemia/hyperlipidemia (i.e., ZDF rats), 3T3-L1 adipocytes and L6 myotubes were cultured under basal conditions and exposed to IDV and other HIV-PIs, currently in clinical use. 3T3-L1 adipocytes exposed to IDV had greater SOCS-1 protein expression levels than control 3T3-L1 adipocytes (Fig. 9A). Likewise, L6 myotubes exposed to other PIs (RTV, LPV, and ATV) alone or in clinically relevant combinations (RTV/ATV and RTV/LPV) had greater SOCS-1 protein expression levels than control myotubes (Fig. 9B). Also, TNF-α and SREBP-1 protein expression levels were increased in L6 myotubes exposed to physiologic doses of PIs (Fig. 9C). To examine the effects of the vehicle (DMSO) used to dissolve the PIs, control cells treated with varying DMSO concentrations were processed for immunoblotting analyses. As previously demonstrated (18), no differences between SOCS-1 expression in cells treated without or with DMSO (up to 0.4%) were evident (data not produced).
Fig. 9.
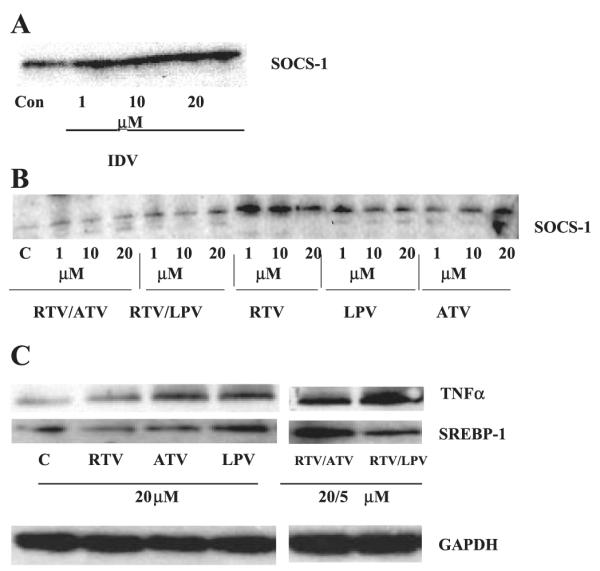
SOCS-1, TNF-α, and SREBP-1 expression in L6 myotubes and 3T3-L1 adipocytes exposed to HIV-protease inhibitors. A: 3T3-L1 adipocytes were exposed to IDV for 1, 15, and 24 h at 37°C and 10% CO2-90% O2. B: L6 myotubes were exposed to 1, 10, and 20 μmol/l RTV/ATV, RTV/LPV, RTV, LPV, and ATV at 37°C, 5% CO2-95% O2 for 3 h. C: L6 myotubes were exposed to protease inhibitors alone (RTV, ATV, and LPV; 20 μM) or incombination (RTV/ATV, RTV/LPV; 20 μM ATV and LPV; 5 μM RTV). IDV, indinavir; RTV, ritonavir; LPV, lopinavir; ATV, atazanavir. Each lane represents the combination of 3 wells from a 12-well culture plate. Corresponding GAPDH control bands are shown below.
RTV/LPV Increases SOCS-1 Protein in Adipose Tissue and Skeletal Muscle of ZWT Lean Rats
To examine if PIs induce SOCS-1 protein in vivo in the absence of hyperglycemia/hyperlipidemia, ZWT rats were treated with RTV/LPV (see research design and methods for dosage) for 3 wk. Relative to vehicle-administered rats, adipose tissue from ZWT rats exposed to RTV/LPV demonstrated a threefold increase in SOCS-1 with no change in TNF-α or SREBP-1 (Fig. 10A), whereas skeletal muscle demonstrated a 2-fold increase in SOCS-1 and TNF-α with no change in SREBP-1 (Fig. 10B). However, SOCS-1, TNF-α, or SREBP-1 was not changed in liver of RTV/LPV-administered ZWT rats (Fig. 10C).
Fig. 10.
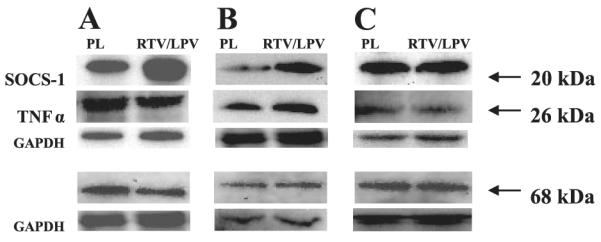
SOCS-1, TNF-α, and SREBP-1 expression in adipose tissue, skeletal muscle, and liver tissue of placebo and RTV/LPV-administered control ZWT lean rats. Adipose tissue (A), skeletal muscle (B), and liver (C) homogenates were prepared from ZWT lean rats after placebo or RTV/LPV administration and processed for immunoblotting analyses. A–C: ZWT lean rats administered placebo (n = 3) and RTV/LPV (n = 5). Corresponding GAPDH control bands in each tissue are shown below.
DISCUSSION
Efforts to elucidate the mechanism(s) by which PIs induce insulin resistance and diabetes have focused mainly on the acute effects of PIs under in vitro conditions (18, 27, 32), leaving a large gap in understanding the evolution of in vivo complications due to long-term exposure to PIs. To address this issue, we examined the effects of a 7-wk IDV administration period in male ZDF rats. The ZDF rat is a genetic model of type 2 diabetes in which males homozygous for nonfunctional leptin receptors (fa/fa) develop obesity, hyperlipidemia, and hyperglycemia.
Our findings indicate that ZDF rats exposed to IDV exhibit accelerated diabetes, exacerbation of hyperglycemia, and further deterioration of oral glucose tolerance when compared with age-matched and pair-fed counterparts that received vehicle only. Initial oligonucleotide gene array analyses of insulin-sensitive tissues revealed a significant upregulation of SOCS-1, a potent inducer of metabolic dysregulation (31). However, expression of SOCS-3, which can also cause metabolic disturbances, was unaffected by IDV exposure. In support of the gene array findings, SOCS-1 protein expression was upregulated in adipose, skeletal muscle, and liver tissues of IDV-administered rats, relative to age-matched, pair-fed placebo-administered animals. Further tissue analyses revealed that the induction of SOCS-1 by IDV was accompanied by upregulation of TNF-α and SREBP-1. The cytokine TNF-α is a known regulator of SOCS proteins (16), and the nuclear transcription factor SREBP-1 has been reported to be induced by SOCS-1 (9). As these changes occurred in the presence of a diabetic/hyperlipidemia background (i.e., in ZDF rats), we examined whether IDV and other PIs that are currently in clinical use induce SOCS-1 in L6 myotubes and 3T3-L1 adipocytes under control culturing conditions as well as in control ZWT lean rats. Exposure of the cells to IDV, RTV, LPV, and ATV alone or in combination (RTV/ATV and RTV/LPV) resulted in induction of SOCS-1, TNF-α, and SREBP-1. Furthermore, administration of RTV/LPV to control ZWT lean rats that, unlike their ZDF counterparts, are not genetically predisposed to developing hyperlipidemia or diabetes, induced SOCS-1 in adipose tissue and skeletal muscle and TNF-α in skeletal muscle. SOCS-1, TNF-α, and SREBP-1 protein expression did not change in liver tissue of ZWT + RTV/LPV rats, suggesting that a longer PI regimen may be necessary to induce changes in these liver proteins. These findings suggest that physiological concentrations of HIV-PIs induce upregulation of select proteins involved in the SOCS-1 signaling cascade, that this induction is independent of preexisting diabetic/hyperlipidemia states, and that it is promoted by several HIV-PIs that are currently part of the regimens used to treat HIV-positive patients.
It has been shown that SOCS-1, through binding to the kinase domain of insulin receptor that recognizes IRS2, preferentially inhibits IRS2. Our findings are consistent with this because IRS-2 protein expression was reduced in adipose tissue and skeletal muscle of ZDF rats treated with IDV. Indeed, adenoviral overexpression of SOCS-1 in L6 myotubes and 3T3-L1 adipocytes decreases phosphorylation of IRS proteins (44). Further evidence that SOCS-1 impacts insulin sensitivity is provided by the findings that adenoviral overexpression of SOCS-1 protein in the liver of C57BL/6 mice reduces phosphatidylinositol 3-kinase expression and IRS-2 expression and phosphorylation after insulin stimulation (44) and impairs glucose tolerance (41). In addition to its effects on IRS-2 phosphorylation, SOCS-1 is thought to promote ubiquitin-mediated degradation of IRS-1 and IRS2 (41). Induction of these actions by SOCS-1 would be reflected by decreases in insulin signaling, the consequences of which include higher circulating glucose and fatty acid levels. These are critical contributors to the vicious cycle that is characteristic of events leading to the Metabolic Syndrome.
The cytokine TNF-α, secreted by both adipocytes and macrophages, is a potent inducer of insulin resistance (24) and can induce SOCS-1 (16). In the present study, only the transmembrane TNF-α (mTNF-α; 26 kDa) form was present in ZDF rat adipose tissue and skeletal muscle, and its expression was upregulated in these tissues by IDV. However, the liver expressed only the soluble TNF-α (sTNF-α; 17kDa) protein and this was unaffected by IDV. Differential expression of TNF-α between tissues has been reported to occur in association with obesity and diabetes (23). Other studies have shown that TNF-α increases with obesity and diabetes in skeletal muscle and adipose tissue but not in the liver (26). However, in these studies no distinction between sTNF-α and mTNF-α was made. The increase in mTNF-α in skeletal muscle and adipose tissue without an increase in sTNF-α in liver may be due to tissue-specific differences between insulin receptor characteristics (47).
Lipotoxicity due to increased subcutaneous fat loss results in increases in circulating fatty acids (22), which when taken up by skeletal muscle inhibit insulin-signaling (20). Increased fatty acid synthesis can also contribute to elevations in circulating fatty acids, and SOCS-1 is thought to increase fatty acid synthesis by up-regulating SREBP-1 (5), through suppression of STAT3 phosphorylation (43). In support of this, our findings demonstrate that IDV upregulated SREBP-1 protein levels in ZDF rat muscle, adipose tissue, and liver. Induction of fatty acid synthesis enzymes (i.e., fatty acid synthase and acyl-CoA carboxylase) by SREBP-1 (5, 43) may represent a potential mechanism by which a lipotoxic state is manifested by the HIV-PIs.
The underlying mechanism(s) by which PIs induce insulin resistance and diabetes are unclear, but growing evidence suggests that acute and chronic metabolic actions of PIs may involve different pathways. Disruption of SOCS-1 occurs in models of obesity during the development of the Metabolic Syndrome, and this mimics metabolic changes that occur in HIV-positive patients receiving PIs. Our studies indicate that chronic HIV-PI exposure induces SOCS-1 expression in muscle, liver, and adipose tissue. The additional findings of increases in the upstream regulator TNF-α and of downstream target SREBP-1 strongly support a role of SOCS-1 signaling cascade in HIV-PI-induced insulin resistance and hyperglycemia.
ACKNOWLEDGMENTS
We thank S. Smith, J. Chen, and S. Lassa-Claxton for expert technical assistance and M. Royal for providing Kaletra (RTV/LPV). The NIH AIDS Research and Reference Reagent Program, Division of AIDS, NIAID, NIH provided the following protease inhibitors: RTV, reagent #4622; LPV, reagent #9481; and atazanavir, reagent #10003.
GRANTS The work was supported by grants from NIH R01-DK-69455, P30-DK-056431, P60-DK-020579, P41-RR00954, T32-DK-007296–27 (to M. J. Carper); DK-074343 (to W. T. Cade); and DK-074345, DK-049393, DK-059531, Bristol-Myers Squibb (to K. E. Yarasheski), and the Campbell Foundation (to S. Ramanadham).
REFERENCES
- 1.Abel ED, Peroni O, Kim JK, Kim YB, Boss O, Hadro E, Minnemann T, Shulman GI, Kahn BB. Adipose-selective targeting of the GLUT4 gene impairs insulin action in muscle and liver. Nature. 2001;409:729–733. doi: 10.1038/35055575. [DOI] [PubMed] [Google Scholar]
- 2.Alexander WS, Hilton DJ. The role of suppressors of cytokine signaling (SOCS) proteins in regulation of the immune response. Annu Rev Immunol. 2004;22:503–529. doi: 10.1146/annurev.immunol.22.091003.090312. [DOI] [PubMed] [Google Scholar]
- 3.Almind K, Doria A, Kahn CR. Putting the genes for type II diabetes on the map. Nat Med. 2001;7:277–279. doi: 10.1038/85405. [DOI] [PubMed] [Google Scholar]
- 4.Autran B, Carcelain G, Li TS, Blanc C, Mathez D, Tubiana R, Katlama C, Debre P, Leibowitch J. Positive effects of combined anti-retroviral therapy on CD4+ T cell homeostasis and function in advanced HIV disease. Science. 1997;277:112–116. doi: 10.1126/science.277.5322.112. [DOI] [PubMed] [Google Scholar]
- 5.Bastard JP, Maachi M, Lagathu C, Kim MJ, Caron M, Vidal H, Capeau J, Feve B. Recent advances in the relationship between obesity, inflammation, and insulin resistance. Eur Cytokine Netw. 2006;17:4–12. [PubMed] [Google Scholar]
- 6.Behrens G, Dejam A, Schmidt H, Balks HJ, Brabant G, Korner T, Stoll M, Schmidt RE. Impaired glucose tolerance, beta cell function and lipid metabolism in HIV patients under treatment with protease inhibitors. AIDS. 1999;13:F63–70. doi: 10.1097/00002030-199907090-00001. [DOI] [PubMed] [Google Scholar]
- 7.Brambilla AM, Novati R, Calori G, Meneghini E, Vacchini D, Luzi L, Castagna A, Lazzarin A. Stavudine or indinavir-containing regimens are associated with an increased risk of diabetes mellitus in HIV-infected individuals. AIDS. 2003;17:1993–1995. doi: 10.1097/00002030-200309050-00022. [DOI] [PubMed] [Google Scholar]
- 8.Cameron DW, Heath-Chiozzi M, Danner S, Cohen C, Kravcik S, Maurath C, Sun E, Henry D, Rode R, Potthoff A, Leonard J. Randomised placebo-controlled trial of ritonavir in advanced HIV-1 disease. The Advanced HIV Disease Ritonavir Study Group. Lancet. 1998;351:543–549. doi: 10.1016/s0140-6736(97)04161-5. [DOI] [PubMed] [Google Scholar]
- 9.Caron M, Auclair M, Sterlingot H, Kornprobst M, Capeau J. Some HIV protease inhibitors alter lamin A/C maturation and stability, SREBP-1 nuclear localization and adipocyte differentiation. AIDS. 2003;17:2437–2444. doi: 10.1097/00002030-200311210-00005. [DOI] [PubMed] [Google Scholar]
- 10.Carr A, Samaras K, Burton S, Law M, Freund J, Chisholm DJ, Cooper DA. A syndrome of peripheral lipodystrophy, hyperlipidaemia and insulin resistance in patients receiving HIV protease inhibitors. AIDS. 1998;12:F51–F58. doi: 10.1097/00002030-199807000-00003. [DOI] [PubMed] [Google Scholar]
- 11.Czech MP, Corvera S. Signaling mechanisms that regulate glucose transport. J Biol Chem. 1999;274:1865–1868. doi: 10.1074/jbc.274.4.1865. [DOI] [PubMed] [Google Scholar]
- 12.den Boer MA, Berbee JF, Reiss P, van der Valk M, Voshol PJ, Kuipers F, Havekes LM, Rensen PC, Romijn JA. Ritonavir impairs lipoprotein lipase-mediated lipolysis and decreases uptake of fatty acids in adipose tissue. Arterioscler Thromb Vasc Biol. 2006;26:124–129. doi: 10.1161/01.ATV.0000194073.87647.10. [DOI] [PubMed] [Google Scholar]
- 13.Dressman J, Kincer J, Matveev SV, Guo L, Greenberg RN, Guerin T, Meade D, Li XA, Zhu W, Uittenbogaard A, Wilson ME, Smart EJ. HIV protease inhibitors promote atherosclerotic lesion formation independent of dyslipidemia by increasing CD36-dependent cholesteryl ester accumulation in macrophages. J Clin Invest. 2003;111:389–397. doi: 10.1172/JCI16261. [DOI] [PMC free article] [PubMed] [Google Scholar]
- 14.Dube MP, Edmondson-Melancon H, Qian D, Aqeel R, Johnson D, Buchanan TA. Prospective evaluation of the effect of initiating indinavir-based therapy on insulin sensitivity and B-cell function in HIV-infected patients. J Acquir Immune Defic Syndr. 2001;27:130–134. doi: 10.1097/00126334-200106010-00006. [DOI] [PubMed] [Google Scholar]
- 15.Emanuelli B, Peraldi P, Filloux C, Sawka-Verhelle D, Hilton D, Van Obberghen E. SOCS-3 is an insulin-induced negative regulator of insulin signaling. J Biol Chem. 2000;275:15985–15991. doi: 10.1074/jbc.275.21.15985. [DOI] [PubMed] [Google Scholar]
- 16.Fasshauer M, Kralisch S, Klier M, Lossner U, Bluher M, Klein J, Paschke R. Insulin resistance-inducing cytokines differentially regulate SOCS mRNA expression via growth factor- and Jak/Stat-signaling pathways in 3T3–L1 adipocytes. J Endocrinol. 2004;181:129–138. doi: 10.1677/joe.0.1810129. [DOI] [PubMed] [Google Scholar]
- 17.Fernandez-Real JM, Broch M, Ricart W, Casamitjana R, Gutierrez C, Vendrell J, Richart C. Plasma levels of the soluble fraction of tumor necrosis factor receptor 2 and insulin resistance. Diabetes. 1998;47:1757–1762. doi: 10.2337/diabetes.47.11.1757. [DOI] [PubMed] [Google Scholar]
- 18.Germinario RJ. Anti-retroviral protease inhibitors–“a two edged sword?”. IUBMB Life. 2003;55:67–70. doi: 10.1002/tbmb.718540874. [DOI] [PubMed] [Google Scholar]
- 19.Goetzman ES, Tian L, Nagy TR, Gower BA, Schoeb TR, Elgavish A, Acosta EP, Saag MS, Wood PA. HIV protease inhibitor ritonavir induces lipoatrophy in male mice. AIDS Res Hum Retroviruses. 2003;19:1141–1150. doi: 10.1089/088922203771881248. [DOI] [PubMed] [Google Scholar]
- 20.Griffin ME, Marcucci MJ, Cline GW, Bell K, Barucci N, Lee D, Goodyear LJ, Kraegen EW, White MF, Shulman GI. Free fatty acid-induced insulin resistance is associated with activation of protein kinase C theta and alterations in the insulin signaling cascade. Diabetes. 1999;48:1270–1274. doi: 10.2337/diabetes.48.6.1270. [DOI] [PubMed] [Google Scholar]
- 21.Grinspoon S, Carr A. Cardiovascular risk and body-fat abnormalities in HIV-infected adults. N Engl J Med. 2005;352:48–62. doi: 10.1056/NEJMra041811. [DOI] [PubMed] [Google Scholar]
- 22.Hadigan C, Rabe J, Meininger G, Aliabadi N, Breu J, Grinspoon S. Inhibition of lipolysis improves insulin sensitivity in protease inhibitor-treated HIV-infected men with fat redistribution. Am J Clin Nutr. 2003;77:490–494. doi: 10.1093/ajcn/77.2.490. [DOI] [PubMed] [Google Scholar]
- 23.Hotamisligil GS, Arner P, Caro JF, Atkinson RL, Spiegelman BM. Increased adipose tissue expression of tumor necrosis factor-alpha in human obesity and insulin resistance. J Clin Invest. 1995;95:2409–2415. doi: 10.1172/JCI117936. [DOI] [PMC free article] [PubMed] [Google Scholar]
- 24.Hotamisligil GS, Shargill NS, Spiegelman BM. Adipose expression of tumor necrosis factor-alpha: direct role in obesity-linked insulin resistance. Science. 1993;259:87–91. doi: 10.1126/science.7678183. [DOI] [PubMed] [Google Scholar]
- 25.Howard AA, Floris-Moore M, Arnsten JH, Santoro N, Fleischer N, Lo Y, Schoenbaum EE. Disorders of glucose metabolism among HIV-infected women. Clin Infect Dis. 2005;40:1492–1499. doi: 10.1086/429824. [DOI] [PMC free article] [PubMed] [Google Scholar]
- 26.Hrebicek A, Rypka M, Chmela Z, Vesely J, Kantorova M, Golda V. Tumor necrosis factor alpha in various tissues of insulin-resistant obese Koletsky rats: relations to insulin receptor characteristics. Physiol Res. 1999;48:83–86. [PubMed] [Google Scholar]
- 27.Hruz PW, Murata H, Qiu H, Mueckler M. Indinavir induces acute and reversible peripheral insulin resistance in rats. Diabetes. 2002;51:937–942. doi: 10.2337/diabetes.51.4.937. [DOI] [PubMed] [Google Scholar]
- 28.Lee GA, Seneviratne T, Noor MA, Lo JC, Schwarz JM, Aweeka FT, Mulligan K, Schambelan M, Grunfeld C. The metabolic effects of lopinavir/ritonavir in HIV-negative men. AIDS. 2004;18:641–649. doi: 10.1097/00002030-200403050-00008. [DOI] [PMC free article] [PubMed] [Google Scholar]
- 29.Lenhard JM, Furfine ES, Jain RG, Ittoop O, Orband-Miller LA, Blanchard SG, Paulik MA, Weiel JE. HIV protease inhibitors block adipogenesis and increase lipolysis in vitro. Antiviral Res. 2000;47:121–129. doi: 10.1016/s0166-3542(00)00102-9. [DOI] [PubMed] [Google Scholar]
- 30.Monier PL, Wilcox R. Metabolic complications associated with the use of highly active antiretroviral therapy in HIV-1-infected adults. Am J Med Sci. 2004;328:48–56. doi: 10.1097/00000441-200407000-00007. [DOI] [PubMed] [Google Scholar]
- 31.Mooney RA, Senn J, Cameron S, Inamdar N, Boivin LM, Shang Y, Furlanetto RW. Suppressors of cytokine signaling-1 and -6 associate with and inhibit the insulin receptor. A potential mechanism for cytokine-mediated insulin resistance. J Biol Chem. 2001;276:25889–25893. doi: 10.1074/jbc.M010579200. [DOI] [PubMed] [Google Scholar]
- 32.Murata H, Hruz PW, Mueckler M. Indinavir inhibits the glucose transporter isoform Glut4 at physiologic concentrations. AIDS. 2002;16:859–863. doi: 10.1097/00002030-200204120-00005. [DOI] [PubMed] [Google Scholar]
- 33.Murata H, Hruz PW, Mueckler M. The mechanism of insulin resistance caused by HIV protease inhibitor therapy. J Biol Chem. 2000;275:20251–20254. doi: 10.1074/jbc.C000228200. [DOI] [PubMed] [Google Scholar]
- 34.Mynarcik DC, McNurlan MA, Steigbigel RT, Fuhrer J, Gelato MC. Association of severe insulin resistance with both loss of limb fat and elevated serum tumor necrosis factor receptor levels in HIV lipodystrophy. J Acquir Immune Defic Syndr. 2000;25:312–321. doi: 10.1097/00042560-200012010-00004. [DOI] [PubMed] [Google Scholar]
- 35.Nolte LA, Yarasheski KE, Kawanaka K, Fisher J, Le N, Holloszy JO. The HIV protease inhibitor indinavir decreases insulin- and contraction-stimulated glucose transport in skeletal muscle. Diabetes. 2001;50:1397–1401. doi: 10.2337/diabetes.50.6.1397. [DOI] [PubMed] [Google Scholar]
- 36.Palella FJ, Jr, Delaney KM, Moorman AC, Loveless MO, Fuhrer J, Satten GA, Aschman DJ, Holmberg SD. Declining morbidity and mortality among patients with advanced human immunodeficiency virus infection. HIV Outpatient Study Investigators. N Engl J Med. 1998;338:853–860. doi: 10.1056/NEJM199803263381301. [DOI] [PubMed] [Google Scholar]
- 37.Ranganathan S, Kern PA. The HIV protease inhibitor saquinavir impairs lipid metabolism and glucose transport in cultured adipocytes. J Endocrinol. 2002;172:155–162. doi: 10.1677/joe.0.1720155. [DOI] [PubMed] [Google Scholar]
- 38.Reaven GM. Banting lecture of 1988. Role of insulin resistance in human disease. Diabetes. 1988;37:1595–1607. doi: 10.2337/diab.37.12.1595. [DOI] [PubMed] [Google Scholar]
- 39.Reeds DN, Yarasheski KE, Fontana L, Cade WT, Laciny E, DeMoss A, Patterson BW, Powderly WG, Klein S. Alterations in liver, muscle, and adipose tissue insulin sensitivity in men with HIV infection and dyslipidemia. Am J Physiol Endocrinol Metab. 2006;290:E47–E53. doi: 10.1152/ajpendo.00236.2005. [DOI] [PubMed] [Google Scholar]
- 40.Rudich A, Vanounou S, Riesenberg K, Porat M, Tirosh A, Harman-Boehm I, Greenberg AS, Schlaeffer F, Bashan N. The HIV protease inhibitor nelfinavir induces insulin resistance and increases basal lipolysis in 3T3–L1 adipocytes. Diabetes. 2001;50:1425–1431. doi: 10.2337/diabetes.50.6.1425. [DOI] [PubMed] [Google Scholar]
- 41.Rui L, Yuan M, Frantz D, Shoelson S, White MF. SOCS-1 and SOCS-3 block insulin signaling by ubiquitin-mediated degradation of IRS1 and IRS2. J Biol Chem. 2002;277:42394–42398. doi: 10.1074/jbc.C200444200. [DOI] [PubMed] [Google Scholar]
- 42.Schwarz JM, Lee GA, Park S, Noor MA, Lee J, Wen M, Lo JC, Mulligan K, Schambelan M, Grunfeld C. Indinavir increases glucose production in healthy HIV-negative men. AIDS. 2004;18:1852–1854. doi: 10.1097/00002030-200409030-00017. [DOI] [PubMed] [Google Scholar]
- 43.Ueki K, Kadowaki T, Kahn CR. Role of suppressors of cytokine signaling SOCS-1 and SOCS-3 in hepatic steatosis and the metabolic syndrome. Hepatol Res. 2005;33:185–192. doi: 10.1016/j.hepres.2005.09.032. [DOI] [PubMed] [Google Scholar]
- 44.Ueki K, Kondo T, Kahn CR. Suppressor of cytokine signaling 1 (SOCS-1) and SOCS-3 cause insulin resistance through inhibition of tyrosine phosphorylation of insulin receptor substrate proteins by discrete mechanisms. Mol Cell Biol. 2004;24:5434–5446. doi: 10.1128/MCB.24.12.5434-5446.2004. [DOI] [PMC free article] [PubMed] [Google Scholar]
- 45.Woerle HJ, Mariuz PR, Meyer C, Reichman RC, Popa EM, Dostou JM, Welle SL, Gerich JE. Mechanisms for the Deterioration in Glucose Tolerance Associated With HIV Protease Inhibitor Regimens. Diabetes. 2003;52:918–925. doi: 10.2337/diabetes.52.4.918. [DOI] [PubMed] [Google Scholar]
- 46.Wolins NE, Quaynor BK, Skinner JR, Tzekov A, Park C, Choi K, Bickel PE. OP9 mouse stromal cells rapidly differentiate into adipocytes: characterization of a useful new model of adipogenesis. J Lipid Res. 2006;47:450–460. doi: 10.1194/jlr.D500037-JLR200. [DOI] [PubMed] [Google Scholar]
- 47.Yamauchi T, Tobe K, Tamemoto H, Ueki K, Kaburagi Y, Yamamoto-Honda R, Takahashi Y, Yoshizawa F, Aizawa S, Akanuma Y, Sonenberg N, Yazaki Y, Kadowaki T. Insulin signalling and insulin actions in the muscles and livers of insulin-resistant, insulin receptor substrate 1-deficient mice. Mol Cell Biol. 1996;16:3074–3084. doi: 10.1128/mcb.16.6.3074. [DOI] [PMC free article] [PubMed] [Google Scholar]
- 48.Yan Q, Hruz PW. Direct comparison of the acute in vivo effects of HIV protease inhibitors on peripheral glucose disposal. J Acquir Immune Defic Syndr. 2005;40:398–403. doi: 10.1097/01.qai.0000176654.97392.c7. [DOI] [PMC free article] [PubMed] [Google Scholar]
- 49.Yarasheski KE, Tebas P, Sigmund C, Dagogo-Jack S, Bohrer A, Turk J, Halban PA, Cryer PE, Powderly WG. Insulin resistance in HIV protease inhibitor-associated diabetes. J Acquir Immune Defic Syndr Hum Retrovirol. 1999;21:209–216. doi: 10.1097/00126334-199907010-00005. [DOI] [PMC free article] [PubMed] [Google Scholar]


