Abstract
Real-time cell analysis (RTCA) system based on measurement of electrical microimpedance has been introduced to monitor adherent cell cultures. We describe its use for real-time analysis of hematopoietic cell adhesion to bone marrow stroma proteins. Cells growing in suspension do not generate any significant change in the microimpedance signal until the surface with embedded microelectrodes is coated with a cell-binding protein. We show that in this case, the microimpedance signal specifically reflects cell binding to the coated surface. The optimized method was used to monitor the effect of two histone deacetylase inhibitors, suberoylanilide hydroxamic acid (SAHA) and tubastatin A, on JURL-MK1 cell adhesion to cell-binding fragment of fibronectin (FNF). Both compounds were used in non-toxic concentrations and induced an increase in the cell adhesivity. The kinetics of this increase was markedly slower for SAHA although tubulin hyperacetylation occurred rapidly for any of the two drugs. The strengthening of cell binding to FNF was paralleled with a decrease of Lyn kinase activity monitored using an anti-phospho-Src family antibody. The inhibition of Src kinase activity with PP2 accordingly enhanced JURL-MK1 cell interaction with FNF. Actin filaments were present at the proximity of the plasma membrane and in numerous membrane protrusions. In some cells, F-actin formed clusters at membrane regions interacting with the coated surface and these clusters colocalized with active Lyn kinase. Our results indicate that the role of Src kinases in the regulation of hematopoetic cell adhesion signaling is similar to that of c-Src in adherent cells.
Keywords: cellular adhesion, microimpedance, fibronectin, SAHA, tubastatin A, Lyn
Introduction
The interactions of hematopoietic cells with their environment are important for their proper development and function. Stem and progenitor hematopoietic cells reside in the bone marrow and their ability to survive, proliferate and differentiate depends from contacts with the bone marrow extracellular matrix (ECM) as well as with stromal cells.1 Hematopoietic cell interaction with the extracellular matrix is also involved in stem cell homing to the bone marrow which is required for a successful hematopoietic recovery after transplantation.2 The mature forms of hematopoietic cells are released into the peripheral blood and the lymph where they circulate without stable attachment to a matrix. Nevertheless, they still form transient contacts with endothelial cells and matrix proteins, e.g., during lymphocyte migration to inflammatory sites.3 Several hematological malignant diseases, such as chronic myeloid leukemia or multiple myeloma, are characterized by alteration of cell adhesivity to ECM proteins.4,5 However, the molecular mechanisms of these defects are poorly understood. Leukemic cell adhesion to the bone marrow microenvironment also confers chemotherapy drug resistance, promotes leukemia cell survival and contributes to the residual disease.6,7
The basic method to assess the cellular adhesivity to a matrix protein consists in cell incubation in wells coated with the protein of interest, washing and determination of the number of the attached cells (cell counting or cell staining followed by photometric detection). To our experience, this method allows for reliable detection of long-lasting changes in the cellular adhesivity to the coated surface when the difference between samples represents at least 20% of the adhered cell fraction. Our previous screening experiments have shown that cells derived from chronic myelogenous leukemia (JURL-MK1 and K562 cell lines) specifically attache to fibronectin, but not to vitronectin, laminin or collagens.8 We thus use fibronectin as a simple model of the bone marrow extracellular matrix proteins.
The real-time cell analysis (RTCA) system (Roche) has been introduced for continuous monitoring of adherent cell cultures. This label-free and non-invasive method is based on the measurement of electrical impedance between interdigitated microelectrodes which are integrated on the bottom of tissue culture plates.9 The impedance measurement provides quantitative information about the biological status of the cells, including cell number, viability, and morphology of adherent cells. In this work, we describe its use for real-time monitoring of hematopoietic cell adhesion to fibronectin fragment-coated surfaces.
We have previously shown that suberoylanilide hydroxamic acid (SAHA) and tubastatin A (tubA) increase leukemic cell adhesivity to fibronectin.8,10 We now describe the use of RTCA system for monitoring the kinetics of changes in cell interaction with surface coated with cell-binding fragment of fibronectin (FNF) upon treatment with these histone deacetylase inhibitors.
Results
Tissue culture plates (200 µL wells) with embedded electrodes were coated with fibronectin fragment (FNF) or bovine serum albumin (BSA) as a control. In the first series of experiments, different amount of JURL-MK1 cells (in 100 µL of cell suspension) were applied to the wells, which were pre-equilibrated with RPMI medium (100 µL). In non-coated or BSA-coated wells, the cell addition induced no or modest change in the measured microimpedance. We observed no significant increase in microimpedance even when the cells were seated to the bottom of the wells by short centrifugation. In FNF-coated wells, the signal increased in time reaching a plateau after about 2 h. Thereafter, the signal usually exhibited a slow decrease. The signal intensity increased with the cell number and 60 000 cells per well were sufficient to obtain clearly specific response. Higher cell numbers were considered not suitable as microscopic examination showed that about 100 000 cells almost entirely cover the area of the well bottom and additional cells would not have free access to the FNF-coated surface.
We have first studied the cell adhesivity to FNF using the end-point protocol: the cells were incubated for 1h in FNF-coated wells, then the non-adhered cells were washed out and the attached cells were quantified using fluorometric measurement. We found that the adherent cell fraction (ACF) largely differed among various cell lines (Fig. 1A). Very similar results were obtained from the real-time monitoring of cellular adhesivity using RTCA device (Fig. 1B).
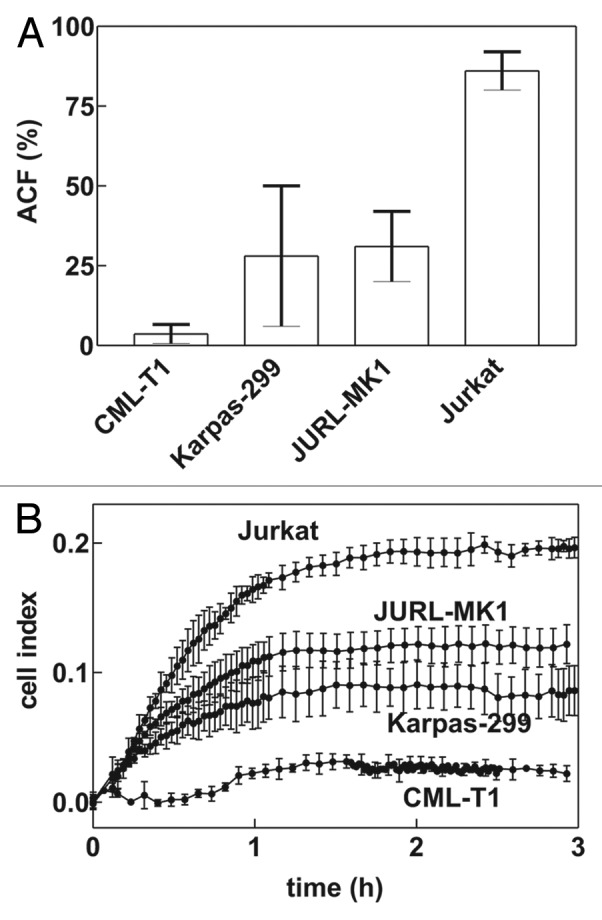
Figure 1. Adhesivity of different cell lines to fibronectin fragment (FNF). (A) Fraction of adhered cells after 1h incubation in FNF-coated wells as determined by the end-point method for the indicated leukemic cell lines. The bars show means and standard deviations from multiple experiments (7 to 20). (B) Microimpedance signal from RTCA apparatus. E-plate was coated with FNF, equilibrated in RPMI, and 60 000 cells from the indicated cell line was added to wells in quadruplicates. Means and standard deviations of quadruplicates are plotted. The results are representative from several experiments (3 to 15).
The ability of RTCA system to detect changes in cell binding to FNF was tested using the known activator of adhesion signaling pathways, 12-O-tetradecanoylphorbol-13-acetate (TPA). JURL-MK1 cells were allowed to adhere for about 2 h to FNF-coated wells and 1 µL TPA (100 nM final concentration in the well) was added thereafter. The microimpedance signal started to increase immediately after TPA addition (Fig. 2A). Similar marked effect of TPA on the microimpedance signal was observed for other cell lines, e.g., for Jurkat cells (Fig. 2B), as well as for primary leukemic cells (data not shown). In the control wells (no addition), we observed only a small decrease of the signal which was probably due to slight mechanical perturbation of the cells during the manipulation (see also Fig. 3). In fact, transient signal fluctuations were regularly observed after each manipulation with the wells or with the entire RTCA device, even after gentle opening/closing the door of the incubator where the device was placed.
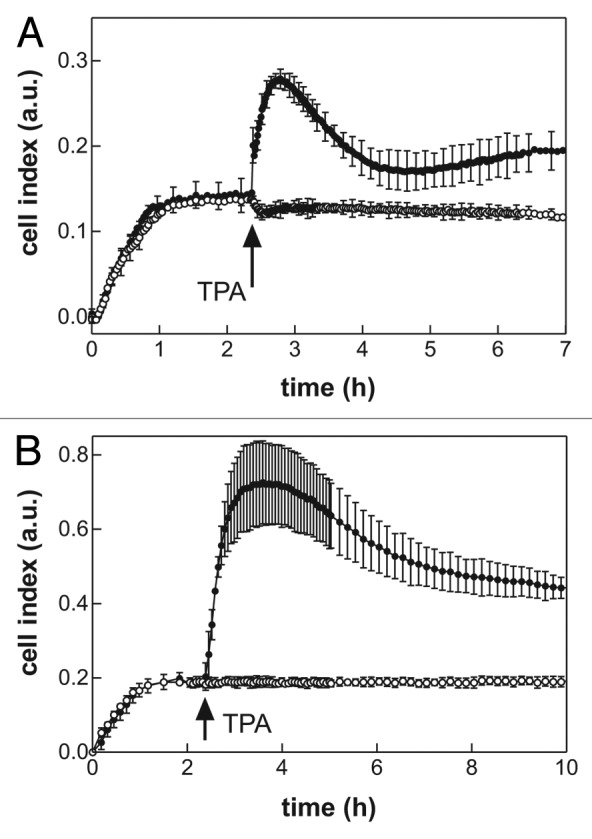
Figure 2. Effect of 12-O-tetradecanoylphorbol-13-acetate (TPA) on cell interaction with fibronectin (FNF). JURL-MK1 (A) or Jurkat (B) cells (60 000 per well), were allowed to adhere to FNF-coated wells and TPA (100 nM final concentration) was added after about 2 h. Open symbols, control wells without TPA; closed symbols, TPA-treated. Means and standard deviations of triplicates are shown. The time of TPA addition is marked with an arrow
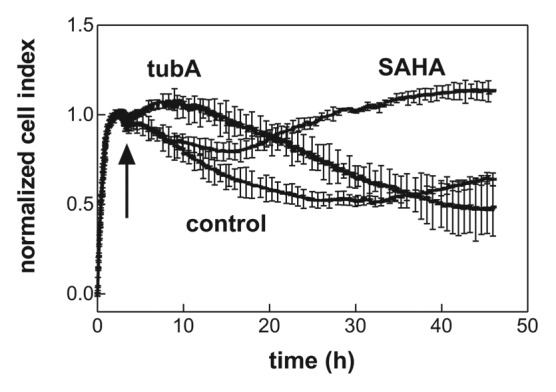
Figure 3. Effect of SAHA and tubastatin A on JURL-MK1 cell interaction with fibronectin fragment (FNF). The cells (60 000/well) were allowed to adhere to FNF and SAHA (1 µM) or tubastatin A (10 µM) were added at the time point indicated with the arrow. The lines are averages and standard deviations from triplicates. Similar time courses of the microimpedance signal were obtained in repeated experiments.
We also noted that the addition of compounds which were dissolved in dimethyl sulfoxide (DMSO) produced a sharp transient increase in the microimpedance signal. We hypothesized that this effect was an artifact being due to low DMSO conductivity. We thus tested the effect of DMSO addition to wells containing solely 200 µL RPMI medium (without cells). As it is shown in Figure 4, the addition of 0.2–2 µL DMSO (resulting in 0.1–1% DMSO in the well) was followed by transient abrupt increase of the microimpedance. For up to 0.4% DMSO, the signal returned to the basal level within 30 min. However, more durable signal change was observed at higher DMSO concentrations. In the subsequent experiments, DMSO amount was always kept at less than 0.1%.
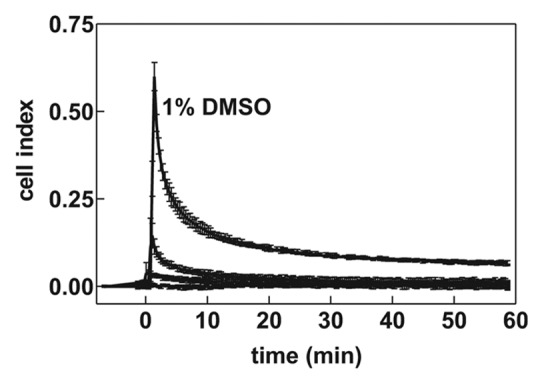
Figure 4. Transient effect of DMSO addition on the microimpedance signal. Non-coated wells were filled with RPMI medium and increasing volumes of DMSO were added at the time 0 to wells in triplicates. Means and standard deviations of triplicates are shown for control (no DMSO) and DMSO 0.1%, 0.4%, and 1%. The experiment was repeated with closely similar results
The optimized RTCA system was then used to monitor the kinetics of drug effects on the cellular adhesivity to FNF. We have previously reported that suberoylanilide hydroxamic acid (SAHA) treatment of leukemic cells induced an increase in the adherent cell fraction which was measured using the end-point protocol after 24 or 48 h incubation with the effector.8 Also, we found that another histone deacetylase inhibitor, tubastatin A (tubA), increased JURL-MK1 cell adhesivity to FNF as well.10 The effects of SAHA and tubastatin A on JURL-MK1 cell interaction with FNF was studied using RTCA device (Fig. 3). The cells were allowed to adhere for about 2 h and 0.5–1 µM SAHA or 10 µM tubA has been added thereafter. In agreement with the data obtained from the end-point method, both agents induced an increase in the observed microimpedance in comparison with the untreated controls. However, while the effect of tub A was nearly immediate, SAHA-induced increase occurred after a delay (5 to 9 h, range from 8 independent experiments). The effect of another histone deacetylase inhibitor, sodium butyrate, on JURL-MK1 cell interaction with FNF was closely similar to that of SAHA (data not shown).
Tubulin belongs to the known substrates of HDAC6 and SAHA or tub A treatment thus should result in tubulin acetylation. The kinetics of the increase in α tubulin acetylation was analyzed using western blotting and acetylation-specific anti-tubulin antibody. As shown in Figure 5, both drugs induced tubulin hyperacetylation within 1 h following the drug addition (the half-life was 20 to 30 min).
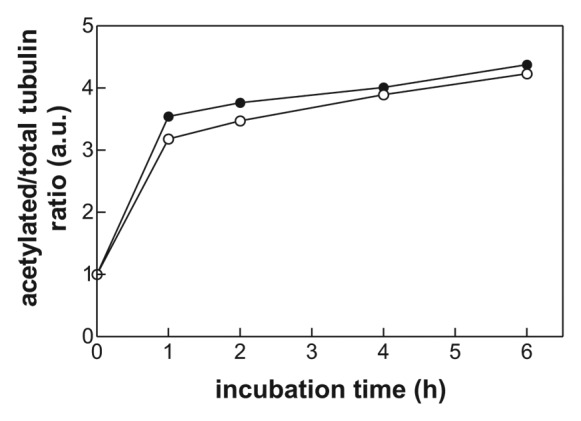
Figure 5. Kinetics of α tubulin acetylation after treatment of JURL-MK1 cells with 0.5 µM SAHA (open circles) or 10 µM tubastatin A (closed circles). Cell aliquots were taken at different time intervals and the relative amount of acetylated tubulin and total tubulin was determined using specific antibodies and western blotting. The ratio of acetylated tubulin/tubulin was expressed in relative units with regard to the control sample (without treatment).
In our previous work, we analyzed in detail the kinetics of histone acetylation after SAHA treatment of JURL-MK1 cells and found that the extent of acetylation at multiple different acetylation sites progressively increased for 4 to 10 h, reaching up to 30-fold of the control value.10 We thus searched for changes in the acetylation level of histones upon tubA treatment, both by western blotting and immunofluorescence microscopy, for up to 24 h incubation with the drug. However, the increase in H2AK5, H4K8, and H4K16 levels was only mild, if any (2-fold at the maximum) and at any time point lower than that induced by SAHA (data not shown).
Src-family kinases (SFKs) are known to be essential for signal transduction from cell surface receptors including integrins. We thus explored the effect of HDAC inhibitors on SFK activity using a phospho-specific antibody recognizing pTyr416 in c-Src or the corresponding tyrosine residues in other SFKs (Lyn, Hck, Fyn, Lck, and Yes). We analyzed mRNA levels for different members of SFK in JURL-MK1 cells and found that the dominant Src kinases expressed in these cells were Lyn A and Lyn B (data not shown). In agreement with this finding, the anti-phospho-SFK antibody reacted with two major bands of 56 and 53 kDa, probably corresponding to A and B isoforms of Lyn kinase (Fig. 6A). The intensity of p-SFK staining was reduced after treatment with SAHA, tubA or TPA. The effect was more pronounced and faster for tubA in comparison with SAHA (Fig. 6B). These results suggested that Lyn kinase activity may be related to JURL-MK1 cell adhesivity to FNF. We thus tested the effect of PP2, an inhibitor of Src family kinases and found that Lyn kinase inhibition with PP2 indeed resulted in an increase of the microimpedance signal in RTCA analyzer (Fig. 7).
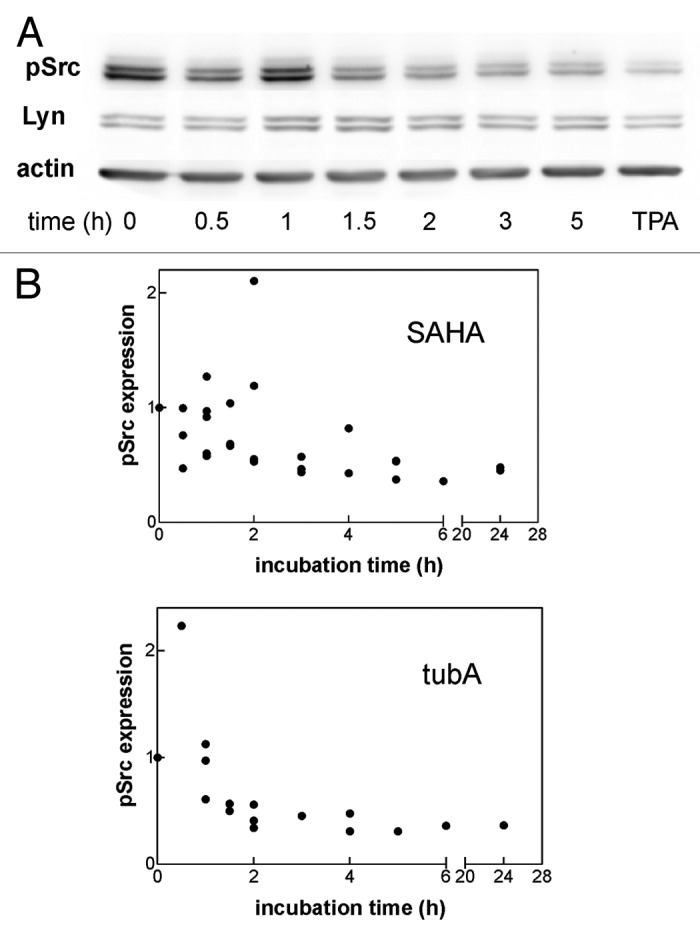
Figure 6. Effect of SAHA and tubastatin A on the activity of Src family kinases. JURL-MK1 cells were treated with 0.5 µM SAHA or 10 µM tubastatin A for up to 24 h and the level of autophosphorylated (active) Src kinases as well as that of Lyn kinase were assessed by western-blotting. (A) Representative blots from SAHA-treated cells at different incubation times. The effect of 30 min treatment with 100 nM TPA is shown in the last lane for comparison. (B) Summary results of anti-pSFK western-blots from repeated experiments (n = 4 for SAHA, n = 3 for tubA). The sum of the two main pSFK bands from each lane was expressed as relative to the sum in the corresponding control lane.
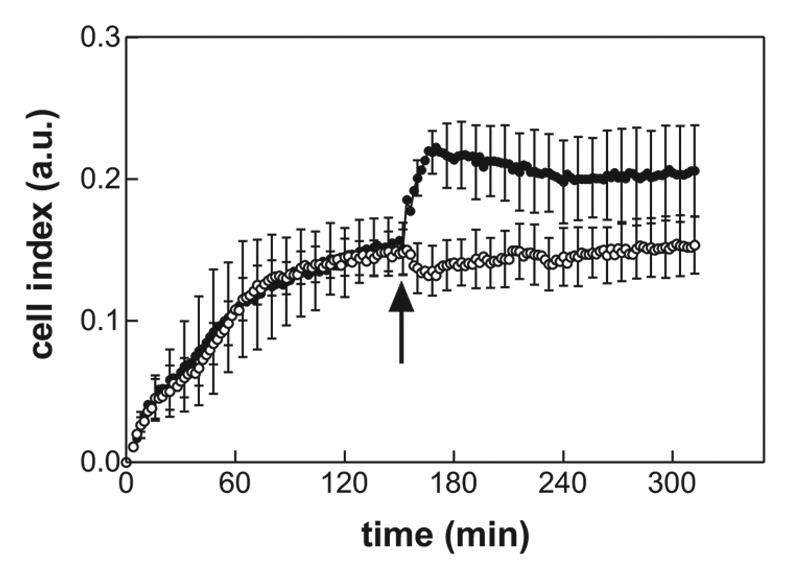
Figure 7. Effect of PP2 on JURL-MK1 cell interaction with FNF. The cells (60,000 per well), were allowed to adhere to FNF-coated wells and PP2 (10 µM final concentration) was added thereafter. Open symbols, control wells without treatment; closed symbols, PP2. Means and standard deviations of triplicates are shown. The time of PP2 addition is marked with an arrow. Similar results were obtained in repeated experiments.
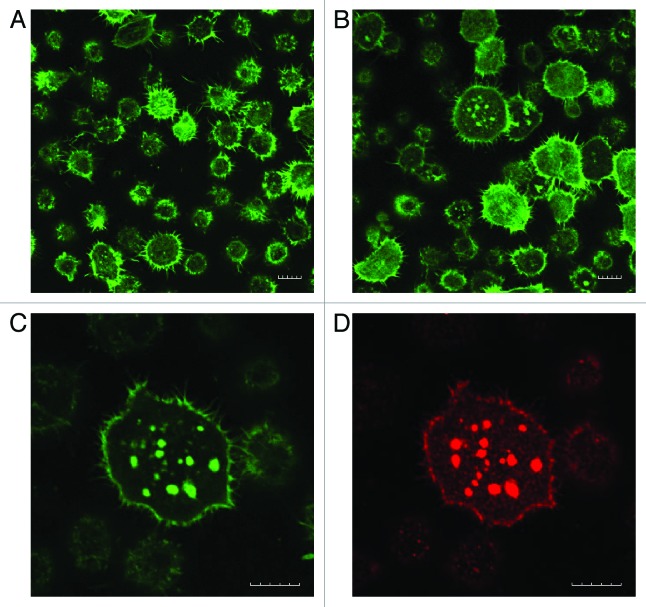
In the attempt to reveal possible Lyn interaction with cell adhesion structures, JURL-MK1 cells interacting with FNF-coated surface were analyzed using confocal microscopy. Filamentous actin (F-actin) was stained with FITC-phalloidin while the localization of paxillin, vinculin, active (autophosphorylated) Lyn, and inactive Lyn was visualized using immunofluorescence labeling. F-actin was present mainly at the proximity of the plasma membrane and in multiple fine membrane protrusions (Fig. 8A and B). After about 10–20 min incubation on FNF-coated surface, the cells started to spread, increasing their area in optical slices adjacent to the coated surface (Fig. 8B). The fraction of spread cells progressively increased with time reaching a maximum (20–30% of total cell number) after about 1 h. No cell spreading was observed on non-coated coverslips. In some spread cells, F-actin signal was concentrated into bright spots (up to 1–2 µm in diameter) where it usually co-localized with the active form of Lyn kinase (Fig. 8C and D). On the other hand, no co-localization with F-actin has been detected for the inactive Lyn, vinculin, or paxillin (data not shown). Both vinculin and paxillin displayed diffuse, homogeneous staining without any discernible structure, with the exception of paxillin concentration in an area near the cell nucleus, presumably the centrosome (not shown).
Figure 8. F-actin and p-SFK distribution in JURL-MK1 cells on FNF. The cells were seeded to FNF-coated slide, incubated for 15 min (A) or 1h (B–D) at 37 °C, then fixed and stained with FITC-phalloidin (A–C) to visualize actin fibers and anti-p-SFK antibody (D) to detect the active form of Lyn kinase. The microscope was focused to the plane adjacent to the coated slide. (A and B) show representative images from repeated experiments. (C and D) show a cell with prominent F-actin clusters. Scale bars: 10 µm.
Discussion
The real-time cell analysis system was optimized for hematopoietic cell monitoring. When the system is used for adherent cell types, 10 000 cells per well is usually recommended. In the case of hematopoietic cells, higher cell number had to be applied, probably because of the smaller cell size and also due to a weaker cell attachment. The diameter of JURL-MK1 cells is of 10–12 µm (as measured using BioRad cell counter) while adherent cells typically cover the area of 200–1000 µm2.11 Furthemore, even minor mechanical perturbation of the RTCA system regularly produced transient decrease of the observed signal indicating that the attachment force is low and/or that the binding is highly dynamic.
The amplitude of the signal from RTCA measurement correlated well with the cellular adhesivity to FNF for different cell lines as it was determined by the end-point measurement (Fig. 1). These results further confirm that the observed signal mainly reflects the cell binding to FNF.
Using a known activator of adhesion pathways, TPA, we documented the ability of RTCA system to follow fast changes in cell interactions with the coated surface (Fig. 2). TPA treatment results in activation of intracellular substrates such as the protein kinase C, in cytoskeleton reorganization and in strengthening of integrin binding to fibronectin.12-14 A large increase in the microimpedance signal upon TPA addition was obtained not only for JURL-MK1 cells (Fig. 2A), but also for Jurkat cells (Fig. 2B), which are much more adherent than JURL-MK1. We determined by the end-point measurement that more than 85% of Jurkat cells remain attached to FNF after well washing in the absence of TPA (Fig. 2A) and only a small increase of this number (of about 5%) could be detected by this method after TPA treatment (data not shown). Thus, the increase in RTCA signal observed upon TPA addition reflects strengthening of the interaction rather than an increase in the number of the attached Jurkat cells.
Dimethyl sulfoxide is often used to solubilize compounds with biological activity. It is thus important to take into account that DMSO addition to water solution induces transient increase of microimpedance at the cell bottom (Fig. 4). It is likely that a drop of DMSO, which has a higher density than water, forms a layer with higher impedance at the well bottom. The layer is then progressively dissipated by diffusion and the impedance returns nearly to the original value if the final DMSO concentration is not higher than 0.4%.
After the series of proof-of-concept measurements, the system was used to monitor the effect of two histone deacetylase inhibitors—SAHA and tubA—on the interaction of leukemic cells with fibronectin fragment. Inhibition of histone deacetylases (HDACs) represents a new strategy in human cancer therapy since these enzymes play a fundamental role in regulating gene expression.15,16 SAHA is the first HDAC inhibitor that has been approved for clinical use (treatment of cutaneous T-cell lymphoma). The mechanism of SAHA action is complex, cell type-dependent, and can involve growth arrest, differentiation, senescence, and various forms of cell death, such as the apoptosis or the mitotic cell death.17 We have recently reported that SAHA at subtoxic doses, which are achievable in clinical applications, also increases cell adhesivity to fibronectin in a variety of leukemic cell lines.8 TubA is a selective HDAC inhibitor that is highly efficient in inhibiting HDAC6 but it inhibits other HDACs as well when it is used in micromolar range. We expected that tubA could affect the cellular adhesivity to matrix proteins through acetylation of tubulin, the major structural protein of microtubules, which belongs to substrates of HDAC6. It was reported that decreased tubulin acetylation is related to increased cell migration and, on the other hand, tubulin hyperacetylation slows down the turnover of focal adhesions.18-20 RTCA analysis of the effects of SAHA and tubastatin A confirmed that both these drugs intensified JURL-MK1 cell interaction with FNF, although with different kinetics (Fig. 3). The effect of tubA treatment was nearly immediate while at least 5 h incubation with SAHA was necessary to induce a change in the microimpedance signal. The delay could be due to slower penetration of SAHA into the cells and we thus analyzed the acetylation of α tubulin as a marker of the drug presence in the cell. As shown in Figure 5, tubulin acetylation occurs rapidly after addition of either tubA or SAHA. This indicates that the drug penetration into the cells is fast and, also, that tubulin hyperacetylation is probably not the direct cause of the increase in JURL-MK1 cell adhesivity to FNF, at least in the case of SAHA.
The kinetics of SAHA-induced increase in JURL-MK1 cell adhesion to FNF is similar to that of histone acetylation described in our previous study.10 We thus hypothesized that the kinetics of histone acetylation might be faster in the case of tubA and this difference could explain the observed difference in the kinetics of cell interaction with FNF. However, we found only modest increase in histone acetylation when JURL-MK1 cells were treated with 10 µM tubA.
The involvement of SFKs in the cell adhesion and migration is the most extensively described for the prominent member of the family, c-Src.21 This kinase binds to the cytoplasmic tails of integrins and assures among others maximal activation of the focal adhesion kinase (FAK), which is required both for focal adhesion assembly and disassembly.22,23 Sustained Src signaling promotes rapid focal adhesion turnover and cell migration while the stable cell attachment to the extracellular matrix is associated with an attenuation of Src activity.21 Hematopoietic cells predominantly express SFKs different from c-Src (such as Lyn or Hck). Also, the cytoskeleton structure of these cells is different from that of adherent cell types. While adherent cells form actin fibers and attach to the extracellular matrix through focal adhesions, mature leukocytes form specialized small adhesion structures, podosomes, which differ from focal adhesions, e.g., by dynamic turnover and the capacity to degrade the extracellular matrix.24 Interestingly, it has been reported that podosomes are generated from focal adhesions due to c-Src overexpression in adherent cells.25 The nature of adhesion structures in hematopoietic progenitors and unmature cells like leukemic cell lines has not been well described to date. However, the involvement of hematopoietic SFK members in the regulation of these structures may be similar to that of c-Src. The multi-specific antibody we used detects two dominant bands of active SFKs in JURL-MK1 cells (Fig. 6A), which are likely to correspond to two splicing isoforms of Lyn kinase.26 Indeed, two bands at the same molecular weight are detected in JURL-MK1 cells using a specific anti-Lyn antibody (Fig. 6A). Using the phospho-specific antibody, we showed that the level of active SFKs was reduced by both HDAC inhibitors (Fig. 6B) and also by TPA (last lane in Fig. 6A). On the other hand, although it has been reported that HDAC inhibitors can induce downregulation of c-Src level,27,28 neither SAHA nor tubA reduced total Lyn expression level (Fig. 6A for SAHA, not shown for tubA). Src family kinase inhibition with PP2 resulted in an immediate rise of the microimpedance signal (Fig. 7). It is thus possible that HDAC inhibition reduces SFK activity and thereby leads to stabilization of adhesion structures.
It has been shown that adhesion of hematopoietic CD34+ progenitors to fibronectin is mediated by α5β1 integrins (VLA-5).29 JURL-MK1 cells are CD34 positive and express β1 and β2 integrins, including α5β1.8 We suppose that the adhesion structures are formed at the cytoplasmic parts of integrins as it occurs in adherent cells and lymphocytes. However, adhesion structures in leukocytes are small and dynamic and their visualization is challenging.30 All known forms of adhesion structures associate with polymerized actin. In JURL-MK1 cells, F-actin was found in numerous membrane protrusions (filopodia) and, in addition, seemed to aggregate into clusters of different size at the contact of the cell membrane with fibronectin (Fig. 8). However, we were unable to correlate the localization of F-actin with common markers of adhesion structures, such as paxillin and vinculin. Although the nature and the function of the clusters is not clear, they may be regulated by Lyn kinase, as the active form of Lyn was found to localize to them. Previously, Lyn has been shown to localize in putative adhesion structures (F-actin rich spots) formed in another chronic myelogenous leukemia-derived cell line, K562.31 Identification of molecular composition and function of adhesion structures in hematopoietic cells will require further investigation.
Materials and Methods
Materials
Fibronectin fragment (120 kDa cell attachment region) was purchased from Chemicon International. Suberoylanilide hydroxamic acid (SAHA) was obtained from Cayman Chemical (distributed by the Axxora platform) and 2 mM stock solution was prepared in dimethyl sulfoxide (DMSO). Tubastatin A was supplied by BioVision and 10 to 20 mM stock solutions were made in DMSO. Further dilutions of both effectors were made in sterile water. 12-O-tetradecanoylphorbol-13-acetate (TPA) was purchased from Sigma, stock solution (2 mM) was prepared in ethanol. The mouse monoclonal antibody to acetylated α tubulin was purchased from Abcam, the mouse monoclonal antibody against α tubulin conjugated with a fluorescence dye (Alexa488) from Invitrogen. The anti-phospho-Src family (Tyr416) and anti-non-phospho-Src family antibody was from Cell Signaling, mouse anti-Lyn antibody and mouse anti-paxillin antibody from BD Biosciences. The antibodies against acetylated histones H2AK5, H4K16 and H4K8, anti-histone H2A and H4 antibodies and anti-vimentin were from Abcam.
Cell culture
JURL-MK1, CML-T1 and Karpas-299 cell lines were purchased from DSMZ (German Collection of Microorganisms and Cell Cultures), Jurkat cells from the European Collection of Animal Cell Cultures. The cells were cultured in RPMI 1640 medium supplemented with 10% fetal calf serum, 4 mM L-alanyl-L-glutamine, 100 U/mL penicillin, and 100 µg/mL streptomycin at 37 °C in 5% CO2 humidified atmosphere.
Plate coating with fibronectin fragment (FNF)
To prepare the coated plate, 50 µL of fibronectin fragment solution (20 µg/mL in distilled water) was added to each well of a Nunc Maxisorp 96-well microtitration plate or of 16-well E-plate for RTCA and the plates were subsequently incubated overnight in the cold (10 °C). Then, the wells were washed three times in PBS and the remaining protein adherence sites were blocked by 200 µL 1% bovine serum albumin (BSA) in PBS for at least 30 min at room temperature. The plate was washed once again in PBS immediately before use. Control wells (BSA-coated) were incubated with 4% BSA instead of FNF overnight in the cold.
Adhesivity measurement—end point protocol
The end-point method for assessment of cellular adhesivity to FNF has been described previously.8 Briefly, the cells (1 × 10⁴) were seeded into FNF-coated wells of a microtitration plate and incubated for 1 h at 37 °C. Then, the wells were washed with PBS/Ca2+/Mg2+ using a multichannel adaptor to the suction-pump and the remaining cells were quantified by means of fluorescent labeling (Cy-Quant Cell Proliferation Assay Kit; Molecular Probes). The adherent cell fraction (ACF) was calculated using the fluorescence signal from FNF-coated plate and that from reference plate, which contained the total cell number.
Real-time cell analysis
The real-time analysis was performed using RTCA XCelligence DP system from Roche, which was placed in an incubator (at 37 °C) with regulated CO2 content (5%). FNF-coated E-plates containing 100 µL RPMI 1640 culture medium per well were equilibrated at 37 °C and the electrical microimpedance signal (cell index) was set to zero in these conditions. The cells (60 000 cells if not specified otherwise) were added in 100 µL of suspension in RPMI, usually in quadruplicates. After the cell attachment (saturation of the microimpedance signal), effectors were added in a small volume of solvent (max. 2 µL). Special care was taken to limit cell perturbation during the manipulation as even mild shaking resulted in signal fluctuations.
Electrophoresis and western blotting
The amount of selected proteins was analyzed using electrophoretic separation of cell lysates on 10% polyacrylamide gels and western blotting using specific antibodies. The method was described in detail previously.32 The chemiluminiscence or fluorescence signal from membranes was detected and evaluated using G-box iChemi XT4 digital imaging device (Syngene Europe). The ratio of signals from acetylated tubulin and from total tubulin was calculated for each sample and the relative increase in tubulin acetylation after different incubation times was expressed as fold increase of the ratio value from the control sample (prior to drug addition). Membranes which were assessed for phosphorylated Src kinases were reprobed using anti-actin antibody and the level of p-SFK was expressed as relative to the actin level.
Confocal microscopy
The morphology of JURL-MK1 cells on fibronectin-coated surface was analyzed using Olympus FluoView FV1000 microscope. The cells were seeded on FNF-coated slides (Superfrost Plus, Thermo Scientific) and incubated for the specified time interval at 37 °C in a humidified chamber. Cells were fixed in 2% PFA, permeabilized in 0.3% Triton X-100 and treated with Image-iT FX signal enhancer before staining with FITC-conjugated phalloidin to visualize polymerized actin or with primary antibodies against pSFK, non-pSFK, paxillin or vinculin followed by the appropriate fluorescent secondary antibody. The samples were mounted in mowiol mounting media and the confocal fluorescence signals were recorded along with the differential interference contrast image.
Acknowledgments
The work was supported by the Ministry of Health of the Czech Republic (Project for conceptual development of research organization, 00023736) and by European Union (ERDF OPPK CZ.2.16/3.1.00/24001). We wish to thank M. Voráčová for the expert technical assistance in western blotting.
Glossary
Abbreviations:
- RTCA
real-time cell analysis
- FNF
fibronectin fragment (cell attachment region)
- SAHA
suberoylanilide hydroxamic acid
- tubA
tubastatin A
- ECM
extracellular matrix
- DMSO
dimethylsulfoxide
- TPA
12-O-tetradecanoylphorbol-13-acetate
Disclosure of Potential Conflicts of Interest
No potential conflicts of interest were disclosed.
Footnotes
Previously published online: www.landesbioscience.com/journals/celladhesion/article/24531
References
- 1.Prosper F, Verfaillie CM. Regulation of hematopoiesis through adhesion receptors. J Leukoc Biol. 2001;69:307–16. [PubMed] [Google Scholar]
- 2.Sahin AO, Buitenhuis M. Molecular mechanisms underlying adhesion and migration of hematopoietic stem cells. Cell Adh Migr. 2012;6:39–48. doi: 10.4161/cam.18975. [DOI] [PMC free article] [PubMed] [Google Scholar]
- 3.Long EO. ICAM-1: getting a grip on leukocyte adhesion. J Immunol. 2011;186:5021–3. doi: 10.4049/jimmunol.1100646. [DOI] [PMC free article] [PubMed] [Google Scholar]
- 4.Salesse S, Verfaillie CM. Mechanisms underlying abnormal trafficking and expansion of malignant progenitors in CML: BCR/ABL-induced defects in integrin function in CML. Oncogene. 2002;21:8605–11. doi: 10.1038/sj.onc.1206088. [DOI] [PubMed] [Google Scholar]
- 5.Kuzelová K, Hrkal Z. Rho-signaling pathways in chronic myelogenous leukemia. Cardiovasc Hematol Disord Drug Targets. 2008;8:261–7. doi: 10.2174/187152908786786241. [DOI] [PubMed] [Google Scholar]
- 6.Maffei R, Fiorcari S, Bulgarelli J, Martinelli S, Castelli I, Deaglio S, et al. Physical contact with endothelial cells through β1- and β2- integrins rescues chronic lymphocytic leukemia cells from spontaneous and drug-induced apoptosis and induces a peculiar gene expression profile in leukemic cells. Haematologica. 2012;97:952–60. doi: 10.3324/haematol.2011.054924. [DOI] [PMC free article] [PubMed] [Google Scholar]
- 7.Becker PS. Dependence of acute myeloid leukemia on adhesion within the bone marrow microenvironment. ScientificWorldJournal. 2012;2012:856467. doi: 10.1100/2012/856467. [DOI] [PMC free article] [PubMed] [Google Scholar]
- 8.Kuzelová K, Pluskalová M, Brodská B, Otevrelová P, Elknerová K, Grebenová D, et al. Suberoylanilide hydroxamic acid (SAHA) at subtoxic concentrations increases the adhesivity of human leukemic cells to fibronectin. J Cell Biochem. 2010;109:184–95. doi: 10.1002/jcb.22397. [DOI] [PubMed] [Google Scholar]
- 9.Xi B, Yu N, Wang X, Xu X, Abassi YA. The application of cell-based label-free technology in drug discovery. Biotechnol J. 2008;3:484–95. doi: 10.1002/biot.200800020. [DOI] [PubMed] [Google Scholar]
- 10.Grebeňová D, Röselová P, Pluskalová M, Halada P, Rösel D, Suttnar J, et al. Proteins implicated in the increase of adhesivity induced by suberoylanilide hydroxamic acid in leukemic cells. J Proteomics. 2012;77:406–22. doi: 10.1016/j.jprot.2012.09.014. [DOI] [PubMed] [Google Scholar]
- 11.Park K, Millet LJ, Kim N, Li H, Jin X, Popescu G, et al. Measurement of adherent cell mass and growth. Proc Natl Acad Sci U S A. 2010;107:20691–6. doi: 10.1073/pnas.1011365107. [DOI] [PMC free article] [PubMed] [Google Scholar]
- 12.Davis GE, Camarillo CW. Regulation of integrin-mediated myeloid cell adhesion to fibronectin: influence of disulfide reducing agents, divalent cations and phorbol ester. J Immunol. 1993;151:7138–50. [PubMed] [Google Scholar]
- 13.Imamura H, Takaishi K, Nakano K, Kodama A, Oishi H, Shiozaki H, et al. Rho and Rab small G proteins coordinately reorganize stress fibers and focal adhesions in MDCK cells. Mol Biol Cell. 1998;9:2561–75. doi: 10.1091/mbc.9.9.2561. [DOI] [PMC free article] [PubMed] [Google Scholar]
- 14.Tulla M, Helenius J, Jokinen J, Taubenberger A, Müller DJ, Heino J. TPA primes alpha2beta1 integrins for cell adhesion. FEBS Lett. 2008;582:3520–4. doi: 10.1016/j.febslet.2008.09.022. [DOI] [PubMed] [Google Scholar]
- 15.Monneret C. Histone deacetylase inhibitors. Eur J Med Chem. 2005;40:1–13. doi: 10.1016/j.ejmech.2004.10.001. [DOI] [PubMed] [Google Scholar]
- 16.Marks PA, Xu WS. Histone deacetylase inhibitors: Potential in cancer therapy. J Cell Biochem. 2009;107:600–8. doi: 10.1002/jcb.22185. [DOI] [PMC free article] [PubMed] [Google Scholar]
- 17.Xu WS, Parmigiani RB, Marks PA. Histone deacetylase inhibitors: molecular mechanisms of action. Oncogene. 2007;26:5541–52. doi: 10.1038/sj.onc.1210620. [DOI] [PubMed] [Google Scholar]
- 18.Tran AD, Marmo TP, Salam AA, Che S, Finkelstein E, Kabarriti R, et al. HDAC6 deacetylation of tubulin modulates dynamics of cellular adhesions. J Cell Sci. 2007;120:1469–79. doi: 10.1242/jcs.03431. [DOI] [PubMed] [Google Scholar]
- 19.Wang YH, Yan ZQ, Qi YX, Cheng BB, Wang XD, Zhao D, et al. Normal shear stress and vascular smooth muscle cells modulate migration of endothelial cells through histone deacetylase 6 activation and tubulin acetylation. Ann Biomed Eng. 2010;38:729–37. doi: 10.1007/s10439-009-9896-6. [DOI] [PubMed] [Google Scholar]
- 20.Wu Y, Song SW, Sun J, Bruner JM, Fuller GN, Zhang W. IIp45 inhibits cell migration through inhibition of HDAC6. J Biol Chem. 2010;285:3554–60. doi: 10.1074/jbc.M109.063354. [DOI] [PMC free article] [PubMed] [Google Scholar]
- 21.Guarino M. Src signaling in cancer invasion. J Cell Physiol. 2010;223:14–26. doi: 10.1002/jcp.22011. [DOI] [PubMed] [Google Scholar]
- 22.Huveneers S, Danen EH. Adhesion signaling - crosstalk between integrins, Src and Rho. J Cell Sci. 2009;122:1059–69. doi: 10.1242/jcs.039446. [DOI] [PubMed] [Google Scholar]
- 23.Ruest PJ, Roy S, Shi E, Mernaugh RL, Hanks SK. Phosphospecific antibodies reveal focal adhesion kinase activation loop phosphorylation in nascent and mature focal adhesions and requirement for the autophosphorylation site. Cell Growth Differ. 2000;11:41–8. [PubMed] [Google Scholar]
- 24.Dovas A, Cox D. Signaling networks regulating leukocyte podosome dynamics and function. Cell Signal. 2011;23:1225–34. doi: 10.1016/j.cellsig.2011.02.004. [DOI] [PMC free article] [PubMed] [Google Scholar]
- 25.Oikawa T, Takenawa T. PtdIns(3,4)P2 instigates focal adhesions to generate podosomes. Cell Adh Migr. 2009;3:195–7. doi: 10.4161/cam.3.2.7510. [DOI] [PMC free article] [PubMed] [Google Scholar]
- 26.Dos Santos C, Demur C, Bardet V, Prade-Houdellier N, Payrastre B, Récher C. A critical role for Lyn in acute myeloid leukemia. Blood. 2008;111:2269–79. doi: 10.1182/blood-2007-04-082099. [DOI] [PubMed] [Google Scholar]
- 27.Maa MC, Chang MY, Hsieh MY, Chen YJ, Yang CJ, Chen ZC, et al. Butyrate reduced lipopolysaccharide-mediated macrophage migration by suppression of Src enhancement and focal adhesion kinase activity. J Nutr Biochem. 2010;21:1186–92. doi: 10.1016/j.jnutbio.2009.10.004. [DOI] [PubMed] [Google Scholar]
- 28.Mologni L, Cleris L, Magistroni V, Piazza R, Boschelli F, Formelli F, et al. Valproic acid enhances bosutinib cytotoxicity in colon cancer cells. Int J Cancer. 2009;124:1990–6. doi: 10.1002/ijc.24158. [DOI] [PubMed] [Google Scholar]
- 29.Peled A, Kollet O, Ponomaryov T, Petit I, Franitza S, Grabovsky V, et al. The chemokine SDF-1 activates the integrins LFA-1, VLA-4, and VLA-5 on immature human CD34(+) cells: role in transendothelial/stromal migration and engraftment of NOD/SCID mice. Blood. 2000;95:3289–96. [PubMed] [Google Scholar]
- 30.Vicente-Manzanares M, Horwitz AR. Adhesion dynamics at a glance. J Cell Sci. 2011;124:3923–7. doi: 10.1242/jcs.095653. [DOI] [PMC free article] [PubMed] [Google Scholar]
- 31.Poincloux R, Cougoule C, Daubon T, Maridonneau-Parini I, Le Cabec V. Tyrosine-phosphorylated STAT5 accumulates on podosomes in Hck-transformed fibroblasts and chronic myeloid leukemia cells. J Cell Physiol. 2007;213:212–20. doi: 10.1002/jcp.21112. [DOI] [PubMed] [Google Scholar]
- 32.Kuželová K, Grebeňová D, Brodská B. Dose-dependent effects of the caspase inhibitor Q-VD-OPh on different apoptosis-related processes. J Cell Biochem. 2011;112:3334–42. doi: 10.1002/jcb.23263. [DOI] [PubMed] [Google Scholar]


